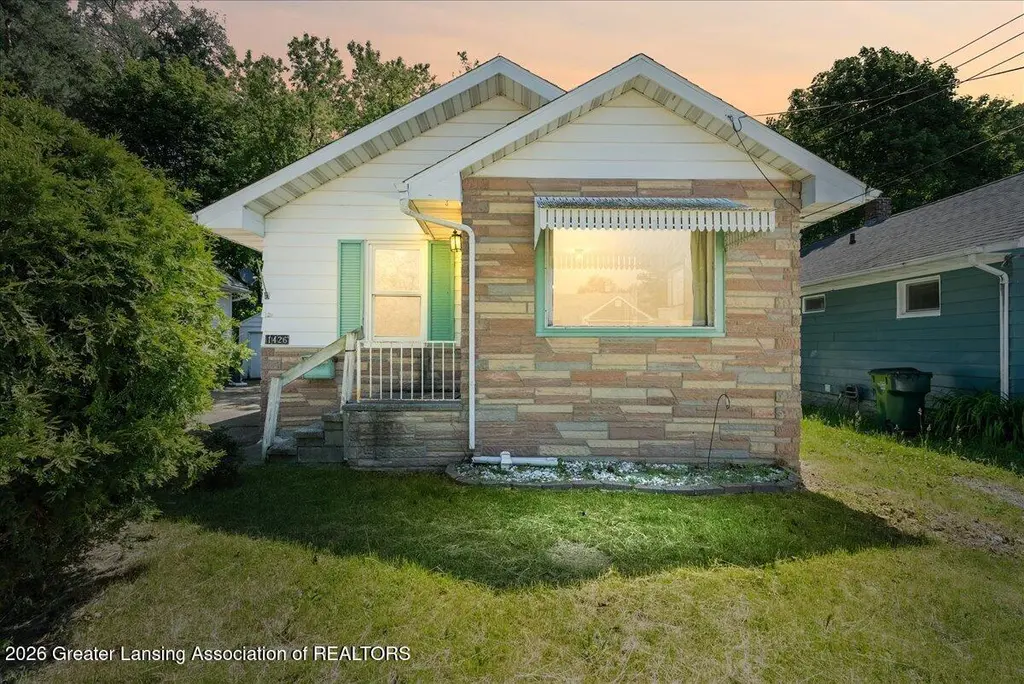
1426 Roseneath Ave · Lansing, MI
Flood risk 4/10 · Minor
- FEMA flood zone
- X (unshaded)
- Chance of flooding over 30 yrs
- 0.22%
- Est. flood insurance / yr
- $473 – $860
Fire risk 1/10 · Minimal
- Est. fire insurance / yr
- $784 – $1,456
Heat risk 2/10 · Minimal
- Hot days now (above 97°F)
- 7 days/yr
- Hot days in 30 yrs
- 16 days/yr
Wind risk 2/10 · Minimal
- Chance of severe wind over 30 yrs
- —
Air-quality risk 2/10 · Minimal
- Unhealthy air days now
- 1 days/yr
- Unhealthy air days in 30 yrs
- 2 days/yr
Risk factors via First Street. Map © Google.
Why this score? — see what drove the D- grade
The composite is a weighted blend of 9 inputs, each scored 0–100. Each bar is that input's sub-score; the figure is the points it added to the 100-point composite (weight × sub-score).
- Cash flow +15.2/30.0
- 1% rule +5.7/10.0
- DSCR +4.7/10.0
- Livability +4.0/5.0
- Rent growth +2.5/5.0
- Condition / age +2.5/5.0
- Schools +1.9/10.0
- ARV discount +0.0/15.0
- Appreciation +0.0/10.0
$97,000
🖨 Deal sheet (PDF) 📄 Offer letter ✓ Due diligence
Listing remarks MLS
Welcome to 1426 Roseneath! This move-in ready ranch-style home is ready for its new owner. Featuring 2 bedrooms, 1 full bathroom, and an open floor plan from the kitchen to the living room, this home offers comfortable and convenient living. Additional features include a full basement, fully fenced backyard, 1.5-car detached garage, and the property remains fully furnished. There is even a doggy door on the back exterior of the home for your pet's convenience! This home is a great opportunity for first-time home buyers, buyers looking to downsize, students, or investors. The value cannot be beat -- schedule your tour today!
Key facts
- Open floor plan
- Doggy door
- Full basement
Tags
Property features AI
Exterior
- Parking: Detached garage (approximately 1.5 car)
- Utilities: Public sewer; High-speed internet available, Cable available
- Home design: Ranch-style home; One level; Built in 1927; Front faces west
- Construction: Stone and aluminum siding exterior; Shingle roof
- Exterior features: Back yard with fencing
Interior
- Kitchen: Microwave, Oven, Refrigerator
- Bedrooms: 2 bedrooms (Primary bedroom, Bedroom 2)
- Flooring: Hardwood floors
- Bathrooms: 1 full bathroom
- Heating & cooling: Forced air heating (natural gas); No cooling
- Interior features: Full basement; Microwave, Oven, Refrigerator, Water Heater
- Laundry & utility: Laundry located on the lower level
Neighborhood map
What this means for you Summary
Snapshot
- This is a 2-bed/1.0-bath single-family listed at $97k.
Deal economics
- At list price, monthly cash flow is $34 ($408/yr) — positive.
- The deal already cash-flows at list — no discount required.
- Meets the 1% rule at list price ($1k rent vs $97k).
Location & tenants
- Location reads 79/100 on livability (#94 in MI, #2,182 nationally) — a middle-class / working-renter tenant base. Strengths: amenities A+, commute A+, cost of living A+; Watch: employment D, crime F.
- Lansing Public School District (urban): math 14% / reading 23% proficiency, ranked #650 of 760 in MI (top 86%) — low school quality limits family demand, transient renter base, plan for 1-2y turnover; 68% free/reduced lunch — lower-income household profile, screen leases tightly.
- Zoned schools: Pattengill School (600 students, 88% FRL) — zoned schools average 88% FRL vs 68% district-wide (21 pts higher); higher-poverty schools than district average — tighter screening recommended.
- Market conditions: 67 active listings in the ZIP; 29 comparable units currently listed for rent nearby; rentals lingering (median 46d on market — plan ~5-8 weeks vacancy on turnover, expect pricing pressure); 66% of comp listings sitting > 30 days — soft ceiling on asking rent; 350 units permitted in Ingham County in 2024 (186 in 5+ unit buildings).
Forward outlook
- Local home prices are declining (-3.0%/yr); year-one equity from $671 of loan paydown is wiped out by about $3k of value loss. Plan a longer hold.
- Ingham County population projected at +11% by 2050 — modest demand growth; plan on rents tracking national, not racing it.
Negotiation context
- Only 6 days on market — expect competitive offers; lowballing is unlikely to land.
- 7 sale attempts since 15y ago with the ask held roughly flat each time — persistent listings suggest the price (not the market) is what's stuck; bring a comps-based counter.
- Current owner paid $75k; 29% above their basis — modest negotiation headroom, anchor on the comps not their cost.
Risks & watch-outs
- Watch-outs: property tax is 2.9% of price; built in 1927 — expect roof / HVAC / electrical / plumbing capex.
Questions for the listing agent
- Built in 1927 — when were the roof, HVAC, electrical panel, plumbing, and water heater last replaced?
- Property tax is high relative to price — has the assessment been appealed recently, and will the sale trigger a re-assessment?
- Is there a deadline driving the sale (1031 exchange, divorce, estate, relocation)? That informs how much negotiation room exists.
- Schools are F-rated, which usually means shorter tenancies and higher turnover. Who's the typical renter profile here, and what's been the actual vacancy rate?
- Crime grade is F in this area — have there been break-ins, vandalism, or insurance claims at this property in the last 3 years? What carrier currently insures it and at what premium?
- The area grade is low — what's the realistic commute time and amenity access for the typical tenant pool here? Any planned neighborhood developments (good or bad) we should know about?
- What's the average days-on-market for RENTAL listings here right now (not sales)? A rising rental-DOM trend means longer vacancies and softer asking-rent achievability than the comps imply.
- What's the recent tenant-quality profile in this submarket — average credit score on applications, eviction rate, late-payment / NSF rate, and stable-employment percentage? A property-management company in the area should have these aggregated.
- How much new for-sale + rental construction is in the pipeline within 1–3 miles? Heavy new supply typically softens prices + rents 12–24 months out; constrained supply supports both.
Investment metrics
- 1% rule
- 1.07% ✓
- Cap rate
- 6.71%
- Cash-on-cash
- 1.50%
- DSCR
- 1.07
- GRM
- 7.8
CMA / ARV
- ARV (on-the-fly)
- $78,667
- Comps found
- 12
Show comp detail 12 sales within ~0.75 mi
| Address | Dist | Beds/Ba | Sqft | Sold | Price | $/sf | Match |
|---|---|---|---|---|---|---|---|
| 1129 N Martin Luther King Jr Blvd | 0.28mi | 2/1.0 | 798 (-2%) | 4mo | $52,500 | $66 | 81 |
| 1706 N Martin Luther King Jr Blvd | 0.24mi | 3/1.0 (+1) | 818 (+1%) | 3mo | $129,900 | $159 | 80 |
| 1522 Robertson Ave | 0.15mi | 3/1.0 (+1) | 866 (+7%) | 1mo | $45,000 | $52 | 76 |
| 1112 W Willow St | 0.20mi | 3/1.0 (+1) | 870 (+7%) | 4mo | $96,000 | $110 | 70 |
| 1004 Greenwood Ave | 0.15mi | 3/2.0 (+1) | 878 (+8%) | 3mo | $121,000 | $138 | 67 |
| 1230 Glenn St | 0.34mi | 2/1.0 | 875 (+8%) | 5mo | $43,000 | $49 | 67 |
| 1441 Knollwood Ave | 0.17mi | 3/1.0 (+1) | 910 (+12%) | 2mo | $46,000 | $51 | 65 |
| 1624 W Willow St | 0.43mi | 2/1.0 | 900 (+11%) | 1mo | $87,000 | $97 | 61 |
| 1016 Cleo St | 0.61mi | 3/1.0 (+1) | 875 (+8%) | 5mo | $100,150 | $114 | 49 |
| 819 Cawood St | 0.69mi | 2/1.0 | 726 (-10%) | 4mo | $55,000 | $76 | 47 |
| 912 Cleo St | 0.68mi | 2/1.0 | 911 (+12%) | 5mo | $150,000 | $165 | 44 |
| 901 Clayton St | 0.54mi | 3/1.0 (+1) | 925 (+14%) | 4mo | $69,000 | $75 | 43 |
Match score weights: distance 35% · size 25% · config 20% · recency 20%. Top-matched comps best support the ARV.
Projected returns pro-forma
-3.0% appreciation · 3.0% rent growth · sell at horizon
- IRR
- -13.8%
- Equity multiple
- 0.50×
- Total profit
- $-13,464
- Equity at exit
- $14,463
- IRR
- -4.8%
- Equity multiple
- 0.68×
- Total profit
- $-8,582
- Equity at exit
- $8,387
Cash invested: $27,160 (down + closing). Projections, not guarantees.
Landlord ↔ Tenant lean methodology
- Overall (STATE)
- 62 Landlord-Friendly
- State Michigan
- 62 Landlord-Friendly · EVEN
- County
- — inherits STATE
- City
- — inherits STATE
ZIP-level market 48915
- Active inventory
- 67
- Price-to-rent
- 7.8×
Monthly cashflow live
- Estimated rent
- $1,038 high interval (Pro) →
- Mortgage (P&I)
- −$509
- Tax from tax record
- −$237 /mo · $2,840/yr
- Insurance
- −$40
- HOA
- −$0
- Vacancy / Maint / Mgmt
- −$218
- Net cashflow
- $34
Break-even live
Sensitivity live
| Price | -10% $89 | -5% $61 | +0% $34 | +5% $7 | +10% $-21 |
|---|---|---|---|---|---|
| Rent | -10% $-48 | -5% $-7 | +0% $34 | +5% $75 | +10% $116 |
| Rate | -1.0pp $83 | -0.5pp $59 | base $34 | +0.5pp $9 | +1.0pp $-17 |
UW: 25.0% down · 7.5% · 30yr · 1.5% tax · 5.0% vac · 8.0% maint · 8.0% mgmt
Financing live
Cash to close
- Down payment
- $24,250
- Closing costs
- $2,910
- Reserves months
- —
- Total cash needed
- —
Loan-product check · same deal, 3 products live
Conventional
25% down · 7.5% · 30yr
- Down + closing
- —
- Monthly P&I
- —
- Monthly cashflow
- —
- DSCR
- —
- Eligible?
- —
Personal DTI + credit; lowest rate.
DSCR
20% down · 8.5% · 30yr
- Down + closing
- —
- Monthly P&I
- —
- Monthly cashflow
- —
- DSCR
- —
- Eligible?
- —
No personal income docs; deal must DSCR.
Hard money
10% down · 12.0% · 12mo
- Down + closing
- —
- Monthly P&I
- —
- Monthly cashflow
- —
- DSCR
- —
- Eligible?
- —
Short-term bridge; refi at stabilization.
Rent comps 29 comps
| Address | Beds | Baths | Sqft | Rent | $/sqft | DOM | Units | Dist |
|---|---|---|---|---|---|---|---|---|
| 1443 Roselawn Ave Lansing, MI | 2.0 | 1.0 | 656 | $750 | $1.14 | 45d | 1 | 0.17mi |
| 919 Princeton Ave Lansing, MI | 3.0 | 1.5 | 1119 | $1,475 | $1.32 | 23d | 1 | 0.47mi |
| 1216 N Chestnut St Lansing, MI | 1.0 | 1.0 | 562 | $900 | $1.60 | 15d | 1 | 0.51mi |
| 1010 N Pine St Unit B Lansing, MI | 2.0 | 1.0 | 750 | $1,100 | $1.47 | 45d | 1 | 0.54mi |
| 731 N Sycamore St Unit 1 Lansing, MI | 2.0 | 1.0 | 950 | $945 | $0.99 | 45d | 1 | 0.68mi |
| 712 N Sycamore St Lansing, MI | 3.0 | 1.0 | 1100 | $1,650 | $1.50 | 23d | 1 | 0.72mi |
| 826 N Walnut St Lansing, MI | 1.0 | 1.0 | 700 | $700 | $1.00 | 45d | 2 | 0.76mi |
| 117 E North St Unit A Lansing, MI | 2.0 | 1.0 | 812 | $1,050 | $1.29 | 15d | 1 | 0.78mi |
| 1016 N Capitol Ave Unit 1 Lansing, MI | 1.0 | 1.0 | 700 | $850 | $1.21 | 45d | 1 | 0.79mi |
| 610 N Sycamore St Unit 1 Lansing, MI | 1.0 | 1.0 | 900 | $875 | $0.97 | 15d | 1 | 0.79mi |
| 1025 N Washington Ave Unit 9 Lansing, MI | 1.0 | 1.0 | 670 | $1,000 | $1.49 | 45d | 1 | 0.82mi |
| 504 W Lapeer St Apt A Lansing, MI | 2.0 | 1.0 | 600 | $895 | $1.49 | 45d | 1 | 0.86mi |
| 316 W Saginaw St Unit 318 Lansing, MI | 1.0 | 1.0 | 750 | $950 | $1.27 | 45d | 1 | 0.87mi |
| 801 N Capitol Ave Unit 4 Lansing, MI | 1.0 | 1.0 | 600 | $1,000 | $1.67 | 45d | 1 | 0.89mi |
| 801 N Capitol Ave Unit 1 Lansing, MI | 1.0 | 1.0 | 550 | $950 | $1.73 | 45d | 1 | 0.89mi |
| 323 W Saginaw St Unit 1 Lansing, MI | 1.0 | 1.0 | 1000 | $1,000 | $1.00 | 45d | 1 | 0.89mi |
| 410 W Lapeer St Unit 1 Lansing, MI | 2.0 | 1.0 | 800 | $1,050 | $1.31 | 23d | 1 | 0.89mi |
| 524 N Walnut St Lansing, MI | 2.0 | 1.0 | 1000 | $1,150 | $1.15 | 45d | 1 | 0.95mi |
| 927 W Shiawassee St Unit 10 Lansing, MI | 1.0 | 1.0 | 700 | $845 | $1.21 | 45d | 1 | 0.97mi |
| 314 N Sycamore St Unit 1 Lansing, MI | 1.0 | 1.0 | 800 | $1,450 | $1.81 | 45d | 1 | 1.04mi |
| 427 Seymour Ave Unit 315 Lansing, MI | 2.0 | 1.0 | 550 | $1,300 | $2.36 | 23d | 1 | 1.05mi |
| 427 Seymour Ave Unit 315 Lansing, MI | 2.0 | 1.0 | 550 | $1,300 | $2.36 | 45d | 1 | 1.05mi |
| 427 Seymour Ave Unit 205 Lansing, MI | 1.0 | 1.0 | 570 | $1,100 | $1.93 | 45d | 1 | 1.05mi |
| 427 Seymour Ave Unit 102 Lansing, MI | 1.0 | 1.0 | 540 | $850 | $1.57 | 23d | 1 | 1.05mi |
| 307 N Walnut St Unit 307 Lansing, MI | 1.0 | 1.0 | 550 | $1,100 | $2.00 | 45d | 1 | 1.13mi |
| 832 N Larch St Apt 3 Lansing, MI | 2.0 | 1.0 | 890 | $1,095 | $1.23 | 45d | 1 | 1.27mi |
| 620 May St Lansing, MI | 1.0–2.0 | 1.0–2.0 | 1126 | $1,578 | $1.40 | 15d | 12 | 1.35mi |
| 1109 W Washtenaw St Unit 5 Lansing, MI | 2.0 | 1.0 | 755 | $795 | $1.05 | 45d | 1 | 1.37mi |
| 400 N Catherine St Lansing, MI | 3.0 | 1.0 | 760 | $1,395 | $1.84 | 15d | 1 | 1.49mi |
Listing history 7 events
-
2026-06-05statusdays on market $97,000 Pending 6 DOM
-
2026-06-03days on market $97,000 Active 5 DOM
-
2026-06-02days on market $97,000 Active 4 DOM
-
2026-06-01days on market $97,000 Active 3 DOM
-
2026-05-31days on market $97,000 Active 2 DOM
-
2026-05-30remarks 630-char remark
-
2026-05-30$97,000 Active 1 DOM
ⓘ Source: listings_history table (triggers on properties + properties_extension) + one-shot
backfill from property_details.listing_events for pre-trigger history.
Tax reassessment forecast MI · Partial reset (capped growth)
- Current annual tax
- $2,840 · $237/mo
- Projected year-2 tax
- $2,840 · $237/mo
- Expected delta
- $0/yr ($0/mo · 0.0%)
ⓘ Screening estimate from a state-policy table — verify with the county assessor before closing.
Climate risk First Street
- Flood 4/10 Moderate FEMA zone X (unshaded) · 22% chance over 30 yrs
- Wildfire 1/10 Low
- Heat 2/10 Low 7 d/yr ≥97°F today · 16 d/yr by 30 yrs out
- Wind 2/10 Low
- Air quality 2/10 Low 1 unhealthy d/yr today · 2 by 30 yrs out
Nearby sold comps map
Loading sold comps map…
Walkable amenities ~0.75 mi
Loading nearby amenities…
Taxation est. · year 1
- Rental income
- $12,452
- − Mortgage interest
- −$5,434
- − Property taxes
- −$2,840
- − Insurance
- −$485
- − Repairs & maintenance
- −$996
- − Management
- −$996
- − Depreciation
- −$2,822
- Taxable loss
- −$1,120
- Est. tax savings @ 24.0%
- +$269
- After-tax cash flow
- $677/yr
For passive investors: Depreciation is non-cash, so a rental often shows a tax loss while cash-flowing — sheltering income. Rental losses are passive: they offset passive income freely, and up to $25,000/yr can offset ordinary (W-2) income if you actively participate and your MAGI is under $100k (phasing out to $0 by $150k); unused losses carry forward. On sale, claimed depreciation is recaptured at up to 25%, and gains may owe capital-gains tax (a 1031 exchange can defer both). Figures are a year-1 estimate at your 24.0% rate — not tax advice; consult a CPA.
Schools (NCES district)
- District
- Lansing Public School District
- NCES district ID
- 2621150
- Math proficiency
- 14% ▲ 1.00%
- Reading proficiency
- 23% ▲ 3.00%
- Median HH income
- $37,453
- Composite
- 18.76/100
- National rank
- #14002
- State rank
- #650 of 760 in MI
Livability — Lansing
- Score
- 79/100
- State rank
- #94
- US rank
- #2182
Category grades
Schools grade is shown separately in the Schools card above.
Census & demographics
- Census place
- Lansing, MI
- County
- Ingham County · 237,052 people
- City population
- 161,269
- Metro
- Lansing-East Lansing, MI
- Population (ZIP)
- 9,428
- Household income
- $54,465
- Rent vs Own
- Severe rent burden
- 307.0
Population outlook (Ingham County) Hauer SSP2
- Today (2025)
- 300,362 people
- By 2030
- 307,808 · +2.5%
- By 2040
- 320,492 · +6.7%
- By 2050
- 333,223 · +10.9%
- By 2075
- 373,693 · +24.4%
- By 2100
- 392,021 · +30.5%
Race, ethnicity, and origin ACS 2023
- Neighborhood character
- Diverse neighborhood (Simpson 0.64)
- Race & ethnicity
- White 54% Black 24% Two or more races 13% Hispanic / Latino 13%
- Hispanic origin (detail)
- Mexican 10%
- Common ancestry
- Romanian 7% Lithuanian 2% Iranian 2%
- Foreign-born
- 5% · Canada, Philippines
- Languages at home
- 90% English-only · Spanish 7% Other Asian/Pacific 1% German/W. Germanic 1%
Political lean MEDSL · Ingham
- 2024 margin
- Strong D (+29.7) · D 63.9% · R 34.2% · Other 2.0%
- 2008→2024 swing
- -3.6pp toward R · 2008: 33.3pp · 2024: 29.7pp
- All cycles
- 2024: D+29.7 2020: D+32.2 2016: D+27.6 2012: D+27.9 2008: D+33.3
Not yet ingested
- Civics
- —
Market trends
- HPI YoY
- ▼ -129.90%
- Current HPI
- 177.0906
- Rent YoY
- —
- Metro
- Lansing-East Lansing, MI
- State GDP YoY
- ▲ 1.37%
- F500 in state
- 28
Industry mix (Fortune 500 HQ in MI)
| Industry | F500 HQs | Revenue |
|---|---|---|
| Automotive Parts | 3 | $48B |
|
||
| Automotive | 2 | $372B |
|
||
| Chemicals | 1 | $45B |
|
||
| Automotive Retail | 1 | $29B |
|
||
| Healthcare / Medical Devices | 1 | $23B |
|
||
| Automotive Technology | 1 | $20B |
|
||
Price history
+525.8% since first listed15 events — show timeline
- 2026-05-29 Listed $97,000 Greater Lansing AoR
- 2026-05-29 Listed $97,000 REALCOMP
- 2022-09-08 Sold (Public Records) $75,000 Public Records
- 2022-08-24 Sold (MLS) $75,000 Greater Lansing AoR
- 2022-08-24 Sold (MLS) $75,000 REALCOMP
- 2022-08-19 Pending — Greater Lansing AoR
- 2022-07-14 Price Changed $80,000 Greater Lansing AoR
- 2022-06-07 Listed $85,000 Greater Lansing AoR
- 2022-06-07 Listed $80,000 REALCOMP
- 2021-07-31 Listing Removed — REALCOMP
- 2021-07-31 Listing Removed — Greater Lansing AoR
- 2021-05-10 Listed $59,239 REALCOMP
- 2021-05-10 Listed $59,239 Greater Lansing AoR
- 2011-04-26 Sold (MLS) $12,750 Greater Lansing AoR
- 2011-02-03 Listed $15,500 Greater Lansing AoR
Property tax history
+4.9%/yrLatest (2025): $2,840 · +3.0% YoY. Source: county tax records.
Cash-flow waterfall
monthlySold comps — $/sqft
last 12 mo · ≤1 miLoading sold comps…