273 Shannon Rd · Essex Junction, VT
Flood risk No data
- FEMA flood zone
- —
- Chance of flooding over 30 yrs
- %
- Est. flood insurance / yr
- —
Fire risk No data
- Est. fire insurance / yr
- —
Heat risk No data
- Hot days now (above °F)
- days/yr
- Hot days in 30 yrs
- days/yr
Wind risk No data
- Chance of severe wind over 30 yrs
- %
Air-quality risk No data
- Unhealthy air days now
- days/yr
- Unhealthy air days in 30 yrs
- days/yr
Risk factors via First Street. Map © Google.
Why this score? — see what drove the B- grade
The composite is a weighted blend of 9 inputs, each scored 0–100. Each bar is that input's sub-score; the figure is the points it added to the 100-point composite (weight × sub-score).
- Cash flow +27.1/30.0
- 1% rule +10.0/10.0
- DSCR +9.4/10.0
- Schools +5.0/10.0
- Livability +4.6/5.0
- ARV discount +3.8/15.0
- Rent growth +2.5/5.0
- Condition / age +2.5/5.0
- Appreciation +0.0/10.0
$144,900
🖨 Deal sheet 📄 Offer letter ✓ Due diligence
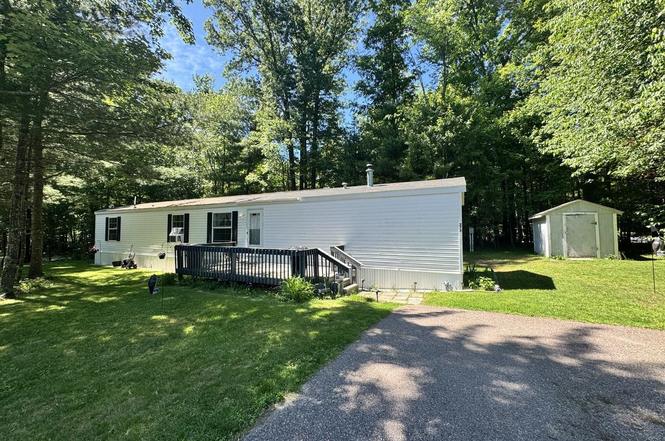
Listing remarks
One-level living in desirable Westbury Park! This well-maintained, 3-bedroom, 1-bath home is nestled on a wooded lot with plenty of parking in a convenient Colchester location close to Essex Junction, shopping, dining, and local amenities. Recent improvements include newer stainless-steel kitchen appliances, a new furnace (2023), newer carpeting in the bedrooms, and updated flooring in the bathroom, kitchen, laundry room, and hallway, along with other thoughtful updates throughout. Enjoy outdoor living on the spacious front deck, extra storage in the garden shed, and access to Westbury Park's amenities including an in-ground pool, clubhouse, and tennis courts. A wonderful opportunity to own
Key facts
- New furnace
- Wooded lot
- One-level living
Tags
Neighborhood map
What this means for you Summary
Snapshot
- This is a 3-bed/1.0-bath manufactured listed at $145k.
Deal economics
- At list price, monthly cash flow is $412 ($5k/yr) — positive.
- The deal already cash-flows at list — no discount required.
- Meets the 1% rule at list price ($2k rent vs $145k).
- Cap rate 9.7% vs local median 2.5% in Essex Junction — top-decile yield for the area; either an underpriced asset or a hidden risk that comps aren't pricing in. Stress-test before assuming the spread holds.
Location & tenants
- Location reads 92/100 on livability (#1 in VT, #25 nationally) — a professional / high-income tenant draw. Strengths: schools A+, crime A+, amenities A+; Watch: cost of living D.
- Market conditions: 89 active listings in the ZIP; 3 comparable units currently listed for rent nearby; rentals at typical pace (median 21d on market — plan ~3-4 weeks tenant-placement turnaround); solid renter incomes; 898 units permitted in Chittenden County in 2024 (554 in 5+ unit buildings).
- This rent runs 30% of the median local income ($97k/yr) — at the standard rent-burdened threshold; future hikes will face affordability resistance.
Forward outlook
- Local home prices are declining (-3.0%/yr); year-one equity from $1k of loan paydown is wiped out by about $4k of value loss. Plan a longer hold.
- Chittenden County population projected at +8% by 2050 — modest demand growth; plan on rents tracking national, not racing it.
- At projected returns (-3.0% appreciation + 3.0% rent growth), your $41k cash investment doubles in ~10 years — after that, you're playing with house money.
Negotiation context
- Only 1 days on market — expect competitive offers; lowballing is unlikely to land.
Risks & watch-outs
- Watch-outs: HOA is 22% of rent.
Questions for the listing agent
- What does the HOA fee cover, when was the last increase, and are there any pending special assessments or reserve-fund shortfalls?
- Is there a deadline driving the sale (1031 exchange, divorce, estate, relocation)? That informs how much negotiation room exists.
- Schools are A-rated — typically a magnet for longer-tenancy family renters. What's the average tenant stay here, and is there a school-zone premium baked into asking?
- What's the average days-on-market for RENTAL listings here right now (not sales)? A rising rental-DOM trend means longer vacancies and softer asking-rent achievability than the comps imply.
- What's the recent tenant-quality profile in this submarket — average credit score on applications, eviction rate, late-payment / NSF rate, and stable-employment percentage? A property-management company in the area should have these aggregated.
- How much new for-sale + rental construction is in the pipeline within 1–3 miles? Heavy new supply typically softens prices + rents 12–24 months out; constrained supply supports both.
Investment metrics
- 1% rule
- 1.71% ✓
- Cap rate
- 9.71%
- Cash-on-cash
- 12.20%
- DSCR
- 1.54
- GRM
- 4.9
CMA / ARV
- ARV (on-the-fly)
- $133,980
- Comps found
- 11
Show comp detail 11 sales within ~0.75 mi
| Address | Dist | Beds/Ba | Sqft | Sold | Price | $/sf | Match |
|---|---|---|---|---|---|---|---|
| 19 Wyndham Rd | 0.05mi | 2/1.5 (-1) | 924 (0%) | 8mo | $84,900 | $92 | 84 |
| 95 Shannon Rd | 0.09mi | 2/2.0 (-1) | 924 (0%) | 4mo | $65,000 | $70 | 83 |
| 142 Shannon Rd | 0.08mi | 2/2.0 (-1) | 924 (0%) | 13mo | $152,500 | $165 | 77 |
| 44 Wentworth Rd | 0.07mi | 2/1.0 (-1) | 868 (-6%) | 11mo | $95,000 | $109 | 73 |
| 242 Waverly Cir | 0.40mi | 2/2.0 (-1) | 924 (0%) | 2mo | $75,000 | $81 | 71 |
| 181 Wexford Ln | 0.48mi | 2/2.0 (-1) | 907 (-2%) | 4mo | $162,000 | $179 | 62 |
| 235 Waverly Cir | 0.38mi | 2/2.0 (-1) | 938 (+2%) | 11mo | $70,000 | $75 | 61 |
| 112 Shannon Rd | 0.09mi | 2/2.0 (-1) | 880 (-5%) | 22mo | $145,000 | $165 | 60 |
| 184 Waverly Cir | 0.33mi | 2/1.0 (-1) | 896 (-3%) | 20mo | $130,000 | $145 | 58 |
| 111 Brennan St | 0.20mi | 2/1.0 (-1) | 826 (-11%) | 20mo | $125,000 | $151 | 51 |
| 10 Waverly Cir | 0.42mi | 2/2.0 (-1) | 840 (-9%) | 7mo | $135,000 | $161 | 50 |
Match score weights: distance 35% · size 25% · config 20% · recency 20%. Top-matched comps best support the ARV.
Projected returns pro-forma
-3.0% appreciation · 3.0% rent growth · sell at horizon
- IRR
- 2.0%
- Equity multiple
- 1.08×
- Total profit
- $3,155
- Equity at exit
- $21,605
- IRR
- 11.8%
- Equity multiple
- 1.94×
- Total profit
- $38,072
- Equity at exit
- $12,528
Cash invested: $40,572 (down + closing). Projections, not guarantees.
Landlord ↔ Tenant lean methodology
- Overall (STATE)
- 41 Moderately Tenant-Leaning
- State Vermont
- 41 Moderately Tenant-Leaning · D+15
- County
- — inherits STATE
- City
- — inherits STATE
ZIP-level market 05446
- Home prices YoY
- -24.4%
- Active inventory
- 89
- Price-to-rent
- 4.9×
Monthly cashflow live
- Estimated rent
- $2,476 medium interval (Pro) →
- Mortgage (P&I)
- −$760
- Tax est. 1.5%
- −$181 /mo · $2,174/yr
- Insurance
- −$60
- HOA
- −$542
- Vacancy / Maint / Mgmt
- −$520
- Net cashflow
- $412
Break-even live
UW: 25.0% down · 7.5% · 30yr · 1.5% tax · 5.0% vac · 8.0% maint · 8.0% mgmt
Financing live
Cash to close
- Down payment
- $36,225
- Closing costs
- $4,347
- Reserves months
- —
- Total cash needed
- —
Loan-product check · same deal, 3 products live
Conventional
25% down · 7.5% · 30yr
- Down + closing
- —
- Monthly P&I
- —
- Monthly cashflow
- —
- DSCR
- —
- Eligible?
- —
Personal DTI + credit; lowest rate.
DSCR
20% down · 8.5% · 30yr
- Down + closing
- —
- Monthly P&I
- —
- Monthly cashflow
- —
- DSCR
- —
- Eligible?
- —
No personal income docs; deal must DSCR.
Hard money
10% down · 12.0% · 12mo
- Down + closing
- —
- Monthly P&I
- —
- Monthly cashflow
- —
- DSCR
- —
- Eligible?
- —
Short-term bridge; refi at stabilization.
Rent comps 3 comps
| Address | Beds | Baths | Sqft | Rent | $/sqft | DOM | Units | Dist |
|---|---|---|---|---|---|---|---|---|
| 114 Dylan Ave Colchester, VT | 2.0 | 2.0 | 967 | $2,650 | $2.74 | 20d | 1 | 0.99mi |
| 65 Griffin Ln Unit 65-102 Essex Junction, VT | 2.0 | 1.0 | 960 | $1,975 | $2.06 | 44d | 1 | 1.40mi |
| 85 Griffin Ln Essex Junction, VT | 2.0 | 2.0 | 1000 | $2,180 | $2.18 | 20d | 1 | 1.43mi |
HOA detail
- Monthly dues
- $542 · $6,504/yr
- Likely covers
- pool
Listing history 2 events
-
2026-06-19remarks 699-char remark
-
2026-06-19$144,900 Active 1 DOM
ⓘ Source: listings_history table (triggers on properties + properties_extension) + one-shot
backfill from property_details.listing_events for pre-trigger history.
Nearby sold comps map
Loading sold comps map…
Walkable amenities ~0.75 mi
Loading nearby amenities…
Taxation est. · year 1
- Rental income
- $29,708
- − Mortgage interest
- −$8,117
- − Property taxes
- −$2,174
- − Insurance
- −$724
- − Repairs & maintenance
- −$2,377
- − Management
- −$2,377
- − HOA
- −$6,504
- − Depreciation
- −$4,215
- Taxable income
- $3,220
- Est. tax owed @ 24.0%
- −$773
- After-tax cash flow
- $4,176/yr
For passive investors: Depreciation is non-cash, so a rental often shows a tax loss while cash-flowing — sheltering income. Rental losses are passive: they offset passive income freely, and up to $25,000/yr can offset ordinary (W-2) income if you actively participate and your MAGI is under $100k (phasing out to $0 by $150k); unused losses carry forward. On sale, claimed depreciation is recaptured at up to 25%, and gains may owe capital-gains tax (a 1031 exchange can defer both). Figures are a year-1 estimate at your 24.0% rate — not tax advice; consult a CPA.
Schools (NCES district)
No district data.
Livability — Essex Junction
- Score
- 92/100
- State rank
- #1
- US rank
- #25
Category grades
Schools grade is shown separately in the Schools card above.
Census & demographics
- County
- Chittenden County · 110,603 people
- Metro
- Burlington-South Burlington, VT
- Population (ZIP)
- 16,452
- Household income
- $97,475
- Rent vs Own
- Severe rent burden
- 259.0
Population outlook (Chittenden County) Hauer SSP2
- Today (2025)
- 170,769 people
- By 2030
- 174,716 · +2.3%
- By 2040
- 180,337 · +5.6%
- By 2050
- 183,768 · +7.6%
- By 2075
- 194,646 · +14.0%
- By 2100
- 194,933 · +14.2%
Race, ethnicity, and origin ACS 2023
- Neighborhood character
- Predominantly White (86%)
- Race & ethnicity
- White 86% Two or more races 6% Hispanic / Latino 4% Black 2% Asian 2%
- Common ancestry
- Lithuanian 14% Italian 4% Slovak 3%
- Foreign-born
- 9% · Canada, India, China
- Languages at home
- 91% English-only · French/Haitian/Cajun 2% Other Indo-European 2% Russian/Polish/Slavic 2%
Political lean MEDSL · Chittenden
- 2024 margin
- Solid D (+53.6) · D 75.4% · R 21.7% · Other 2.9%
- 2008→2024 swing
- +8.9pp toward D · 2008: 44.8pp · 2024: 53.6pp
- All cycles
- 2024: D+53.6 2020: D+54.5 2016: D+46.8 2012: D+41.9 2008: D+44.8
Not yet ingested
- Civics
- —
Market trends
- HPI YoY
- ▼ -131.02%
- Current HPI
- 406.7675
- Rent YoY
- —
- Metro
- Burlington-South Burlington, VT
- State GDP YoY
- —
- F500 in state
- 0
Cash-flow waterfall
monthlySold comps — $/sqft
last 12 mo · ≤1 miLoading sold comps…