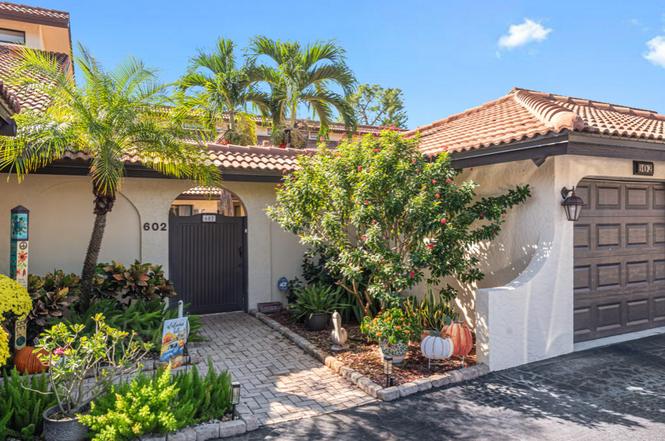
602 Augusta Blvd #3 · Lely, FL
Flood risk 7/10 · Major
- FEMA flood zone
- X (shaded)
- Chance of flooding over 30 yrs
- 0.75%
- Est. flood insurance / yr
- $507 – $1,088
Fire risk 2/10 · Minimal
- Est. fire insurance / yr
- $947 – $1,759
Heat risk 10/10 · Severe
- Hot days now (above 108°F)
- 7 days/yr
- Hot days in 30 yrs
- 30 days/yr
Wind risk 10/10 · Severe
- Chance of severe wind over 30 yrs
- 99.0%
Air-quality risk 2/10 · Minimal
- Unhealthy air days now
- 2 days/yr
- Unhealthy air days in 30 yrs
- 2 days/yr
Risk factors via First Street. Map © Google.
Why this score? — see what drove the D grade
The composite is a weighted blend of 9 inputs, each scored 0–100. Each bar is that input's sub-score; the figure is the points it added to the 100-point composite (weight × sub-score).
- Cash flow +11.9/30.0
- ARV discount +7.5/15.0
- Schools +5.0/10.0
- Rent growth +3.9/5.0
- DSCR +3.5/10.0
- 1% rule +3.4/10.0
- Livability +3.3/5.0
- Condition / age +2.5/5.0
- Appreciation +0.0/10.0
$425,000
🖨 Deal sheet 📄 Offer letter ✓ Due diligence
Listing remarks MLS
Rarely available and very lovely villa located in Lely Country Club Community. Two bedrooms + den/family room and 1 car garage. Enter through the attractive courtyard to an open floor plan with cathedral ceilings. A large lanai in the back, equipped with electric storm shutters, offers you a golf course view of the Royal Palm Country Club located nearby. Beautiful hardwood flooring in lall living areas, new refrigerator and microwave. AC and Hot water recently replaced. Close to downtown, restaurants and beaches.
Key facts
- Open floor plan
- Cathedral ceilings
- Large lanai
Tags
Property features AI
Finance
- Other: Part of a 24-unit complex with 4 units per building; Unit is one of 1 per floor in the building; Lot has deeded restrictions (no commercial, no RV); Property located in LELY COUNTRY CLUB development; Lot offers golf course view; Irrigation is central
- HOA & community: Mandatory HOA (professional management); Quarterly HOA fee; HOA covers irrigation water, lawn/land maintenance, manager, recreation facilities, reserves; Community amenities include bike/jog path, cabana, community pool, private membership option, streetlights, underground utilities; Non-gated community; Total annual recurring HOA fees $4,600 (quarterly fee listed as $1,150); One-time fees approximately $100
Exterior
- Parking: 1 assigned covered parking; Detached garage (1 car); Paved driveway; Guest parking
- Security: Electric storm shutters
- Utilities: Central water; Central sewer; Cable available
- Home design: Attached villa; Single-story; Rear exposure faces east; Residential property
- Construction: Concrete block construction; Stucco exterior; Tile roof; Single-hung windows; Built in 1986
- Exterior features: Courtyard; Patio; Screened lanai/porch; Automatic sprinkler system
Interior
- Kitchen: Pantry; Dishwasher; Disposal; Microwave; Range; Refrigerator/ice maker; Self-cleaning oven; Breakfast bar; Eat-in kitchen; Dining area open to living
- Bedrooms: 2 bedrooms plus den; Master on ground level; First-floor bedroom; Split bedrooms layout
- Flooring: Tile flooring; Wood flooring
- Bathrooms: 2 full bathrooms; Master bath with shower only
- Heating & cooling: Central electric heat; Central electric cooling; Ceiling fans
- Interior features: Built-in cabinets; Cable prewire; Cathedral ceilings; High-speed internet available; Pantry; Pull-down attic stairs; Smoke detectors; Window coverings; Turnkey furnished; 7 total rooms; Split bedroom floor plan; 8 ceiling fans
- Laundry & utility: Laundry in residence; Washer; Dryer
Neighborhood map
What this means for you Summary
Snapshot
- This is a 2-bed/2.0-bath condo listed at $425k.
Deal economics
- At list price, monthly cash flow is $-179 ($-2k/yr) — negative.
- To cash-flow at today's rent, offer at most $393k (7.4% below list).
- To meet the 1% rule (rent ≥ 1% of price), the offer needs to be $358k (15.9% below list).
- Recommended offer: $358k (15.9% below list) — sets the bar for 1% rule.
Location & tenants
- Location reads 66/100 on livability (#586 in FL) — a middle-class / working-renter tenant base. Strengths: crime A+, housing A+; Watch: schools D+, health & safety D, amenities F.
- Collier (suburban): math 60% / reading 56% proficiency, ranked #16 of 73 in FL (top 22%) — acceptable for families but not a draw, mixed tenant base, ~2y average lease.
- Market conditions: Rents rising fast (+5.6%/yr); 597 active listings in the ZIP; 40 comparable units currently listed for rent nearby; rentals at typical pace (median 23d on market — plan ~3-4 weeks tenant-placement turnaround); solid renter incomes; 3,520 units permitted in Collier County in 2024 (959 in 5+ unit buildings).
- At $3,576/mo this rent would consume 53% of the median local household income ($82k/yr) (locally 954% of renters already pay >50% of income on rent) — very limited rent-growth headroom before tenants either downsize or default.
Forward outlook
- Local home prices are declining (-3.0%/yr); year-one equity from $3k of loan paydown is wiped out by about $13k of value loss. Plan a longer hold.
- Collier County population projected at +30% by 2050 — long-run rental-demand tailwind backs the buy-and-hold thesis.
Negotiation context
- It's been on market 234 days — a 12% lower offer ($374k) is reasonable based on typical stale-listing flexibility.
- 2 sale attempts with the ask held roughly flat each time — persistent listings suggest the price (not the market) is what's stuck; bring a comps-based counter.
- Current owner paid $255k; list at $425k implies a 67% gain — meaningful room to come down on a strong offer.
Risks & watch-outs
- Watch-outs: flood insurance adds $66/mo.
- Climate carrying-cost: major flood risk; severe wind risk, 99% chance of damaging wind over 30y; extreme-heat days projected 7→30/yr by 2055 (HVAC capex compounding) — expect insurance premiums to compound above CPI over the hold.
Questions for the listing agent
- What do current leases actually rent for vs. the listed asking? Can we see a recent rent roll and the last 12 months of T-12 income?
- It's been on market 234 days. Have you received any prior offers? Is the seller open to a 16% concession, seller financing, or rate buy-down credit?
- What's the actual annual flood-insurance premium (NFIP or private), and is the property in a SFHA with mandatory coverage?
- What does the HOA fee cover, when was the last increase, and are there any pending special assessments or reserve-fund shortfalls?
- Any open or pending special assessments — roof, HVAC, plumbing, elevator, façade? What's the per-unit balance and payoff schedule, and is the seller paying it off at close or rolling it to the buyer?
- Why hasn't it sold? Are there any deal-killer items the seller is aware of (foundation, flood, title, zoning, code violations)?
- Is there a deadline driving the sale (1031 exchange, divorce, estate, relocation)? That informs how much negotiation room exists.
- Schools are D-rated, which usually means shorter tenancies and higher turnover. Who's the typical renter profile here, and what's been the actual vacancy rate?
- The area grade is low — what's the realistic commute time and amenity access for the typical tenant pool here? Any planned neighborhood developments (good or bad) we should know about?
- What's the average days-on-market for RENTAL listings here right now (not sales)? A rising rental-DOM trend means longer vacancies and softer asking-rent achievability than the comps imply.
- What's the recent tenant-quality profile in this submarket — average credit score on applications, eviction rate, late-payment / NSF rate, and stable-employment percentage? A property-management company in the area should have these aggregated.
- How much new apartment / multifamily construction is in the pipeline within 1–3 miles? Heavy new supply (>2% of stock underway) typically softens rents 12–24 months out; light construction supports rent growth.
Investment metrics
- 1% rule
- 0.84% ✗
- Cap rate
- 5.98%
- Cash-on-cash
- -1.13%
- DSCR
- 0.95
- GRM
- 9.9
CMA / ARV
No comps found within radius.
Projected returns pro-forma
-3.0% appreciation · 5.59% rent growth · sell at horizon
- IRR
- -16.3%
- Equity multiple
- 0.41×
- Total profit
- $-70,593
- Equity at exit
- $63,369
- IRR
- -3.9%
- Equity multiple
- 0.71×
- Total profit
- $-34,368
- Equity at exit
- $36,746
Cash invested: $119,000 (down + closing). Projections, not guarantees.
Landlord ↔ Tenant lean methodology
- Overall (STATE)
- 87 Strongly Landlord-Friendly
- State Florida
- 87 Strongly Landlord-Friendly · R+3
- County
- — inherits STATE
- City
- — inherits STATE
ZIP-level market 34113
- Rents YoY
- 5.6%
- Active inventory
- 597
- Price-to-rent
- 9.9×
Monthly cashflow live
- Estimated rent
- $3,576 high interval (Pro) →
- Mortgage (P&I)
- −$2,229
- Tax from tax record
- −$149 /mo · $1,782/yr
- Insurance
- −$177
- Flood insurance flood zone
- −$66 /mo · $798/yr
- HOA
- −$383
- Vacancy / Maint / Mgmt
- −$751
- Net cashflow
- $-179
Break-even live
UW: 25.0% down · 7.5% · 30yr · 1.5% tax · 5.0% vac · 8.0% maint · 8.0% mgmt
Financing live
Cash to close
- Down payment
- $106,250
- Closing costs
- $12,750
- Reserves months
- —
- Total cash needed
- —
Loan-product check · same deal, 3 products live
Conventional
25% down · 7.5% · 30yr
- Down + closing
- —
- Monthly P&I
- —
- Monthly cashflow
- —
- DSCR
- —
- Eligible?
- —
Personal DTI + credit; lowest rate.
DSCR
20% down · 8.5% · 30yr
- Down + closing
- —
- Monthly P&I
- —
- Monthly cashflow
- —
- DSCR
- —
- Eligible?
- —
No personal income docs; deal must DSCR.
Hard money
10% down · 12.0% · 12mo
- Down + closing
- —
- Monthly P&I
- —
- Monthly cashflow
- —
- DSCR
- —
- Eligible?
- —
Short-term bridge; refi at stabilization.
Rent comps 40 comps
| Address | Beds | Baths | Sqft | Rent | $/sqft | DOM | Units | Dist |
|---|---|---|---|---|---|---|---|---|
| 640 Augusta Blvd Naples, FL | 2.0 | 2.0 | 1634 | $2,700 | $1.65 | 23d | 1 | 0.08mi |
| 575 Augusta Blvd Naples, FL | 3.0 | 2.0 | 1500 | $2,100 | $1.40 | 23d | 1 | 0.08mi |
| 555 Augusta Blvd Unit 3-1 Naples, FL | 2.0 | 2.0 | 1249 | $4,200 | $3.36 | 23d | 1 | 0.08mi |
| 605 Augusta Blvd #14 Naples, FL | 2.0 | 2.0 | 1125 | $4,000 | $3.56 | 23d | 1 | 0.12mi |
| 605 Augusta Blvd #4 Naples, FL | 2.0 | 2.0 | 1125 | $3,950 | $3.51 | 13d | 1 | 0.12mi |
| 265 Deerwood Cir Naples, FL | 2.0 | 2.0 | 1179 | $5,000 | $4.24 | 23d | 1 | 0.13mi |
| 701 Augusta Blvd Unit 701-8 Naples, FL | 2.0 | 2.0 | 1250 | $4,800 | $3.84 | 13d | 1 | 0.15mi |
| 413 Augusta Blvd #302 Naples, FL | 2.0 | 2.0 | 1390 | $5,500 | $3.96 | 21d | 1 | 0.17mi |
| 705 Augusta Blvd Unit 705-5 Naples, FL | 2.0 | 2.0 | 1125 | $2,000 | $1.78 | 13d | 1 | 0.18mi |
| 520 Augusta Blvd Unit B204 Naples, FL | 3.0 | 2.0 | 1294 | $2,200 | $1.70 | 23d | 1 | 0.21mi |
| 709 Augusta Blvd Unit 709-5 Naples, FL | 3.0 | 2.0 | 1480 | $4,000 | $2.70 | 13d | 1 | 0.21mi |
| 760 Augusta Blvd Unit D204 Naples, FL | 3.0 | 2.0 | 1294 | $2,300 | $1.78 | 23d | 1 | 0.23mi |
| 182 Palmetto Dunes Cir Naples, FL | 3.0 | 2.0 | 2175 | $3,300 | $1.52 | 23d | 1 | 0.32mi |
| 905 Augusta Blvd Naples, FL | 2.0 | 2.0 | 1125 | $1,850 | $1.64 | 23d | 1 | 0.33mi |
| 127 Palmetto Dunes Cir Naples, FL | 3.0 | 2.0 | 1906 | $7,500 | $3.93 | 23d | 1 | 0.34mi |
| 940 Augusta Blvd Unit D939 Naples, FL | 2.0 | 2.0 | 1419 | $2,200 | $1.55 | 23d | 1 | 0.39mi |
| 494 Saint Andrews Blvd Naples, FL | 3.0 | 2.0 | 1700 | $2,800 | $1.65 | 23d | 1 | 0.39mi |
| 5857 Rattlesnake Hammock Rd #208 Naples, FL | 2.0 | 2.0 | 1133 | $3,000 | $2.65 | 13d | 1 | 0.44mi |
| 5841 Rattlesnake Hammock Rd Unit 2 Naples, FL | 2.0 | 2.0 | 1133 | $2,500 | $2.21 | 23d | 1 | 0.44mi |
| 5859 Westbourgh Ct Naples, FL | 3.0 | 2.0 | 1746 | $8,500 | $4.87 | 23d | 1 | 0.49mi |
| 5859 Westbourgh Ct Naples, FL | 3.0 | 2.0 | 1746 | $8,500 | $4.87 | 13d | 1 | 0.49mi |
| 5651 Rattlesnake Hammock Rd Unit C-108 Naples, FL | 2.0 | 2.0 | 1054 | $1,800 | $1.71 | 23d | 1 | 0.53mi |
| 5635 Rattlesnake Hammock Rd Apt 203D Naples, FL | 2.0 | 2.0 | 1054 | $1,700 | $1.61 | 21d | 1 | 0.56mi |
| 452 Bristle Cone Ln #27 Naples, FL | 2.0 | 2.0 | 1129 | $2,000 | $1.77 | 23d | 1 | 0.58mi |
| 315 Saint Andrews Blvd Unit A25 Naples, FL | 2.0 | 2.0 | 1126 | $1,530 | $1.36 | 23d | 1 | 0.58mi |
| 239 Torrey Pines Pt Naples, FL | 3.0 | 2.5 | 1907 | $12,090 | $6.34 | 23d | 1 | 0.59mi |
| 5535 Rattlesnake Hammock Rd #302 Naples, FL | 2.0 | 2.0 | 1205 | $2,800 | $2.32 | 23d | 1 | 0.64mi |
| 255 Pine Valley Cir Naples, FL | 3.0 | 1.5 | 1574 | $3,500 | $2.22 | 23d | 1 | 0.68mi |
| 326 Bradstrom Cir Unit 103F Naples, FL | 2.0 | 2.0 | 1113 | $1,800 | $1.62 | 23d | 1 | 0.68mi |
| 326 Bradstrom Cir Unit 204F Naples, FL | 3.0 | 2.0 | 1200 | $3,500 | $2.92 | 23d | 1 | 0.68mi |
| 167 Torrey Pines Pt Naples, FL | 3.0 | 2.0 | 1907 | $9,000 | $4.72 | 23d | 1 | 0.68mi |
| 5502 Greenwood Cir #1 Naples, FL | 3.0 | 2.0 | 1450 | $2,400 | $1.66 | 23d | 1 | 0.68mi |
| 213 Bay Meadows Dr Naples, FL | 3.0 | 2.0 | 1650 | $5,500 | $3.33 | 23d | 1 | 0.72mi |
| 4556 Andover Way Unit E104 Naples, FL | 2.0 | 2.0 | 1072 | $5,000 | $4.66 | 13d | 1 | 0.73mi |
| 4556 Andover Way Unit E106 Naples, FL | 2.0 | 2.0 | 1172 | $1,900 | $1.62 | 13d | 1 | 0.73mi |
| 332 Bradstrom Cir #201 Naples, FL | 2.0 | 2.0 | 1257 | $2,200 | $1.75 | 23d | 1 | 0.73mi |
| 5293 Dixie Dr Unit 1546039P Naples, FL | 2.0 | 2.0 | 1130 | $1,561 | $1.38 | 13d | 1 | 0.77mi |
| 5778 Greenwood Cir Naples, FL | 3.0 | 2.0 | 1450 | $4,000 | $2.76 | 23d | 1 | 0.79mi |
| 5499 Rattlesnake Hammock Rd Naples, FL | 2.0 | 2.0 | 1071 | $1,775 | $1.66 | 13d | 2 | 0.80mi |
| 6560 Roma Way Naples, FL | 3.0 | 2.0 | 2188 | $11,000 | $5.03 | 23d | 1 | 0.80mi |
HOA detail condo
- Monthly dues
- $383 · $4,596/yr
- Likely covers
- waterelectric
- Assessments
- None detected in remarks — confirm with the listing agent.
Listing history 17 events
-
2026-06-18days on market $425,000 Active 234 DOM
-
2026-06-17days on market $425,000 Active 233 DOM
-
2026-06-16days on market $425,000 Active 232 DOM
-
2026-06-15days on market $425,000 Active 231 DOM
-
2026-06-10days on market $425,000 Active 226 DOM
-
2026-06-09days on market $425,000 Active 225 DOM
-
2026-06-08days on market $425,000 Active 224 DOM
-
2026-06-07days on market $425,000 Active 223 DOM
-
2026-06-03days on market $425,000 Active 219 DOM
-
2026-06-02days on market $425,000 Active 218 DOM
-
2026-06-01days on market $425,000 Active 217 DOM
-
2026-05-31days on market $425,000 Active 216 DOM
-
2026-05-30days on market $425,000 Active 215 DOM
-
2025-10-27$425,000 Active 518-char remark
Show marketing remark (518 chars)
Rarely available and very lovely villa located in Lely Country Club Community. Two bedrooms + den/family room and 1 car garage. Enter through the attractive courtyard to an open floor plan with cathedral ceilings. A large lanai in the back, equipped with electric storm shutters, offers you a golf course view of the Royal Palm Country Club located nearby. Beautiful hardwood flooring in lall living areas, new refrigerator and microwave. AC and Hot water recently replaced. Close to downtown, restaurants and beaches.
-
2025-10-27$425,000 Active
Show marketing remark (518 chars)
Rarely available and very lovely villa located in Lely Country Club Community. Two bedrooms + den/family room and 1 car garage. Enter through the attractive courtyard to an open floor plan with cathedral ceilings. A large lanai in the back, equipped with electric storm shutters, offers you a golf course view of the Royal Palm Country Club located nearby. Beautiful hardwood flooring in lall living areas, new refrigerator and microwave. AC and Hot water recently replaced. Close to downtown, restaurants and beaches.
-
2016-07-05soldstatus $255,000
-
1994-03-18soldstatus $148,500
ⓘ Source: listings_history table (triggers on properties + properties_extension) + one-shot
backfill from property_details.listing_events for pre-trigger history.
Tax reassessment forecast FL · Resets to sale price
- Current annual tax
- $1,782 · $149/mo
- Projected year-2 tax
- $3,528 · $294/mo
- Expected delta
- +$1,745/yr (+$145/mo · 98.0%)
ⓘ Screening estimate from a state-policy table — verify with the county assessor before closing.
Climate risk First Street
- Flood 7/10 Severe FEMA zone X (shaded) · 75% chance over 30 yrs
- Wildfire 2/10 Low
- Heat 10/10 Extreme 7 d/yr ≥108°F today · 30 d/yr by 30 yrs out
- Wind 10/10 Extreme 99% chance of damaging wind over 30 yrs
- Air quality 2/10 Low 2 unhealthy d/yr today · 2 by 30 yrs out
Nearby sold comps map
Loading sold comps map…
Walkable amenities ~0.75 mi
Loading nearby amenities…
Taxation est. · year 1
- Rental income
- $42,913
- − Mortgage interest
- −$23,807
- − Property taxes
- −$1,782
- − Insurance
- −$2,922
- − Repairs & maintenance
- −$3,433
- − Management
- −$3,433
- − HOA
- −$4,596
- − Depreciation
- −$12,364
- Taxable loss
- −$9,424
- Est. tax savings @ 24.0%
- +$2,262
- After-tax cash flow
- $118/yr
For passive investors: Depreciation is non-cash, so a rental often shows a tax loss while cash-flowing — sheltering income. Rental losses are passive: they offset passive income freely, and up to $25,000/yr can offset ordinary (W-2) income if you actively participate and your MAGI is under $100k (phasing out to $0 by $150k); unused losses carry forward. On sale, claimed depreciation is recaptured at up to 25%, and gains may owe capital-gains tax (a 1031 exchange can defer both). Figures are a year-1 estimate at your 24.0% rate — not tax advice; consult a CPA.
Schools (NCES district)
- District
- Collier
- NCES district ID
- 1200330
- Math proficiency
- 60% ▼ -4.00%
- Reading proficiency
- 56% ▼ -2.00%
- Median HH income
- $58,275
- Composite
- 50.23/100
- National rank
- #1892
- State rank
- #16 of 73 in FL
Livability — Lely
- Score
- 66/100
- State rank
- #586
- US rank
- #11224
Category grades
Schools grade is shown separately in the Schools card above.
Census & demographics
- Census place
- Lely, FL
- County
- Collier County · 396,295 people
- Metro
- Naples-Marco Island, FL
- Population (ZIP)
- 26,056
- Household income
- $81,674
- Rent vs Own
- Severe rent burden
- 954.0
Population outlook (Collier County) Hauer SSP2
- Today (2025)
- 420,858 people
- By 2030
- 450,054 · +6.9%
- By 2040
- 502,232 · +19.3%
- By 2050
- 544,932 · +29.5%
- By 2075
- 627,203 · +49.0%
- By 2100
- 659,015 · +56.6%
Race, ethnicity, and origin ACS 2023
- Neighborhood character
- Diverse neighborhood (Simpson 0.59)
- Race & ethnicity
- White 56% Hispanic / Latino 28% Black 12% Two or more races 11% Asian 2%
- Hispanic origin (detail)
- Mexican 17% Puerto Rican 3% Cuban 2%
- Common ancestry
- Hispanic 10% Romanian 3% Lithuanian 2%
- Foreign-born
- 26% · Canada, Jamaica, Vietnam
- Languages at home
- 63% English-only · Spanish 24% French/Haitian/Cajun 9% Other Indo-European 2%
Political lean MEDSL · Collier
- 2024 margin
- Solid R (+33.1) · D 33.1% · R 66.2%
- 2008→2024 swing
- -10.6pp toward R · 2008: -22.5pp · 2024: -33.1pp
- All cycles
- 2024: R+33.1 2020: R+24.7 2016: R+26.0 2012: R+30.1 2008: R+22.5
Not yet ingested
- Civics
- —
Market trends
- HPI YoY
- ▼ -194.86%
- Current HPI
- 279.4232
- Rent YoY
- ▲ 5.59%
- Metro
- Naples-Marco Island, FL
- State GDP YoY
- ▲ 3.28%
- F500 in state
- 36
Industry mix (Fortune 500 HQ in FL)
| Industry | F500 HQs | Revenue |
|---|---|---|
| Industrial Technology | 2 | $29B |
|
||
| Insurance | 2 | $17B |
|
||
| Retail | 1 | $60B |
|
||
| Technology Distribution | 1 | $58B |
|
||
| Homebuilding | 1 | $35B |
|
||
| Technology Manufacturing | 1 | $35B |
|
||
Price history
+186.2% since first listed4 events — show timeline
- 2025-10-27 Listed $425,000 NAPLESMLS
- 2025-10-27 Listed $425,000 MIML
- 2016-07-05 Sold (Public Records) $255,000 Public Records
- 1994-03-18 Sold (Public Records) $148,500 Public Records
Property tax history
-0.7%/yrLatest (2025): $1,782 · +6.7% YoY. Source: county tax records.
Cash-flow waterfall
monthlySold comps — $/sqft
last 12 mo · ≤1 miLoading sold comps…