 Multi-family
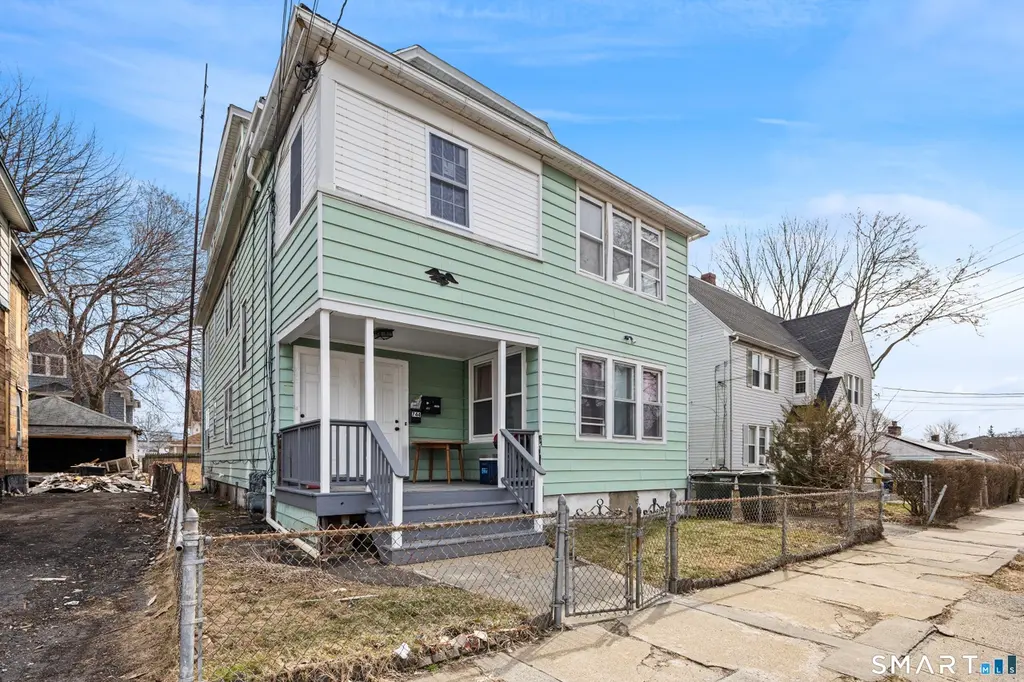
744 Park St · Bridgeport, CT
Flood risk 1/10 · Minimal
- FEMA flood zone
- X (unshaded)
- Chance of flooding over 30 yrs
- 0.0%
- Est. flood insurance / yr
- $473 – $860
Fire risk 1/10 · Minimal
- Est. fire insurance / yr
- $829 – $1,539
Heat risk 7/10 · Major
- Hot days now (above 97°F)
- 7 days/yr
- Hot days in 30 yrs
- 16 days/yr
Wind risk 6/10 · Moderate
- Chance of severe wind over 30 yrs
- 41.0%
Air-quality risk 4/10 · Minor
- Unhealthy air days now
- 5 days/yr
- Unhealthy air days in 30 yrs
- 7 days/yr
Risk factors via First Street. Map © Google.
Why this score? — see what drove the C grade
The composite is a weighted blend of 9 inputs, each scored 0–100. Each bar is that input's sub-score; the figure is the points it added to the 100-point composite (weight × sub-score).
- Cash flow +19.6/30.0
- Appreciation +10.0/10.0
- ARV discount +6.7/15.0
- DSCR +6.2/10.0
- 1% rule +4.9/10.0
- Livability +4.0/5.0
- Rent growth +3.6/5.0
- Condition / age +2.5/5.0
- Schools +1.2/10.0
$699,999
🖨 Deal sheet 📄 Offer letter ✓ Due diligence
Multi-family units
County records classify this as Multi-Family (2-4 Unit). Listing-text estimate: 1 unit. estimate disagrees with records
Listing remarks MLS
744-746 Park Street offers a spacious 3-family home with great potential for owner-occupants or investors alike. The first and second floor units each feature 2 bedrooms, 1 bath, a living room, and a dining room, providing comfortable layouts with room to personalize. The third floor presents a blank canvas ready for your vision and a complete renovation. Additional highlights include a washer/dryer in the basement and a convenient location close to shopping, transportation, and amenities. With some TLC, this property can be transformed into a strong income producer or multi-generational living space.
Key facts
- New plumbing
- Modern finishes
- New kitchen cabinets
Tags
Neighborhood map
What this means for you Summary
Snapshot
- This is a 6-bed/3.0-bath multifamily listed at $700k.
Deal economics
- At list price, monthly cash flow is $809 ($10k/yr) — positive.
- The deal already cash-flows at list — no discount required.
- To meet the 1% rule (rent ≥ 1% of price), the offer needs to be $693k (1.0% below list).
- Recommended offer: $689k (1.5% below list) — sets the bar for market timing.
- Cap rate 7.7% vs local median 5.0% in Bridgeport — top-decile yield for the area; either an underpriced asset or a hidden risk that comps aren't pricing in. Stress-test before assuming the spread holds.
Location & tenants
- Location reads 81/100 on livability (#15 in CT, #1,374 nationally) — a professional / high-income tenant draw. Strengths: amenities A+, commute A+, health & safety A+; Watch: crime C-, employment D+, schools D-.
- Bridgeport School District (urban): math 9% / reading 19% proficiency, ranked #151 of 153 in CT (top 99%) — low school quality limits family demand, transient renter base, plan for 1-2y turnover; 97% free/reduced lunch — lower-income household profile, screen leases tightly.
- Market conditions: Rents rising fast (+4.3%/yr); 30 active listings in the ZIP; 3 comparable units currently listed for rent nearby; rentals at typical pace (median 15d on market — plan ~3-4 weeks tenant-placement turnaround); 852 units permitted in Greater Bridgeport Planning Region in 2024 (698 in 5+ unit buildings).
- At $6,927/mo this rent would consume 182% of the median local household income ($46k/yr) (locally 910% of renters already pay >50% of income on rent) — very limited rent-growth headroom before tenants either downsize or default.
Forward outlook
- In year one you build about $75k of equity ($5k loan paydown + $70k appreciation (10.0% local appreciation)).
- At projected returns (10.0% appreciation + 4.3% rent growth), your $196k cash investment doubles in ~3 years — after that, you're playing with house money.
- By year 2, paydown + projected appreciation supports a ~$120k cash-out refi (75% LTV) — recoverable capital for the next deal without selling this one.
Negotiation context
- It's been on market 15 days — a 2% lower offer ($689k) is reasonable based on typical stale-listing flexibility.
- 2 sale attempts with the ask held roughly flat each time — persistent listings suggest the price (not the market) is what's stuck; bring a comps-based counter.
Risks & watch-outs
- Watch-outs: built in 1932 — expect roof / HVAC / electrical / plumbing capex.
- Climate carrying-cost: major wind risk, 41% chance of damaging wind over 30y; extreme-heat days projected 7→16/yr by 2055 (HVAC capex compounding) — expect insurance premiums to compound above CPI over the hold.
Questions for the listing agent
- Built in 1932 — when were the roof, HVAC, electrical panel, plumbing, and water heater last replaced?
- Is there a deadline driving the sale (1031 exchange, divorce, estate, relocation)? That informs how much negotiation room exists.
- Schools are D-rated, which usually means shorter tenancies and higher turnover. Who's the typical renter profile here, and what's been the actual vacancy rate?
- What's the average days-on-market for RENTAL listings here right now (not sales)? A rising rental-DOM trend means longer vacancies and softer asking-rent achievability than the comps imply.
- What's the recent tenant-quality profile in this submarket — average credit score on applications, eviction rate, late-payment / NSF rate, and stable-employment percentage? A property-management company in the area should have these aggregated.
- How much new apartment / multifamily construction is in the pipeline within 1–3 miles? Heavy new supply (>2% of stock underway) typically softens rents 12–24 months out; light construction supports rent growth.
Investment metrics
- 1% rule
- 0.99% ✗
- Cap rate
- 7.68%
- Cash-on-cash
- 4.95%
- DSCR
- 1.22
- GRM
- 8.4
CMA / ARV
- ARV (on-the-fly)
- $688,434
- Comps found
- 11
Show comp detail 11 sales within ~0.75 mi
| Address | Dist | Beds/Ba | Sqft | Sold | Price | $/sf | Match |
|---|---|---|---|---|---|---|---|
| 690 William St | 0.29mi | 6/3.0 | 3,493 (-9%) | 3mo | $625,000 | $179 | 69 |
| 554 Huntington Rd | 0.21mi | 6/3.5 | 3,503 (-9%) | 9mo | $680,000 | $194 | 66 |
| 750 William St | 0.24mi | 7/5.0 (+1) | 4,075 (+6%) | 2mo | $670,000 | $164 | 64 |
| 1992-1996 E Main St | 0.34mi | 6/3.0 | 3,575 (-7%) | 11mo | $630,000 | $176 | 63 |
| 1568 E Main St | 0.15mi | 6/3.0 | 3,307 (-14%) | 8mo | $635,000 | $192 | 63 |
| 170 Livingston Pl | 0.71mi | 6/3.0 | 3,687 (-4%) | 7mo | $625,500 | $170 | 54 |
| 154 Rose St | 0.35mi | 6/3.0 | 3,280 (-15%) | 7mo | $570,000 | $174 | 53 |
| 528 William St | 0.45mi | 6/3.0 | 3,328 (-14%) | 13mo | $600,000 | $180 | 46 |
| 149 Edna Ave | 0.68mi | 5/3.0 (-1) | 3,515 (-9%) | 6mo | $630,000 | $179 | 44 |
| 642 William St | 0.34mi | 6/3.0 | 3,277 (-15%) | 18mo | $450,000 | $137 | 44 |
| 289 Harriet St | 0.66mi | 7/4.0 (+1) | 3,400 (-12%) | 6mo | $725,000 | $213 | 36 |
Match score weights: distance 35% · size 25% · config 20% · recency 20%. Top-matched comps best support the ARV.
Projected returns pro-forma
10.0% appreciation · 4.35% rent growth · sell at horizon
- IRR
- 28.4%
- Equity multiple
- 3.26×
- Total profit
- $442,288
- Equity at exit
- $630,615
- IRR
- 25.1%
- Equity multiple
- 7.54×
- Total profit
- $1,282,392
- Equity at exit
- $1,359,944
Cash invested: $196,000 (down + closing). Projections, not guarantees.
Landlord ↔ Tenant lean methodology
- Overall (STATE)
- 27 Tenant-Leaning
- State Connecticut
- 27 Tenant-Leaning · D+7
- County
- — inherits STATE
- City
- — inherits STATE
ZIP-level market 06608
- Home prices YoY
- 3.6%
- Rents YoY
- 4.3%
- Active inventory
- 30
- Price-to-rent
- 25.3×
Monthly cashflow live
- Estimated rent
- $6,927 high interval (Pro) →
- Mortgage (P&I)
- −$3,671
- Tax from tax record
- −$701 /mo · $8,411/yr
- Insurance
- −$292
- HOA
- −$0
- Vacancy / Maint / Mgmt
- −$1,455
- Net cashflow
- $809
Break-even live
3-unit breakdown (identical units grouped — click to expand)
| Units | Beds | Baths | Est. rent |
|---|---|---|---|
| 3× units | 3 | 1 | $6,927 |
| #1 | 3 | 1 | $2,309 |
| #2 | 3 | 1 | $2,309 |
| #3 | 3 | 1 | $2,309 |
| Total (3 units) | $6,927 | ||
UW: 25.0% down · 7.5% · 30yr · 1.5% tax · 5.0% vac · 8.0% maint · 8.0% mgmt
Financing live
Cash to close
- Down payment
- $175,000
- Closing costs
- $21,000
- Reserves months
- —
- Total cash needed
- —
Loan-product check · same deal, 3 products live
Conventional
25% down · 7.5% · 30yr
- Down + closing
- —
- Monthly P&I
- —
- Monthly cashflow
- —
- DSCR
- —
- Eligible?
- —
Personal DTI + credit; lowest rate.
DSCR
20% down · 8.5% · 30yr
- Down + closing
- —
- Monthly P&I
- —
- Monthly cashflow
- —
- DSCR
- —
- Eligible?
- —
No personal income docs; deal must DSCR.
Hard money
10% down · 12.0% · 12mo
- Down + closing
- —
- Monthly P&I
- —
- Monthly cashflow
- —
- DSCR
- —
- Eligible?
- —
Short-term bridge; refi at stabilization.
Rent comps 3 comps
| Address | Beds | Baths | Sqft | Rent | $/sqft | DOM | Units | Dist |
|---|---|---|---|---|---|---|---|---|
| 107 Catherine St Bridgeport, CT | 7.0 | 2.5 | 4104 | $2,900 | $0.71 | 14d | 1 | 1.10mi |
| 41 Perth St Bridgeport, CT | 6.0 | 2.0 | 2640 | $2,200 | $0.83 | 14d | 1 | 1.46mi |
| 1566 North Ave Bridgeport, CT | 5.0 | 1.0 | 2837 | $2,500 | $0.88 | 43d | 1 | 1.47mi |
Listing history 7 events
-
2026-05-21soldstatus $725,000 Closed
-
2026-04-01status Under Contract
-
2026-03-16$699,999 Active
-
2025-11-14soldstatus $482,000 Closed 608-char remark
Show marketing remark (608 chars)
744-746 Park Street offers a spacious 3-family home with great potential for owner-occupants or investors alike. The first and second floor units each feature 2 bedrooms, 1 bath, a living room, and a dining room, providing comfortable layouts with room to personalize. The third floor presents a blank canvas ready for your vision and a complete renovation. Additional highlights include a washer/dryer in the basement and a convenient location close to shopping, transportation, and amenities. With some TLC, this property can be transformed into a strong income producer or multi-generational living space.
-
2025-08-26status Under Contract 608-char remark
Show marketing remark (608 chars)
744-746 Park Street offers a spacious 3-family home with great potential for owner-occupants or investors alike. The first and second floor units each feature 2 bedrooms, 1 bath, a living room, and a dining room, providing comfortable layouts with room to personalize. The third floor presents a blank canvas ready for your vision and a complete renovation. Additional highlights include a washer/dryer in the basement and a convenient location close to shopping, transportation, and amenities. With some TLC, this property can be transformed into a strong income producer or multi-generational living space.
-
2025-08-15historical Under Contract - Continue to Show 608-char remark
Show marketing remark (608 chars)
744-746 Park Street offers a spacious 3-family home with great potential for owner-occupants or investors alike. The first and second floor units each feature 2 bedrooms, 1 bath, a living room, and a dining room, providing comfortable layouts with room to personalize. The third floor presents a blank canvas ready for your vision and a complete renovation. Additional highlights include a washer/dryer in the basement and a convenient location close to shopping, transportation, and amenities. With some TLC, this property can be transformed into a strong income producer or multi-generational living space.
-
2025-08-08$399,900 Active 608-char remark
Show marketing remark (608 chars)
744-746 Park Street offers a spacious 3-family home with great potential for owner-occupants or investors alike. The first and second floor units each feature 2 bedrooms, 1 bath, a living room, and a dining room, providing comfortable layouts with room to personalize. The third floor presents a blank canvas ready for your vision and a complete renovation. Additional highlights include a washer/dryer in the basement and a convenient location close to shopping, transportation, and amenities. With some TLC, this property can be transformed into a strong income producer or multi-generational living space.
ⓘ Source: listings_history table (triggers on properties + properties_extension) + one-shot
backfill from property_details.listing_events for pre-trigger history.
Tax reassessment forecast CT · Partial reset (capped growth)
- Current annual tax
- $8,411 · $701/mo
- Projected year-2 tax
- $11,695 · $975/mo
- Expected delta
- +$3,284/yr (+$274/mo · 39.0%)
ⓘ Screening estimate from a state-policy table — verify with the county assessor before closing.
Climate risk First Street
- Flood 1/10 Low FEMA zone X (unshaded) · 0% chance over 30 yrs
- Wildfire 1/10 Low
- Heat 7/10 Severe 7 d/yr ≥97°F today · 16 d/yr by 30 yrs out
- Wind 6/10 Major 41% chance of damaging wind over 30 yrs
- Air quality 4/10 Moderate 5 unhealthy d/yr today · 7 by 30 yrs out
Nearby sold comps map
Loading sold comps map…
Walkable amenities ~0.75 mi
Loading nearby amenities…
Taxation est. · year 1
- Rental income
- $83,124
- − Mortgage interest
- −$39,211
- − Property taxes
- −$8,411
- − Insurance
- −$3,500
- − Repairs & maintenance
- −$6,650
- − Management
- −$6,650
- − Depreciation
- −$20,364
- Taxable loss
- −$1,661
- Est. tax savings @ 24.0%
- +$399
- After-tax cash flow
- $10,105/yr
For passive investors: Depreciation is non-cash, so a rental often shows a tax loss while cash-flowing — sheltering income. Rental losses are passive: they offset passive income freely, and up to $25,000/yr can offset ordinary (W-2) income if you actively participate and your MAGI is under $100k (phasing out to $0 by $150k); unused losses carry forward. On sale, claimed depreciation is recaptured at up to 25%, and gains may owe capital-gains tax (a 1031 exchange can defer both). Figures are a year-1 estimate at your 24.0% rate — not tax advice; consult a CPA.
Schools (NCES district)
- District
- Bridgeport School District
- NCES district ID
- 0900450
- Math proficiency
- 9% ▼ -7.00%
- Reading proficiency
- 19% ▼ -10.00%
- Median HH income
- $41,507
- Composite
- 12.09/100
- National rank
- #9656
- State rank
- #151 of 153 in CT
Livability — Bridgeport
- Score
- 81/100
- State rank
- #15
- US rank
- #1374
Category grades
Schools grade is shown separately in the Schools card above.
Census & demographics
- Census place
- Bridgeport, CT
- County
- Fairfield County · 765,532 people
- City population
- 149,153
- Metro
- Bridgeport-Stamford-Norwalk, CT
- Population (ZIP)
- 12,146
- Household income
- $45,754
- Rent vs Own
- Severe rent burden
- 910.0
Population outlook (Greater Bridgeport County) Hauer SSP2
- By 2040
- 365,581
Race, ethnicity, and origin ACS 2023
- Neighborhood character
- Predominantly Hispanic (69%)
- Race & ethnicity
- Hispanic / Latino 69% Black 22% Two or more races 19% White 4% Asian 4%
- Hispanic origin (detail)
- Mexican 5% Puerto Rican 32% Cuban 1% Dominican 14%
- Common ancestry
- Hispanic 1% Russian 1% Estonian 0%
- Foreign-born
- 34% · Canada, Jamaica
- Languages at home
- 33% English-only · Spanish 56% French/Haitian/Cajun 4% Other Asian/Pacific 3%
Political lean MEDSL · Greater Bridgeport
- 2024 margin
- Strong D (+23.3) · D 60.9% · R 37.6% · Other 1.5%
- All cycles
- 2024: D+23.3
Not yet ingested
- Civics
- —
Market trends
- HPI YoY
- ▲ 18.29%
- Current HPI
- 530.5125
- Rent YoY
- ▲ 4.35%
- Metro
- Bridgeport-Stamford-Norwalk, CT
- State GDP YoY
- ▲ 1.06%
- F500 in state
- 38
Industry mix (Fortune 500 HQ in CT)
| Industry | F500 HQs | Revenue |
|---|---|---|
| Industrial Machinery | 4 | $38B |
|
||
| Insurance | 3 | $71B |
|
||
| Financial Services | 2 | $25B |
|
||
| Transportation / Logistics | 2 | $18B |
|
||
| Healthcare | 1 | $247B |
|
||
| Telecommunications | 1 | $55B |
|
||
Price history
+81.3% since first listed7 events — show timeline
- 2026-05-21 Sold (MLS) $725,000 Smart MLS
- 2026-04-01 Pending — Smart MLS
- 2026-03-16 Listed $699,999 Smart MLS
- 2025-11-14 Sold (MLS) $482,000 Smart MLS
- 2025-08-26 Pending — Smart MLS
- 2025-08-15 Contingent — Smart MLS
- 2025-08-08 Listed $399,900 Smart MLS
Property tax history
-2.0%/yrLatest (2023): $8,411 · -1.7% YoY. Source: county tax records.
Cash-flow waterfall
monthlySold comps — $/sqft
last 12 mo · ≤1 miLoading sold comps…