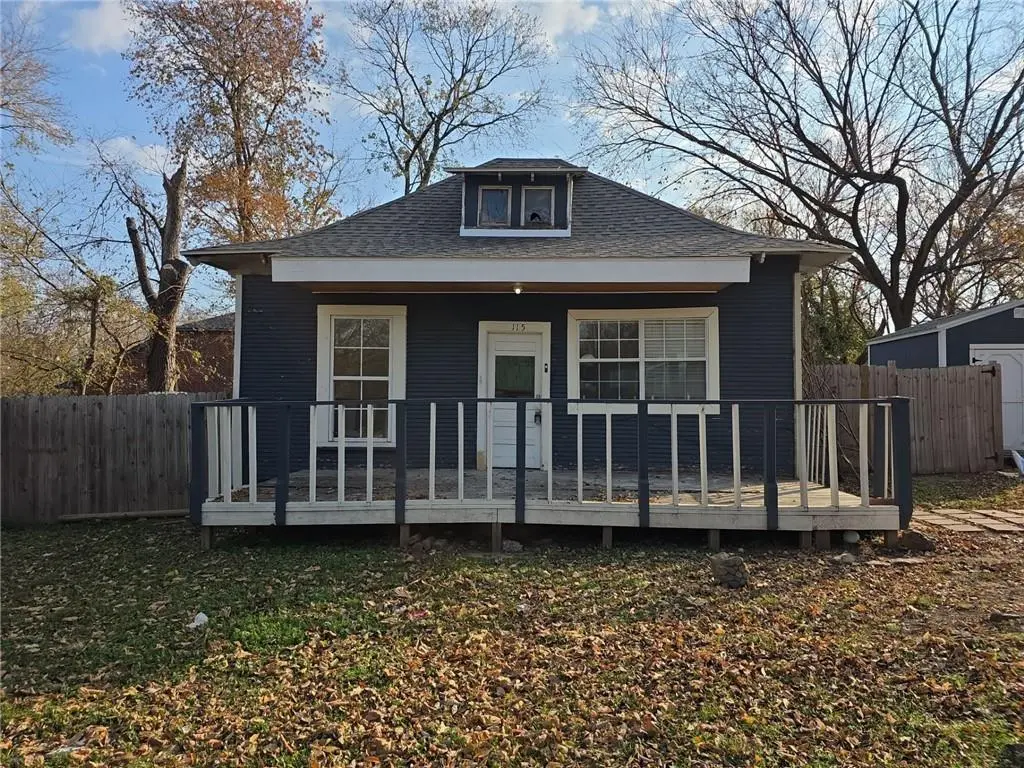
115 N Britt St · Siloam Springs, AR
Flood risk 1/10 · Minimal
- FEMA flood zone
- X (unshaded)
- Chance of flooding over 30 yrs
- 0.0%
- Est. flood insurance / yr
- $507 – $1,088
Fire risk 6/10 · Moderate
- Est. fire insurance / yr
- $1,499 – $2,785
Heat risk 5/10 · Moderate
- Hot days now (above 106°F)
- 7 days/yr
- Hot days in 30 yrs
- 20 days/yr
Wind risk 2/10 · Minimal
- Chance of severe wind over 30 yrs
- 2.0%
Air-quality risk 2/10 · Minimal
- Unhealthy air days now
- 1 days/yr
- Unhealthy air days in 30 yrs
- 2 days/yr
Risk factors via First Street. Map © Google.
Why this score? — see what drove the B- grade
The composite is a weighted blend of 9 inputs, each scored 0–100. Each bar is that input's sub-score; the figure is the points it added to the 100-point composite (weight × sub-score).
- Cash flow +25.8/30.0
- ARV discount +15.0/15.0
- DSCR +8.6/10.0
- 1% rule +6.1/10.0
- Livability +3.7/5.0
- Schools +3.6/10.0
- Rent growth +2.5/5.0
- Condition / age +2.5/5.0
- Appreciation +0.0/10.0
$115,000
🖨 Deal sheet 📄 Offer letter ✓ Due diligence
Listing remarks
Calling investors, flippers & project seekers! This house is what you are looking for. .. .your next project! Quiet neighborhood in town featuring NEW roof. Large kitchen, front porch, shaded backyard---lots to love. Potential is ENDLESS with YOUR imagination. Great as a starter home or investment rental or flip.
Key facts
- Shaded backyard
- Front porch
- Large kitchen
Tags
Property features AI
Finance
- Other: Annual tax information available (amount excluded)
- HOA & community: Monthly association fee (amount not provided); Community features: near fire station, near schools, park
Exterior
- Utilities: Electricity available; Public water; Sewer available
- Home design: Single-story; Age unknown
- Construction: Vinyl siding; Architectural shingle roof; Block foundation with crawlspace; Crawl space
- Exterior features: Gravel driveway; Porch; Back yard fencing; Property near park and wooded area; Located in/near central business district and industrial park; Public paved road frontage
Interior
- Kitchen: Electric oven; Electric range
- Flooring: Vinyl flooring; Wood flooring
- Bathrooms: 1 full bathroom
- Heating & cooling: Floor furnace heating; Ductless cooling
- Interior features: Metal and single-pane windows; No additional interior features listed
- Laundry & utility: Electric water heater
Neighborhood map
What this means for you Summary
Snapshot
- This is a 2-bed/1.0-bath single-family listed at $115k.
Deal economics
- At list price, monthly cash flow is $278 ($3k/yr) — positive.
- The deal already cash-flows at list — no discount required.
- Meets the 1% rule at list price ($1k rent vs $115k).
- Recommended offer: $113k (1.5% below list) — sets the bar for market timing.
- Cap rate 9.2% vs local median 3.9% in Siloam Springs — top-decile yield for the area; either an underpriced asset or a hidden risk that comps aren't pricing in. Stress-test before assuming the spread holds.
Location & tenants
- Location reads 74/100 on livability (#17 in AR, #4,621 nationally) — a middle-class / working-renter tenant base. Strengths: cost of living A+, housing A+, health & safety A+; Watch: schools D, crime D, amenities F.
- Siloam Springs School District (town): math 44% / reading 40% proficiency, ranked #53 of 238 in AR (top 22%) — families likely to look elsewhere, expect single-tenant / working-renter base with shorter leases.
- Market conditions: 362 active listings in the ZIP; 19 comparable units currently listed for rent nearby; rentals at typical pace (median 21d on market — plan ~3-4 weeks tenant-placement turnaround); solid renter incomes; 4,359 units permitted in Benton County in 2024 (402 in 5+ unit buildings).
Forward outlook
- Local home prices are declining (-3.0%/yr); year-one equity from $795 of loan paydown is wiped out by about $3k of value loss. Plan a longer hold.
- Benton County population projected at +56% by 2050 — long-run rental-demand tailwind backs the buy-and-hold thesis.
Negotiation context
- It's been on market 30 days — a 2% lower offer ($113k) is reasonable based on typical stale-listing flexibility.
- Current owner paid $92k; 25% above their basis — modest negotiation headroom, anchor on the comps not their cost.
Risks & watch-outs
- Climate carrying-cost: major wildfire risk; extreme-heat days projected 7→20/yr by 2055 (HVAC capex compounding) — expect insurance premiums to compound above CPI over the hold.
Questions for the listing agent
- Is there a deadline driving the sale (1031 exchange, divorce, estate, relocation)? That informs how much negotiation room exists.
- Schools are D-rated, which usually means shorter tenancies and higher turnover. Who's the typical renter profile here, and what's been the actual vacancy rate?
- Crime grade is D in this area — have there been break-ins, vandalism, or insurance claims at this property in the last 3 years? What carrier currently insures it and at what premium?
- What's the average days-on-market for RENTAL listings here right now (not sales)? A rising rental-DOM trend means longer vacancies and softer asking-rent achievability than the comps imply.
- What's the recent tenant-quality profile in this submarket — average credit score on applications, eviction rate, late-payment / NSF rate, and stable-employment percentage? A property-management company in the area should have these aggregated.
- How much new for-sale + rental construction is in the pipeline within 1–3 miles? Heavy new supply typically softens prices + rents 12–24 months out; constrained supply supports both.
Investment metrics
- 1% rule
- 1.11% ✓
- Cap rate
- 9.20%
- Cash-on-cash
- 10.37%
- DSCR
- 1.46
- GRM
- 7.5
CMA / ARV
- ARV (on-the-fly)
- $204,516
- Comps found
- 12
Show comp detail 12 sales within ~0.75 mi
| Address | Dist | Beds/Ba | Sqft | Sold | Price | $/sf | Match |
|---|---|---|---|---|---|---|---|
| 706 E Franklin St | 0.34mi | 2/1.0 | 1,160 (-3%) | 3mo | $259,000 | $223 | 76 |
| 105 Cameron St | 0.10mi | 3/2.0 (+1) | 1,130 (-6%) | 5mo | $150,000 | $133 | 73 |
| 519 Madison St | 0.41mi | 2/1.0 | 1,204 (+1%) | 9mo | $189,900 | $158 | 72 |
| 411 N Maple St | 0.57mi | 3/1.0 (+1) | 1,144 (-4%) | 4mo | $167,000 | $146 | 58 |
| 708 Helena St | 0.43mi | 2/1.5 | 1,278 (+7%) | 12mo | $255,000 | $200 | 57 |
| 111 E Helena | 0.58mi | 2/1.0 | 1,100 (-8%) | 6mo | $187,000 | $170 | 55 |
| 1571 Wildwood Ln | 0.74mi | 2/2.0 | 1,195 (-0%) | 9mo | $204,000 | $171 | 54 |
| 430 S Washington St | 0.31mi | 3/2.0 (+1) | 1,360 (+14%) | 6mo | $224,000 | $165 | 49 |
| 111 W Tahlequah St | 0.45mi | 3/2.0 (+1) | 1,349 (+13%) | 9mo | $255,000 | $189 | 41 |
| 503 W Tahlequah St | 0.66mi | 2/1.0 | 1,048 (-12%) | 12mo | $163,000 | $156 | 39 |
| 113 W Tahlequah St | 0.46mi | 3/2.5 (+1) | 1,368 (+14%) | 9mo | $246,000 | $180 | 36 |
| 823 S Wright St | 0.74mi | 2/1.0 | 1,023 (-14%) | 8mo | $189,000 | $185 | 35 |
Match score weights: distance 35% · size 25% · config 20% · recency 20%. Top-matched comps best support the ARV.
Projected returns pro-forma
-3.0% appreciation · 3.0% rent growth · sell at horizon
- IRR
- -0.8%
- Equity multiple
- 0.97×
- Total profit
- $-934
- Equity at exit
- $17,147
- IRR
- 8.9%
- Equity multiple
- 1.68×
- Total profit
- $21,926
- Equity at exit
- $9,943
Cash invested: $32,200 (down + closing). Projections, not guarantees.
Landlord ↔ Tenant lean methodology
- Overall (STATE)
- 92 Strongly Landlord-Friendly
- State Arkansas
- 92 Strongly Landlord-Friendly · R+14
- County
- — inherits STATE
- City
- — inherits STATE
ZIP-level market 72761
- Home prices YoY
- -13.6%
- Active inventory
- 362
- Price-to-rent
- 7.5×
Monthly cashflow live
- Estimated rent
- $1,279 high interval (Pro) →
- Mortgage (P&I)
- −$603
- Tax from tax record
- −$81 /mo · $972/yr
- Insurance
- −$48
- HOA
- −$0
- Vacancy / Maint / Mgmt
- −$269
- Net cashflow
- $278
Break-even live
UW: 25.0% down · 7.5% · 30yr · 1.5% tax · 5.0% vac · 8.0% maint · 8.0% mgmt
Financing live
Cash to close
- Down payment
- $28,750
- Closing costs
- $3,450
- Reserves months
- —
- Total cash needed
- —
Loan-product check · same deal, 3 products live
Conventional
25% down · 7.5% · 30yr
- Down + closing
- —
- Monthly P&I
- —
- Monthly cashflow
- —
- DSCR
- —
- Eligible?
- —
Personal DTI + credit; lowest rate.
DSCR
20% down · 8.5% · 30yr
- Down + closing
- —
- Monthly P&I
- —
- Monthly cashflow
- —
- DSCR
- —
- Eligible?
- —
No personal income docs; deal must DSCR.
Hard money
10% down · 12.0% · 12mo
- Down + closing
- —
- Monthly P&I
- —
- Monthly cashflow
- —
- DSCR
- —
- Eligible?
- —
Short-term bridge; refi at stabilization.
Rent comps 19 comps
| Address | Beds | Baths | Sqft | Rent | $/sqft | DOM | Units | Dist |
|---|---|---|---|---|---|---|---|---|
| 250 N Madison St Unit c Siloam Springs, AR | 2.0 | 1.5 | 960 | $1,095 | $1.14 | 23d | 1 | 0.29mi |
| 400 E Twin Springs St Unit 1 Siloam Springs, AR | 2.0 | 1.0 | 1000 | $1,400 | $1.40 | 23d | 1 | 0.33mi |
| 111 W Tahlequah St Unit 1520930P Siloam Springs, AR | 3.0 | 2.0 | 1345 | $3,827 | $2.85 | 14d | 1 | 0.46mi |
| 207 E Franklin St Unit 1520952P Siloam Springs, AR | 2.0 | 2.0 | 1119 | $2,901 | $2.59 | 14d | 1 | 0.49mi |
| 1050 N Britt St Siloam Springs, AR | 1.0–2.0 | 1.0–2.0 | 881 | $1,100 | $1.25 | 14d | 5 | 0.51mi |
| 1707 Montclair Ave Siloam Springs, AR | 3.0 | 2.0 | 1101 | $1,399 | $1.27 | 14d | 2 | 0.58mi |
| 1112 Whipporwill Ln Unit B Siloam Springs, AR | 2.0 | 2.0 | 1127 | $1,100 | $0.98 | 23d | 1 | 0.62mi |
| 851 S Jersey Siloam Springs, AR | 3.0 | 2.0 | 1460 | $1,400 | $0.96 | 23d | 1 | 0.70mi |
| 460 N Garrett St Unit D Siloam Springs, AR | 2.0 | 1.0 | 1020 | $1,000 | $0.98 | 23d | 1 | 0.73mi |
| 605 W Benton St Unit C Siloam Springs, AR | 2.0 | 1.5 | 1120 | $1,050 | $0.94 | 14d | 1 | 0.74mi |
| 2060 Ravenwood Blvd Unit B Siloam Springs, AR | 2.0 | 2.0 | 1452 | $1,250 | $0.86 | 14d | 1 | 0.82mi |
| 255 Ravenwood Rd Siloam Springs, AR | 3.0 | 2.0 | 1421 | $1,395 | $0.98 | 23d | 1 | 0.86mi |
| 703 W Garland St Unit A Siloam Springs, AR | 2.0 | 1.5 | 1220 | $1,200 | $0.98 | 14d | 1 | 0.87mi |
| 1107 E Ken Leach Siloam Springs, AR | 3.0 | 2.0 | 1398 | $1,500 | $1.07 | 21d | 1 | 1.01mi |
| 1908 Azlin Pl Siloam Springs, AR | 3.0 | 1.5 | 1200 | $1,350 | $1.12 | 14d | 1 | 1.19mi |
| 2004 Azlin Pl Siloam Springs, AR | 2.0 | 1.5 | 1100 | $1,250 | $1.14 | 23d | 1 | 1.20mi |
| 2006 Azlin Pl Unit B Siloam Springs, AR | 2.0 | 1.5 | 1200 | $1,200 | $1.00 | 23d | 1 | 1.23mi |
| 2910 Dawn Ct Unit C Siloam Springs, AR | 3.0 | 2.0 | 1449 | $1,300 | $0.90 | 23d | 1 | 1.31mi |
| 2608 S Silver St Siloam Springs, AR | 3.0 | 2.0 | 1200 | $1,800 | $1.50 | 14d | 1 | 1.43mi |
Listing history 16 events
-
2026-06-18days on market $115,000 Active 30 DOM
-
2026-06-17days on market $115,000 Active 29 DOM
-
2026-06-16days on market $115,000 Active 28 DOM
-
2026-06-15days on market $115,000 Active 27 DOM
-
2026-06-14days on market $115,000 Active 25 DOM
-
2026-06-10days on market $115,000 Active 22 DOM
-
2026-06-09days on market $115,000 Active 21 DOM
-
2026-06-08days on market $115,000 Active 20 DOM
-
2026-06-07days on market $115,000 Active 19 DOM
-
2026-06-03days on market $115,000 Active 15 DOM
-
2026-06-02days on market $115,000 Active 14 DOM
-
2026-06-01days on market $115,000 Active 13 DOM
-
2026-05-31days on market $115,000 Active 12 DOM
-
2026-05-31days on market $115,000 Active 11 DOM
-
2026-05-19$115,000 Active
-
2025-10-28soldstatus $92,000
ⓘ Source: listings_history table (triggers on properties + properties_extension) + one-shot
backfill from property_details.listing_events for pre-trigger history.
Tax reassessment forecast AR · Resets to sale price
- Current annual tax
- $972 · $81/mo
- Projected year-2 tax
- $972 · $81/mo
- Expected delta
- $0/yr ($0/mo · 0.0%)
ⓘ Screening estimate from a state-policy table — verify with the county assessor before closing.
Climate risk First Street
- Flood 1/10 Low FEMA zone X (unshaded) · 0% chance over 30 yrs
- Wildfire 6/10 Major
- Heat 5/10 Major 7 d/yr ≥106°F today · 20 d/yr by 30 yrs out
- Wind 2/10 Low 2% chance of damaging wind over 30 yrs
- Air quality 2/10 Low 1 unhealthy d/yr today · 2 by 30 yrs out
Nearby sold comps map
Loading sold comps map…
Walkable amenities ~0.75 mi
Loading nearby amenities…
Taxation est. · year 1
- Rental income
- $15,345
- − Mortgage interest
- −$6,442
- − Property taxes
- −$972
- − Insurance
- −$575
- − Repairs & maintenance
- −$1,228
- − Management
- −$1,228
- − Depreciation
- −$3,345
- Taxable income
- $1,556
- Est. tax owed @ 24.0%
- −$373
- After-tax cash flow
- $2,965/yr
For passive investors: Depreciation is non-cash, so a rental often shows a tax loss while cash-flowing — sheltering income. Rental losses are passive: they offset passive income freely, and up to $25,000/yr can offset ordinary (W-2) income if you actively participate and your MAGI is under $100k (phasing out to $0 by $150k); unused losses carry forward. On sale, claimed depreciation is recaptured at up to 25%, and gains may owe capital-gains tax (a 1031 exchange can defer both). Figures are a year-1 estimate at your 24.0% rate — not tax advice; consult a CPA.
Schools (NCES district)
- District
- Siloam Springs School District
- NCES district ID
- 0512450
- Math proficiency
- 44% ▼ -7.00%
- Reading proficiency
- 40% ▼ -2.00%
- Median HH income
- $46,222
- Composite
- 35.81/100
- National rank
- #4828
- State rank
- #53 of 238 in AR
Livability — Siloam Springs
- Score
- 74/100
- State rank
- #17
- US rank
- #4621
Category grades
Schools grade is shown separately in the Schools card above.
Census & demographics
- Census place
- Siloam Springs, AR
- County
- Benton County · 259,241 people
- City population
- 24,745
- Metro
- Fayetteville-Springdale-Rogers, AR
- Population (ZIP)
- 24,745
- Household income
- $76,122
- Rent vs Own
- Severe rent burden
- 176.0
Population outlook (Benton County) Hauer SSP2
- Today (2025)
- 318,683 people
- By 2030
- 353,481 · +10.9%
- By 2040
- 425,280 · +33.4%
- By 2050
- 497,239 · +56.0%
- By 2075
- 662,114 · +107.8%
- By 2100
- 776,431 · +143.6%
Race, ethnicity, and origin ACS 2023
- Neighborhood character
- Diverse neighborhood (Simpson 0.63)
- Race & ethnicity
- White 58% Two or more races 24% Hispanic / Latino 19% Native American 4% Asian 3%
- Hispanic origin (detail)
- Mexican 8% Puerto Rican 2%
- Common ancestry
- Italian 2% Slovak 1% Serbian 1%
- Foreign-born
- 11% · Canada
- Languages at home
- 85% English-only · Spanish 13% Other Indo-European 1%
Political lean MEDSL · Benton
- 2024 margin
- Strong R (+27.0) · D 35.2% · R 62.1% · Other 2.7%
- 2008→2024 swing
- +9.6pp toward D · 2008: -36.5pp · 2024: -27.0pp
- All cycles
- 2024: R+27.0 2020: R+26.4 2016: R+34.9 2012: R+40.4 2008: R+36.5
Not yet ingested
- Civics
- —
Market trends
- HPI YoY
- ▼ -45.93%
- Current HPI
- 291.1062
- Rent YoY
- —
- Metro
- Fayetteville-Springdale-Rogers, AR
- State GDP YoY
- ▲ 3.80%
- F500 in state
- 10
Industry mix (Fortune 500 HQ in AR)
| Industry | F500 HQs | Revenue |
|---|---|---|
| Retail | 1 | $681B |
|
||
| Food / Agriculture | 1 | $53B |
|
||
| Retail / Energy | 1 | $22B |
|
||
| Transportation / Logistics | 1 | $12B |
|
||
| Energy | 1 | $4B |
|
||
Price history
+25.0% since first listed2 events — show timeline
- 2026-05-19 Listed $115,000 NWARMLS
- 2025-10-28 Sold (Public Records) $92,000 Public Records
Property tax history
+11.5%/yrLatest (2025): $972 · +10.2% YoY. Source: county tax records.
Cash-flow waterfall
monthlySold comps — $/sqft
last 12 mo · ≤1 miLoading sold comps…