 Fourplex
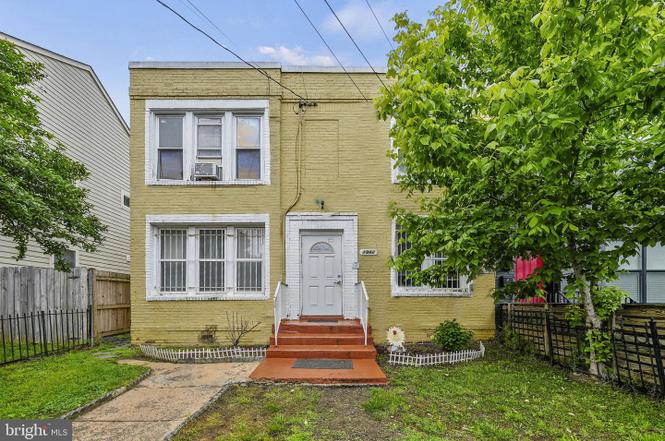
1942 Capitol Ave NE · Washington, DC
Flood risk 1/10 · Minimal
- FEMA flood zone
- X (unshaded)
- Chance of flooding over 30 yrs
- 0.0%
- Est. flood insurance / yr
- $507 – $1,088
Fire risk 1/10 · Minimal
- Est. fire insurance / yr
- $631 – $1,173
Heat risk 7/10 · Major
- Hot days now (above 106°F)
- 7 days/yr
- Hot days in 30 yrs
- 15 days/yr
Wind risk 4/10 · Minor
- Chance of severe wind over 30 yrs
- 21.0%
Air-quality risk 4/10 · Minor
- Unhealthy air days now
- 4 days/yr
- Unhealthy air days in 30 yrs
- 5 days/yr
Risk factors via First Street. Map © Google.
Why this score? — see what drove the B- grade
The composite is a weighted blend of 9 inputs, each scored 0–100. Each bar is that input's sub-score; the figure is the points it added to the 100-point composite (weight × sub-score).
- Cash flow +28.3/30.0
- ARV discount +11.1/15.0
- DSCR +10.0/10.0
- 1% rule +7.1/10.0
- Livability +3.7/5.0
- Schools +3.6/10.0
- Condition / age +2.5/5.0
- Rent growth +1.7/5.0
- Appreciation +0.0/10.0
$650,000
🖨 Deal sheet 📄 Offer letter ✓ Due diligence
Multi-family units
County records classify this as Multi-Family (2-4 Unit). Listing-text estimate: 4 units. confirmed
Listing remarks
1942 Capitol Ave NE, situated in the vibrant Ivy City neighborhood of Washington, DC. This quadruplex presents an exceptional investment opportunity! Each of the four units features 1 bedroom and 1 bathroom. Currently, units 1 and 3 are occupied, providing immediate rental income. On the other hand, units 2 and 4 offer the flexibility to customize according to your preferences and generate additional rental income. The TOPA requirements have been taken care of. You will appreciate the convenience of owning a property within walking distance to various markets, coffee shops, gyms, bars, and just minutes away from Union Market! Don't let this rare opportunity to invest in the thriving Ivy Cit
Key facts
- 3,600 sq ft lot
- Built 1943
- Listed 239 days
Tags
Property features AI
Finance
- Other: Estimated year built; Property located within city limits
- Financial info: Land assessed value available; Improvement assessed value available
Exterior
- Parking: On-street parking
- Utilities: Public water; Public sewer
- Home design: Multi-unit building (4 total units); Fee simple ownership
- Construction: Brick construction; Above-grade and below-grade structures; Above-grade finished area approximately 2,182
- Exterior features: Corner location (Fenwick St and Capitol Ave); Not tidal waterfront
Interior
- Bedrooms: Four one-bedroom units (multi-unit property)
- Heating & cooling: Radiator heat; Natural gas heating; Natural gas hot water; Cooling: Other
- Interior features: Estimated living area; No basement
Neighborhood map
What this means for you Summary
Snapshot
- This is a 4 × 1-bed/?-bath units multifamily listed at $650k.
Deal economics
- At list price, monthly cash flow is $2k ($25k/yr) — positive. Per door: $519/mo.
- The deal already cash-flows at list — no discount required.
- Meets the 1% rule at list price ($8k rent vs $650k).
- Recommended offer: $572k (12.0% below list) — sets the bar for market timing.
- Cap rate 10.1% vs local median 2.5% in Washington — top-decile yield for the area; either an underpriced asset or a hidden risk that comps aren't pricing in. Stress-test before assuming the spread holds.
Location & tenants
- Location reads 73/100 on livability (#1 in DC) — a middle-class / working-renter tenant base. Strengths: amenities A+, commute A+, employment A+; Watch: crime F, cost of living F.
- District Of Columbia Public Schools (urban): math 33% / reading 40% proficiency, ranked #8 of 32 in DC (top 25%) — families likely to look elsewhere, expect single-tenant / working-renter base with shorter leases; 65% free/reduced lunch — lower-income household profile, screen leases tightly.
- Market conditions: Rents falling (-3.0%/yr); 548 active listings in the ZIP; 40 comparable units currently listed for rent nearby; rentals at typical pace (median 24d on market — plan ~3-4 weeks tenant-placement turnaround); high-income renter base; 1,737 units permitted in District of Columbia in 2024 (1,506 in 5+ unit buildings).
- At $7,895/mo this rent would consume 79% of the median local household income ($120k/yr) (locally 3854% of renters already pay >50% of income on rent) — very limited rent-growth headroom before tenants either downsize or default.
Forward outlook
- Local home prices are declining (-3.0%/yr); year-one equity from $4k of loan paydown is wiped out by about $20k of value loss. Plan a longer hold.
- District of Columbia County population projected at +50% by 2050 — long-run rental-demand tailwind backs the buy-and-hold thesis.
Negotiation context
- It's been on market 239 days — a 12% lower offer ($572k) is reasonable based on typical stale-listing flexibility.
- 9 sale attempts since 15y ago with the ask held roughly flat each time — persistent listings suggest the price (not the market) is what's stuck; bring a comps-based counter.
- Current owner paid $290k; list at $650k implies a 124% gain — meaningful room to come down on a strong offer.
Risks & watch-outs
- Watch-outs: built in 1943 — expect roof / HVAC / electrical / plumbing capex.
- Climate carrying-cost: extreme-heat days projected 7→15/yr by 2055 (HVAC capex compounding) — expect insurance premiums to compound above CPI over the hold.
Questions for the listing agent
- It's been on market 239 days. Have you received any prior offers? Is the seller open to a 12% concession, seller financing, or rate buy-down credit?
- Can we see the unit-by-unit rent roll, current vacancy, and any below-market leases? What's the average tenancy length?
- What capital expenditures (roof, boiler, parking lot, exteriors) have been made in the last 5 years, and what's planned in the next 2?
- Built in 1943 — when were the roof, HVAC, electrical panel, plumbing, and water heater last replaced?
- Why hasn't it sold? Are there any deal-killer items the seller is aware of (foundation, flood, title, zoning, code violations)?
- Is there a deadline driving the sale (1031 exchange, divorce, estate, relocation)? That informs how much negotiation room exists.
- Crime grade is F in this area — have there been break-ins, vandalism, or insurance claims at this property in the last 3 years? What carrier currently insures it and at what premium?
- What's the average days-on-market for RENTAL listings here right now (not sales)? A rising rental-DOM trend means longer vacancies and softer asking-rent achievability than the comps imply.
- What's the recent tenant-quality profile in this submarket — average credit score on applications, eviction rate, late-payment / NSF rate, and stable-employment percentage? A property-management company in the area should have these aggregated.
- How much new apartment / multifamily construction is in the pipeline within 1–3 miles? Heavy new supply (>2% of stock underway) typically softens rents 12–24 months out; light construction supports rent growth.
Investment metrics
- 1% rule
- 1.21% ✓
- Cap rate
- 10.13%
- Cash-on-cash
- 13.70%
- DSCR
- 1.61
- GRM
- 6.9
CMA / ARV
- ARV (on-the-fly)
- $706,968
- Comps found
- 4
Show comp detail 4 sales within ~0.75 mi
| Address | Dist | Beds/Ba | Sqft | Sold | Price | $/sf | Match |
|---|---|---|---|---|---|---|---|
| 1308 Gallaudet St NE | 0.20mi | 4/— | 2,376 (+9%) | 8mo | $770,000 | $324 | 69 |
| 1959 Capitol Ave NE | 0.02mi | 4/4.0 | 2,496 (+14%) | 11mo | $550,000 | $220 | 66 |
| 1906 West Virginia Ave NE | 0.09mi | 4/4.0 | 2,024 (-7%) | 22mo | $475,000 | $235 | 65 |
| 1520-1524 Queen St NE | 0.56mi | 4/— | 2,442 (+12%) | 11mo | $814,000 | $333 | 45 |
Match score weights: distance 35% · size 25% · config 20% · recency 20%. Top-matched comps best support the ARV.
Projected returns pro-forma
-3.0% appreciation · 0.0% rent growth · sell at horizon
- IRR
- 0.6%
- Equity multiple
- 1.02×
- Total profit
- $3,766
- Equity at exit
- $96,917
- IRR
- 7.0%
- Equity multiple
- 1.46×
- Total profit
- $83,896
- Equity at exit
- $56,200
Cash invested: $182,000 (down + closing). Projections, not guarantees.
Landlord ↔ Tenant lean methodology
- Overall (CITY)
- 0 Strongly Tenant-Friendly
- State District of Columbia
- 12 Strongly Tenant-Friendly · D+43
- County
- — inherits STATE
- City Washington
- 0 Strongly Tenant-Friendly · D+43
ZIP-level market 20002
- Rents YoY
- -3.0%
- Active inventory
- 548
- Price-to-rent
- 27.4×
Monthly cashflow live
- Estimated rent
- $7,895 high interval (Pro) →
- Mortgage (P&I)
- −$3,409
- Tax from tax record
- −$480 /mo · $5,761/yr
- Insurance
- −$271
- HOA
- −$0
- Vacancy / Maint / Mgmt
- −$1,658
- Net cashflow
- $2,077
Break-even live
4-unit breakdown (identical units grouped — click to expand)
| Units | Beds | Baths | Est. rent |
|---|---|---|---|
| 4× units | 1 | — | $7,896 |
| #1 | 1 | — | $1,974 |
| #2 | 1 | — | $1,974 |
| #3 | 1 | — | $1,974 |
| #4 | 1 | — | $1,974 |
| Total (4 units) | $7,895 | ||
UW: 25.0% down · 7.5% · 30yr · 1.5% tax · 5.0% vac · 8.0% maint · 8.0% mgmt
Financing live
Cash to close
- Down payment
- $162,500
- Closing costs
- $19,500
- Reserves months
- —
- Total cash needed
- —
Loan-product check · same deal, 3 products live
Conventional
25% down · 7.5% · 30yr
- Down + closing
- —
- Monthly P&I
- —
- Monthly cashflow
- —
- DSCR
- —
- Eligible?
- —
Personal DTI + credit; lowest rate.
DSCR
20% down · 8.5% · 30yr
- Down + closing
- —
- Monthly P&I
- —
- Monthly cashflow
- —
- DSCR
- —
- Eligible?
- —
No personal income docs; deal must DSCR.
Hard money
10% down · 12.0% · 12mo
- Down + closing
- —
- Monthly P&I
- —
- Monthly cashflow
- —
- DSCR
- —
- Eligible?
- —
Short-term bridge; refi at stabilization.
Rent comps 40 comps
| Address | Beds | Baths | Sqft | Rent | $/sqft | DOM | Units | Dist |
|---|---|---|---|---|---|---|---|---|
| 1916 W Virginia Ave NE Unit 2 Washington, DC | 3.0 | 2.0 | 1800 | $2,900 | $1.61 | 20d | 1 | 0.08mi |
| 1495 Gallaudet St NE Unit 1495B Washington, DC | 3.0 | 2.5 | 1586 | $4,141 | $2.61 | 24d | 1 | 0.16mi |
| 1714 Montello Ave NE Washington, DC | 4.0 | 3.0 | 2100 | $4,350 | $2.07 | 24d | 1 | 0.26mi |
| 1255 Raum St NE Unit 1388282P Washington, DC | 2.0–8.0 | 1.0–5.0 | 3245 | $6,967 | $2.15 | 1d | 2 | 0.34mi |
| 1638 Trinidad Ave NE #1 Washington, DC | 3.0 | 2.5 | 1780 | $5,950 | $3.34 | 18d | 1 | 0.42mi |
| 2218 16th St NE Washington, DC | 4.0 | 2.5 | 1496 | $3,400 | $2.27 | 18d | 1 | 0.49mi |
| 1222 Owen Pl NE Washington, DC | 4.0 | 2.5 | 2164 | $3,800 | $1.76 | 24d | 1 | 0.52mi |
| 1334 Downing St NE Washington, DC | 3.0 | 1.0 | 1408 | $3,000 | $2.13 | 24d | 1 | 0.52mi |
| 1417 Montello Ave NE Washington, DC | 3.0 | 2.5 | 1412 | $4,995 | $3.54 | 24d | 1 | 0.54mi |
| 1331 Queen St NE Washington, DC | 3.0 | 2.0 | 1708 | $4,600 | $2.69 | 14d | 1 | 0.54mi |
| 1331 Queen St NE Washington, DC | 3.0 | 2.0 | 1708 | $4,600 | $2.69 | 16d | 1 | 0.54mi |
| 2300 18th St NE #2300 Washington, DC | 4.0 | 3.0 | 1826 | $4,500 | $2.46 | 21d | 1 | 0.57mi |
| 1157 Oates St NE Unit 1A Washington, DC | 3.0 | 3.0 | 1400 | $4,000 | $2.86 | 24d | 1 | 0.58mi |
| 1704 Montana Ave NE Washington, DC | 4.0 | 2.0 | 1518 | $4,000 | $2.64 | 24d | 1 | 0.59mi |
| 1417 Downing St NE Washington, DC | 4.0 | 2.0 | 1538 | $4,200 | $2.73 | 4d | 1 | 0.59mi |
| 1609 Levis St NE Washington, DC | 4.0 | 4.5 | 2295 | $3,900 | $1.70 | 24d | 1 | 0.63mi |
| 2413 14th St NE Washington, DC | 1.0–5.0 | 1.0–2.0 | 1121 | $2,821 | $2.52 | 3d | 46 | 0.66mi |
| 1640 L St NE Washington, DC | 3.0 | 2.0 | 2300 | $3,700 | $1.61 | 18d | 1 | 0.66mi |
| 1232 Trinidad Ave NE Unit 1 Washington, DC | 3.0 | 2.5 | 1478 | $4,000 | $2.71 | 24d | 1 | 0.69mi |
| 1169 Morse St NE Washington, DC | 3.0 | 3.0 | 2274 | $4,250 | $1.87 | 3d | 1 | 0.72mi |
| 1117 Montello Ave NE Washington, DC | 4.0 | 3.5 | 2260 | $4,500 | $1.99 | 24d | 1 | 0.74mi |
| 1006 18th St NE Washington, DC | 3.0 | 2.5 | 1684 | $3,095 | $1.84 | 24d | 1 | 0.77mi |
| 1213 Holbrook St NE #1 Washington, DC | 3.0 | 2.5 | 1618 | $3,850 | $2.38 | 18d | 1 | 0.79mi |
| 1103 9th St NE Unit 1 DOWNSTAIRS Washington, DC | 3.0 | 3.5 | 1500 | $3,549 | $2.37 | 24d | 1 | 0.81mi |
| 1321 I St NE Washington, DC | 4.0 | 3.5 | 1809 | $4,600 | $2.54 | 24d | 1 | 0.85mi |
| 1241 I St NE Washington, DC | 3.0 | 2.5 | 1402 | $4,000 | $2.85 | 24d | 1 | 0.86mi |
| 300 Neal Pl NE Washington, DC | 4.0 | 1.0–4.0 | 951 | $6,363 | $6.69 | 1d | 10 | 0.88mi |
| 1011 8th St NE Washington, DC | 3.0 | 2.5 | 1672 | $4,495 | $2.69 | 24d | 1 | 0.88mi |
| 1324 H St NE Unit 2 Washington, DC | 4.0 | 1.5 | 2100 | $4,000 | $1.90 | 24d | 1 | 0.89mi |
| 1113 I St NE Washington, DC | 3.0 | 1.0 | 1800 | $3,325 | $1.85 | 24d | 1 | 0.90mi |
| 1209 6th St NE Unit A Washington, DC | 4.0 | 1.5 | 1648 | $3,400 | $2.06 | 24d | 1 | 0.90mi |
| 1280 Union St NE Washington, DC | 1.0–3.0 | 1.0–3.0 | 1122 | $8,925 | $7.95 | 1d | 22 | 0.93mi |
| 847 20th St NE Washington, DC | 4.0 | 2.5 | 1802 | $4,100 | $2.28 | 12d | 1 | 0.94mi |
| 847 20th St NE Washington, DC | 3.0 | 2.5 | 1802 | $4,100 | $2.28 | 15d | 1 | 0.94mi |
| 1501 Harry Thomas Way NE Washington, DC | 3.0 | 1.0–3.0 | 1220 | $5,655 | $4.64 | 1d | 26 | 0.95mi |
| 2720 10th St NE Washington, DC | 3.0 | 1.5 | 1400 | $1,580 | $1.13 | 7d | 1 | 0.96mi |
| 721 K St NE Washington, DC | 3.0 | 1.0 | 1832 | $4,500 | $2.46 | 24d | 1 | 0.96mi |
| 2129 4th St NE Washington, DC | 4.0 | 3.5 | 2052 | $4,400 | $2.14 | 24d | 1 | 0.97mi |
| 2726 10th St NE Washington, DC | 3.0 | 2.5 | 1400 | $4,000 | $2.86 | 24d | 1 | 0.97mi |
| 2104 4th St NE #1 Washington, DC | 4.0 | 3.5 | 2165 | $6,150 | $2.84 | 24d | 1 | 0.98mi |
Listing history 39 events
-
2026-06-18days on market $650,000 Active 239 DOM
-
2026-06-17days on market $650,000 Active 238 DOM
-
2026-06-16days on market $650,000 Active 237 DOM
-
2026-06-15days on market $650,000 Active 236 DOM
-
2026-06-13days on market $650,000 Active 234 DOM
-
2026-06-09days on market $650,000 Active 230 DOM
-
2026-06-08days on market $650,000 Active 229 DOM
-
2026-06-07days on market $650,000 Active 228 DOM
-
2026-06-04days on market $650,000 Active 225 DOM
-
2026-06-03days on market $650,000 Active 224 DOM
-
2026-06-02days on market $650,000 Active 223 DOM
-
2026-06-01days on market $650,000 Active 222 DOM
-
2026-05-31days on market $650,000 Active 221 DOM
-
2025-10-22$650,000 Active
-
2025-09-30historical
-
2025-06-05price $735,900
-
2024-12-05price $749,900
-
2024-10-11status Active
-
2024-10-10historical
-
2024-10-09$765,000 Active
-
2024-09-30historical
-
2024-08-30price $789,900
-
2024-06-11price $799,900
-
2024-05-16$895,000 Active
-
2024-05-15historical
-
2022-02-13price $1,200
-
2013-01-02soldstatus $290,000
-
2012-12-26soldstatus $290,000 Sold
-
2012-12-26soldstatus $290,000
-
2012-12-08status Contingent (No Kick Out)
-
2012-12-06historical
-
2012-08-18$299,900 Active
-
2012-08-18$299,900
-
2012-08-02historical Withdrawn
-
2012-08-01historical
-
2012-07-03status Active
-
2012-07-01historical Expired
-
2011-09-09Active
-
2011-09-09$314,999
ⓘ Source: listings_history table (triggers on properties + properties_extension) + one-shot
backfill from property_details.listing_events for pre-trigger history.
Tax reassessment forecast DC · Partial reset (capped growth)
- Current annual tax
- $5,761 · $480/mo
- Projected year-2 tax
- $5,761 · $480/mo
- Expected delta
- $0/yr ($0/mo · 0.0%)
ⓘ Screening estimate from a state-policy table — verify with the county assessor before closing.
Climate risk First Street
- Flood 1/10 Low FEMA zone X (unshaded) · 0% chance over 30 yrs
- Wildfire 1/10 Low
- Heat 7/10 Severe 7 d/yr ≥106°F today · 15 d/yr by 30 yrs out
- Wind 4/10 Moderate 21% chance of damaging wind over 30 yrs
- Air quality 4/10 Moderate 4 unhealthy d/yr today · 5 by 30 yrs out
Nearby sold comps map
Loading sold comps map…
Walkable amenities ~0.75 mi
Loading nearby amenities…
Taxation est. · year 1
- Rental income
- $94,740
- − Mortgage interest
- −$36,410
- − Property taxes
- −$5,761
- − Insurance
- −$3,250
- − Repairs & maintenance
- −$7,579
- − Management
- −$7,579
- − Depreciation
- −$18,909
- Taxable income
- $15,252
- Est. tax owed @ 24.0%
- −$3,660
- After-tax cash flow
- $21,269/yr
For passive investors: Depreciation is non-cash, so a rental often shows a tax loss while cash-flowing — sheltering income. Rental losses are passive: they offset passive income freely, and up to $25,000/yr can offset ordinary (W-2) income if you actively participate and your MAGI is under $100k (phasing out to $0 by $150k); unused losses carry forward. On sale, claimed depreciation is recaptured at up to 25%, and gains may owe capital-gains tax (a 1031 exchange can defer both). Figures are a year-1 estimate at your 24.0% rate — not tax advice; consult a CPA.
Schools (NCES district)
- District
- District Of Columbia Public Schools
- NCES district ID
- 1100030
- Math proficiency
- 33% ▲ 3.00%
- Reading proficiency
- 40% ▲ 5.00%
- Median HH income
- $67,671
- Composite
- 35.84/100
- National rank
- #9606
- State rank
- #8 of 32 in DC
Livability — Washington
- Score
- 73/100
- State rank
- #1
- US rank
- #5327
Category grades
Schools grade is shown separately in the Schools card above.
Census & demographics
- Census place
- Washington, DC
- County
- District of Columbia · 671,873 people
- City population
- 671,873
- Metro
- Washington-Arlington-Alexandria, DC-VA-MD-WV
- Population (ZIP)
- 72,397
- Household income
- $120,337
- Rent vs Own
- Severe rent burden
- 3854.0
Population outlook (District of Columbia County) Hauer SSP2
- Today (2025)
- 821,926 people
- By 2030
- 899,517 · +9.4%
- By 2040
- 1,061,162 · +29.1%
- By 2050
- 1,231,493 · +49.8%
- By 2075
- 1,603,312 · +95.1%
- By 2100
- 1,847,141 · +124.7%
Race, ethnicity, and origin ACS 2023
- Neighborhood character
- Diverse neighborhood (Simpson 0.66)
- Race & ethnicity
- White 41% Black 40% Two or more races 9% Hispanic / Latino 9% Asian 3%
- Hispanic origin (detail)
- Mexican 2%
- Common ancestry
- Romanian 3% Lithuanian 2% Italian 2%
- Foreign-born
- 9% · Canada, China, South Korea
- Languages at home
- 87% English-only · Spanish 5% French/Haitian/Cajun 2% Other Indo-European 1%
Political lean MEDSL · District of Columbia
- 2024 margin
- Solid D (+86.1) · D 91.2% · R 5.1% · Other 3.8%
- 2008→2024 swing
- +0.1pp no change · 2008: 85.9pp · 2024: 86.1pp
- All cycles
- 2024: D+86.1 2020: D+86.8 2016: D+88.7 2012: D+84.2 2008: D+85.9
Not yet ingested
- Civics
- —
Market trends
- HPI YoY
- ▼ -852.61%
- Current HPI
- 396.6033
- Rent YoY
- ▼ -3.04%
- Metro
- Washington-Arlington-Alexandria, DC-VA-MD-WV
- State GDP YoY
- ▲ 1.33%
- F500 in state
- 6
Industry mix (Fortune 500 HQ in DC)
| Industry | F500 HQs | Revenue |
|---|---|---|
| Financial Services | 1 | $153B |
|
||
| Life Sciences / Industrials | 1 | $25B |
|
||
| Industrial Machinery | 1 | $8B |
|
||
Price history
+106.3% since first listed26 events — show timeline
- 2025-10-22 Listed $650,000 BRIGHT MLS
- 2025-09-30 Listing Removed — BRIGHT MLS
- 2025-06-05 Price Changed $735,900 BRIGHT MLS
- 2024-12-05 Price Changed $749,900 BRIGHT MLS
- 2024-10-11 Relisted — BRIGHT MLS
- 2024-10-10 Listing Removed — BRIGHT MLS
- 2024-10-09 Listed $765,000 BRIGHT MLS
- 2024-09-30 Listing Removed — BRIGHT MLS
- 2024-08-30 Price Changed $789,900 BRIGHT MLS
- 2024-06-11 Price Changed $799,900 BRIGHT MLS
- 2024-05-16 Listed $895,000 BRIGHT MLS
- 2024-05-15 Coming Soon — BRIGHT MLS
- 2022-02-13 Price Changed $1,200 RENT.
- 2013-01-02 Sold (Public Records) $290,000 Public Records
- 2012-12-26 Sold (MLS) $290,000 BRIGHT MLS
- 2012-12-26 Sold (MLS) $290,000 MRIS
- 2012-12-08 Pending — MRIS
- 2012-12-06 Listing Removed — BRIGHT MLS
- 2012-08-18 Listed $299,900 MRIS
- 2012-08-18 Listed $299,900 BRIGHT MLS
- 2012-08-02 Delisted — MRIS
- 2012-08-01 Listing Removed — BRIGHT MLS
- 2012-07-03 Relisted — MRIS
- 2012-07-01 Delisted — MRIS
- 2011-09-09 Listed — MRIS
- 2011-09-09 Listed $314,999 BRIGHT MLS
Property tax history
+4.8%/yrLatest (2025): $5,761 · +2.5% YoY. Source: county tax records.
Cash-flow waterfall
monthlySold comps — $/sqft
last 12 mo · ≤1 miLoading sold comps…