176 Cushing Way · Layton, UT
Flood risk No data
- FEMA flood zone
- —
- Chance of flooding over 30 yrs
- —
- Est. flood insurance / yr
- —
Fire risk No data
- Est. fire insurance / yr
- —
Heat risk No data
- Hot days now (above threshold)
- —
- Hot days in 30 yrs
- —
Wind risk No data
- Chance of severe wind over 30 yrs
- —
Air-quality risk No data
- Unhealthy air days now
- —
- Unhealthy air days in 30 yrs
- —
Risk factors via First Street. Map © Google.
Why this score? — see what drove the D- grade
The composite is a weighted blend of 9 inputs, each scored 0–100. Each bar is that input's sub-score; the figure is the points it added to the 100-point composite (weight × sub-score).
- 1% rule +10.0/10.0
- ARV discount +7.5/15.0
- Cash flow +6.6/30.0
- Livability +4.3/5.0
- Schools +4.1/10.0
- Rent growth +2.8/5.0
- Condition / age +2.5/5.0
- DSCR +0.9/10.0
- Appreciation +0.0/10.0
$102,500
🖨 Deal sheet 📄 Offer letter ✓ Due diligence
Listing remarks
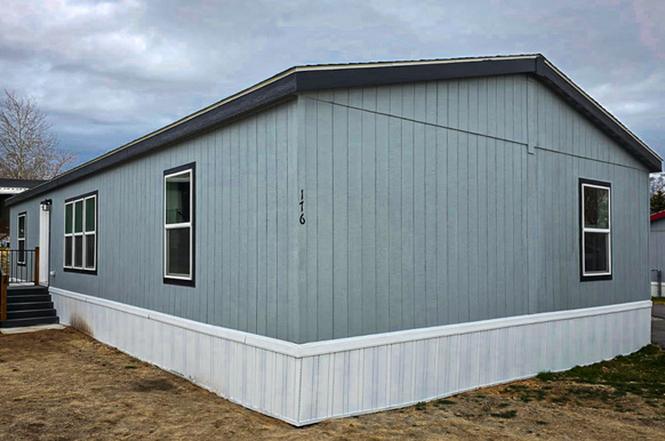
* * * 1 MONTHS FREE LOT RENT * * * BRAND NEW 2026 Cavco 3 bedroom 2 bathroom home. At 1,493 Sq ft. , this home features a spacious, open living room and kitchen area that's great for entertaining. Located in the Rolling Hills Estates Community in Layton. Owners enjoy access to a pool, clubhouse, playground, Common RV Parking, and more. Shed, Central A/C. Kitchen Appliances (Fridge, Range, Dishwasher) are all included. The listing is for a manufactured home; no land is included with the sale. Buyers must qualify to live in the community. Buyer to verify all information.
Key facts
- Common rv parking
- Access to clubhouse
- Access to pool
Tags
Property features AI
Finance
- HOA & community: Homeowners association: Rolling Hills Mana; Monthly association fee of $999; Community clubhouse, management, pet rules, picnic area, playground, pool, storage; Subdivision: ROLLING HILLS ESTATES
Exterior
- Parking: 2 total parking spaces (2 open)
- Utilities: Natural gas connected; Electricity connected; Sewer connected; Culinary water connected
- Home design: Mobile home; Built/standing condition; Residential use
- Construction: Asphalt construction material; No basement
- Exterior features: Heated in-ground pool; Asphalt roof
Interior
- Kitchen: Range/Oven (free standing)
- Bedrooms: 3 bedrooms on the main level
- Flooring: Carpet; Linoleum
- Bathrooms: 2 full bathrooms
- Heating & cooling: Gas central heating; Central air conditioning
- Interior features: Free standing range/oven; Double pane windows
Neighborhood map
What this means for you Summary
Snapshot
- This is a 3-bed/2.0-bath manufactured listed at $102k.
Deal economics
- At list price, monthly cash flow is $-169 ($-2k/yr) — negative.
- To cash-flow at today's rent, offer at most $78k (23.8% below list).
- Meets the 1% rule at list price ($2k rent vs $102k).
- Recommended offer: $78k (23.8% below list) — sets the bar for cash-flow.
Location & tenants
- Location reads 86/100 on livability (#11 in UT, #457 nationally) — a professional / high-income tenant draw. Strengths: commute A+, employment A+, housing A+.
- Davis District (suburban): math 43% / reading 47% proficiency, ranked #28 of 80 in UT (top 35%) — families likely to look elsewhere, expect single-tenant / working-renter base with shorter leases; only 19% free/reduced lunch — higher-income household profile.
- Zoned schools: Lincoln School (math 13% / reading 16%, grade F, #559 of 585 statewide, top 96%, 703 students, 42% FRL); North Layton Jr High (math 39% / reading 40%, grade F, #75 of 138 statewide, top 56%, 1,009 students, 30% FRL); Northridge High (math 24% / reading 43%, grade F, #106 of 171 statewide, top 62%, 1,954 students, 23% FRL).
- Zoned-school proficiency averages 29% at this address vs 45% district-wide (-16 pts) — the specific schools serving this property underperform the Davis District average; the district grade overstates school quality for this exact location.
- Market conditions: Rents rising (+1.3%/yr); 342 active listings in the ZIP; 12 comparable units currently listed for rent nearby; rentals at typical pace (median 14d on market — plan ~3-4 weeks tenant-placement turnaround); solid renter incomes; 1,461 units permitted in Davis County in 2024 (508 in 5+ unit buildings).
Forward outlook
- Local home prices are declining (-3.0%/yr); year-one equity from $709 of loan paydown is wiped out by about $3k of value loss. Plan a longer hold.
- Davis County population projected at +39% by 2050 — long-run rental-demand tailwind backs the buy-and-hold thesis.
Negotiation context
- It's been on market 178 days — a 12% lower offer ($90k) is reasonable based on typical stale-listing flexibility.
Risks & watch-outs
- Watch-outs: HOA is 51% of rent.
Questions for the listing agent
- What do current leases actually rent for vs. the listed asking? Can we see a recent rent roll and the last 12 months of T-12 income?
- It's been on market 178 days. Have you received any prior offers? Is the seller open to a 24% concession, seller financing, or rate buy-down credit?
- What does the HOA fee cover, when was the last increase, and are there any pending special assessments or reserve-fund shortfalls?
- Why hasn't it sold? Are there any deal-killer items the seller is aware of (foundation, flood, title, zoning, code violations)?
- Is there a deadline driving the sale (1031 exchange, divorce, estate, relocation)? That informs how much negotiation room exists.
- Schools are B-rated — typically a magnet for longer-tenancy family renters. What's the average tenant stay here, and is there a school-zone premium baked into asking?
- The area grade is low — what's the realistic commute time and amenity access for the typical tenant pool here? Any planned neighborhood developments (good or bad) we should know about?
- What's the average days-on-market for RENTAL listings here right now (not sales)? A rising rental-DOM trend means longer vacancies and softer asking-rent achievability than the comps imply.
- What's the recent tenant-quality profile in this submarket — average credit score on applications, eviction rate, late-payment / NSF rate, and stable-employment percentage? A property-management company in the area should have these aggregated.
- How much new for-sale + rental construction is in the pipeline within 1–3 miles? Heavy new supply typically softens prices + rents 12–24 months out; constrained supply supports both.
Investment metrics
- 1% rule
- 1.90% ✓
- Cap rate
- 4.32%
- Cash-on-cash
- -7.05%
- DSCR
- 0.69
- GRM
- 4.4
CMA / ARV
No comps found within radius.
Projected returns pro-forma
-3.0% appreciation · 1.3% rent growth · sell at horizon
- IRR
- -33.1%
- Equity multiple
- -0.04×
- Total profit
- $-29,985
- Equity at exit
- $15,283
- IRR
- -73.6%
- Equity multiple
- -0.75×
- Total profit
- $-50,321
- Equity at exit
- $8,862
Cash invested: $28,700 (down + closing). Projections, not guarantees.
Landlord ↔ Tenant lean methodology
- Overall (STATE)
- 86 Strongly Landlord-Friendly
- State Utah
- 86 Strongly Landlord-Friendly · R+15
- County
- — inherits STATE
- City
- — inherits STATE
ZIP-level market 84041
- Rents YoY
- 1.3%
- Active inventory
- 342
- Price-to-rent
- 4.4×
Monthly cashflow live
- Estimated rent
- $1,948 high interval (Pro) →
- Mortgage (P&I)
- −$538
- Tax est. 1.5%
- −$128 /mo · $1,538/yr
- Insurance
- −$43
- HOA
- −$999
- Vacancy / Maint / Mgmt
- −$409
- Net cashflow
- $-169
Break-even live
UW: 25.0% down · 7.5% · 30yr · 1.5% tax · 5.0% vac · 8.0% maint · 8.0% mgmt
Financing live
Cash to close
- Down payment
- $25,625
- Closing costs
- $3,075
- Reserves months
- —
- Total cash needed
- —
Loan-product check · same deal, 3 products live
Conventional
25% down · 7.5% · 30yr
- Down + closing
- —
- Monthly P&I
- —
- Monthly cashflow
- —
- DSCR
- —
- Eligible?
- —
Personal DTI + credit; lowest rate.
DSCR
20% down · 8.5% · 30yr
- Down + closing
- —
- Monthly P&I
- —
- Monthly cashflow
- —
- DSCR
- —
- Eligible?
- —
No personal income docs; deal must DSCR.
Hard money
10% down · 12.0% · 12mo
- Down + closing
- —
- Monthly P&I
- —
- Monthly cashflow
- —
- DSCR
- —
- Eligible?
- —
Short-term bridge; refi at stabilization.
Rent comps 12 comps
| Address | Beds | Baths | Sqft | Rent | $/sqft | DOM | Units | Dist |
|---|---|---|---|---|---|---|---|---|
| 2899 N 1150 W Layton, UT | 3.0 | 2.5 | 1410 | $1,825 | $1.29 | 23d | 1 | 0.89mi |
| 1025 Clearfield, UT | 3.0 | 2.0 | 1530 | $2,000 | $1.31 | 14d | 1 | 0.96mi |
| 3306 N Fairfield Rd Unit B Layton, UT | 2.0 | 2.0 | 1250 | $1,900 | $1.52 | 19d | 1 | 1.08mi |
| 3306 N Fairfield Rd Unit A Layton, UT | 2.0 | 2.0 | 1200 | $1,850 | $1.54 | 19d | 1 | 1.08mi |
| 1100 S 2000 E Clearfield, UT | 1.0–3.0 | 1.0–2.0 | 895 | $1,952 | $2.18 | 13d | 32 | 1.12mi |
| 1902 E 700 S Clearfield, UT | 1.0–3.0 | 1.0–2.0 | 1085 | $2,415 | $2.23 | 14d | 21 | 1.16mi |
| 1300 S 1800 E Clearfield, UT | 1.0–3.0 | 1.0–2.0 | 1113 | $2,197 | $1.97 | 14d | 20 | 1.18mi |
| 774 S 1650 E Unit A Clearfield, UT | 4.0 | 2.0 | 1872 | $1,975 | $1.06 | 23d | 1 | 1.21mi |
| 1814 N 700 W Layton, UT | 1.0–2.0 | 1.0–2.0 | 838 | $1,734 | $2.07 | 14d | 10 | 1.23mi |
| 1656 N 400 W Layton, UT | 1.0–2.0 | 1.0–1.5 | 848 | $1,584 | $1.87 | 14d | 10 | 1.30mi |
| 1200 S 1500 E Clearfield, UT | 1.0–2.0 | 1.0 | 815 | $1,260 | $1.55 | 14d | 18 | 1.36mi |
| 900 S 1500 E Clearfield, UT | 1.0–3.0 | 1.0–2.5 | 1175 | $1,855 | $1.58 | 13d | 7 | 1.48mi |
HOA detail
- Monthly dues
- $999 · $11,988/yr
- Likely covers
- pool
Listing history 20 events
-
2026-06-18days on market $102,500 Active 178 DOM
-
2026-06-17days on market $102,500 Active 177 DOM
-
2026-06-16days on market $102,500 Active 176 DOM
-
2026-06-15days on market $102,500 Active 175 DOM
-
2026-06-14days on market $102,500 Active 173 DOM
-
2026-06-13days on market $102,500 Active 172 DOM
-
2026-06-10days on market $102,500 Active 170 DOM
-
2026-06-09days on market $102,500 Active 169 DOM
-
2026-06-08days on market $102,500 Active 168 DOM
-
2026-06-07days on market $102,500 Active 167 DOM
-
2026-06-05days on market $102,500 Active 164 DOM
-
2026-06-03days on market $102,500 Active 163 DOM
-
2026-06-02days on market $102,500 Active 162 DOM
-
2026-06-01days on market $102,500 Active 161 DOM
-
2026-05-31days on market $102,500 Active 160 DOM
-
2026-05-31days on market $102,500 Active 159 DOM
-
2026-05-11price $102,500
-
2026-05-07price $102,000
-
2026-03-19price $119,900
-
2025-12-22$135,000 Active
ⓘ Source: listings_history table (triggers on properties + properties_extension) + one-shot
backfill from property_details.listing_events for pre-trigger history.
Nearby sold comps map
Loading sold comps map…
Walkable amenities ~0.75 mi
Loading nearby amenities…
Taxation est. · year 1
- Rental income
- $23,373
- − Mortgage interest
- −$5,742
- − Property taxes
- −$1,538
- − Insurance
- −$512
- − Repairs & maintenance
- −$1,870
- − Management
- −$1,870
- − HOA
- −$11,988
- − Depreciation
- −$2,982
- Taxable loss
- −$3,128
- Est. tax savings @ 24.0%
- +$751
- After-tax cash flow
- $-1,273/yr
For passive investors: Depreciation is non-cash, so a rental often shows a tax loss while cash-flowing — sheltering income. Rental losses are passive: they offset passive income freely, and up to $25,000/yr can offset ordinary (W-2) income if you actively participate and your MAGI is under $100k (phasing out to $0 by $150k); unused losses carry forward. On sale, claimed depreciation is recaptured at up to 25%, and gains may owe capital-gains tax (a 1031 exchange can defer both). Figures are a year-1 estimate at your 24.0% rate — not tax advice; consult a CPA.
Schools (NCES district)
- District
- Davis District
- NCES district ID
- 4900210
- Math proficiency
- 43% ▼ -9.00%
- Reading proficiency
- 47% ▼ -5.00%
- Median HH income
- $70,511
- Composite
- 40.59/100
- National rank
- #3698
- State rank
- #28 of 80 in UT
Livability — Layton
- Score
- 86/100
- State rank
- #11
- US rank
- #457
Category grades
Schools grade is shown separately in the Schools card above.
Census & demographics
- Census place
- Layton, UT
- County
- Davis County · 341,755 people
- City population
- 83,689
- Metro
- Ogden-Clearfield, UT
- Population (ZIP)
- 55,180
- Household income
- $89,604
- Rent vs Own
- Severe rent burden
- 1058.0
Population outlook (Davis County) Hauer SSP2
- Today (2025)
- 399,271 people
- By 2030
- 430,528 · +7.8%
- By 2040
- 493,485 · +23.6%
- By 2050
- 555,187 · +39.1%
- By 2075
- 688,589 · +72.5%
- By 2100
- 769,646 · +92.8%
Race, ethnicity, and origin ACS 2023
- Neighborhood character
- Predominantly White (75%)
- Race & ethnicity
- White 75% Hispanic / Latino 17% Two or more races 10% Asian 2% Black 1% Pacific Islander 1%
- Hispanic origin (detail)
- Mexican 12%
- Common ancestry
- Slovak 4% Italian 2% Portuguese 2%
- Foreign-born
- 7% · Canada
- Languages at home
- 86% English-only · Spanish 11% Tagalog/Filipino 1% Other Indo-European 1%
Political lean MEDSL · Davis
- 2024 margin
- Strong R (+24.9) · D 36.0% · R 60.8% · Other 3.2%
- 2008→2024 swing
- +17.4pp toward D · 2008: -42.3pp · 2024: -24.9pp
- All cycles
- 2024: R+24.9 2020: R+27.5 2016: R+23.3 2012: R+61.8 2008: R+42.3
Not yet ingested
- Civics
- —
Market trends
- HPI YoY
- ▼ -173.00%
- Current HPI
- 307.2627
- Rent YoY
- ▲ 1.30%
- Metro
- Ogden-Clearfield, UT
- State GDP YoY
- ▲ 3.54%
- F500 in state
- 2
Industry mix (Fortune 500 HQ in UT)
| Industry | F500 HQs | Revenue |
|---|---|---|
| Financial Services | 1 | $3B |
|
||
Price history
-24.1% since first listed4 events — show timeline
- 2026-05-11 Price Changed $102,500 WFRMLS
- 2026-05-07 Price Changed $102,000 WFRMLS
- 2026-03-19 Price Changed $119,900 WFRMLS
- 2025-12-22 Listed $135,000 WFRMLS
Cash-flow waterfall
monthlySold comps — $/sqft
last 12 mo · ≤1 miLoading sold comps…