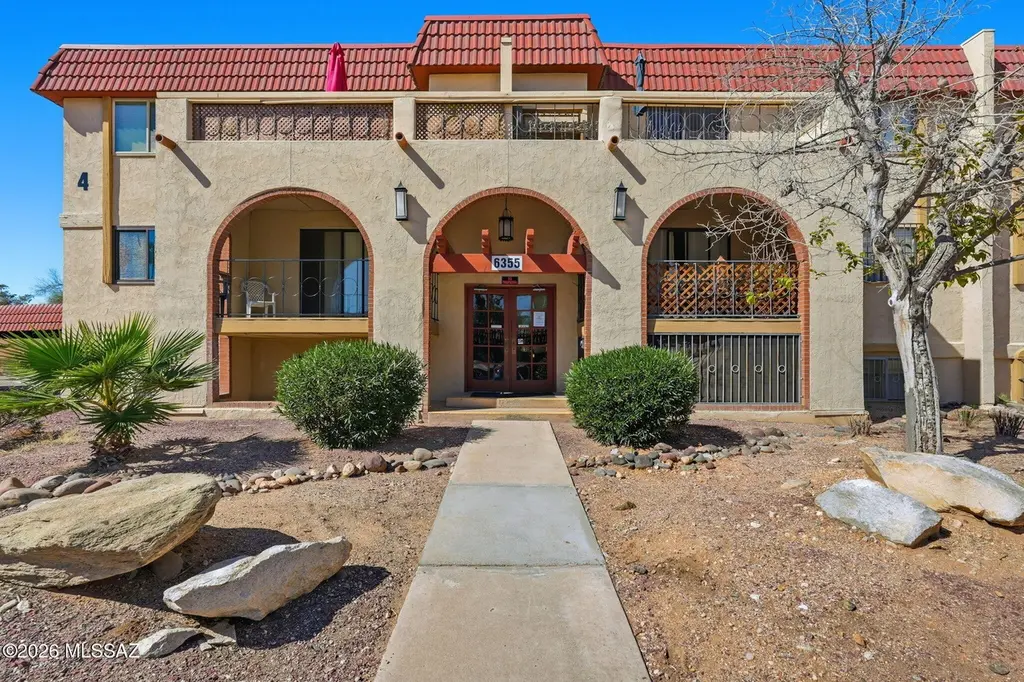
6355 N Barcelona Ln #401 · Casas Adobes, AZ
Flood risk 1/10 · Minimal
- FEMA flood zone
- X (unshaded)
- Chance of flooding over 30 yrs
- 0.0%
- Est. flood insurance / yr
- $507 – $1,088
Fire risk 3/10 · Minor
- Est. fire insurance / yr
- $610 – $1,132
Heat risk 8/10 · Major
- Hot days now (above 106°F)
- 7 days/yr
- Hot days in 30 yrs
- 20 days/yr
Wind risk 1/10 · Minimal
- Chance of severe wind over 30 yrs
- —
Air-quality risk 1/10 · Minimal
- Unhealthy air days now
- 0 days/yr
- Unhealthy air days in 30 yrs
- 0 days/yr
Risk factors via First Street. Map © Google.
Why this score? — see what drove the D+ grade
The composite is a weighted blend of 9 inputs, each scored 0–100. Each bar is that input's sub-score; the figure is the points it added to the 100-point composite (weight × sub-score).
- ARV discount +15.0/15.0
- Cash flow +9.5/30.0
- 1% rule +7.5/10.0
- Livability +4.0/5.0
- Condition / age +4.0/5.0
- Schools +3.1/10.0
- Rent growth +3.0/5.0
- DSCR +2.7/10.0
- Appreciation +0.0/10.0
$83,500
🖨 Deal sheet 📄 Offer letter ✓ Due diligence
Listing remarks MLS
Prime North Tucson investment or perfect home! This 1 bed, 1 bath condo in Barcelona Manor offers unbeatable convenience near U of A, downtown, & I-10. The spacious 672 square feet layout features a large bedroom, a generous walk in closet, and a private balcony, a perfect canvas ready for your personal updates. Enjoy resort style living as the HOA fee covers gas, water, trash, sewer, exterior maintenance, 2 refreshing pools, & a clubhouse. With rentals allowed, this is a fantastic income property. Embrace a true lock-and-leave lifestyle with shopping, dining, & the Rillito Bike Path nearby. Don't miss this chance for affordable ownership in a desirable community with fantastic amenities and mountain views!
Key facts
- 2 refreshing pools
- Clubhouse
- Private balcony
Tags
Neighborhood map
What this means for you Summary
Snapshot
- This is a 1-bed/1.0-bath condo listed at $84k. Condition is rated good.
Deal economics
- At list price, monthly cash flow is $-59 ($-705/yr) — negative.
- The deal already cash-flows at list — no discount required.
- Meets the 1% rule at list price ($1k rent vs $84k).
- Recommended offer: $76k (9.0% below list) — sets the bar for market timing.
- Cap rate 5.4% vs local median 3.5% in Casas Adobes — top-decile yield for the area; either an underpriced asset or a hidden risk that comps aren't pricing in. Stress-test before assuming the spread holds.
Location & tenants
- Location reads 79/100 on livability (#8 in AZ, #2,353 nationally) — a middle-class / working-renter tenant base. Strengths: housing A+, health & safety A, employment B+; Watch: schools C-, amenities D.
- Amphitheater Unified District (4406) (suburban): math 32% / reading 40% proficiency, ranked #85 of 249 in AZ (top 34%) — families likely to look elsewhere, expect single-tenant / working-renter base with shorter leases.
- Market conditions: Rents rising (+1.8%/yr); 164 active listings in the ZIP; 12 comparable units currently listed for rent nearby; rentals at typical pace (median 17d on market — plan ~3-4 weeks tenant-placement turnaround); solid renter incomes; 5,268 units permitted in Pima County in 2024 (996 in 5+ unit buildings).
- This rent is only 15% of the median local income ($82k/yr) — well below the 30% rent-burden line; pricing power to push rent on renewal without tenant pushback.
Forward outlook
- Local home prices are declining (-3.0%/yr); year-one equity from $577 of loan paydown is wiped out by about $3k of value loss. Plan a longer hold.
- Pima County population projected at +8% by 2050 — modest demand growth; plan on rents tracking national, not racing it.
Negotiation context
- It's been on market 110 days — a 9% lower offer ($76k) is reasonable based on typical stale-listing flexibility.
Risks & watch-outs
- Watch-outs: HOA is 29% of rent.
- Climate carrying-cost: extreme-heat days projected 7→20/yr by 2055 (HVAC capex compounding) — expect insurance premiums to compound above CPI over the hold.
Questions for the listing agent
- What do current leases actually rent for vs. the listed asking? Can we see a recent rent roll and the last 12 months of T-12 income?
- It's been on market 110 days. Have you received any prior offers? Is the seller open to a 9% concession, seller financing, or rate buy-down credit?
- Built in 1972 — when were the roof, HVAC, electrical panel, plumbing, and water heater last replaced?
- What does the HOA fee cover, when was the last increase, and are there any pending special assessments or reserve-fund shortfalls?
- Any open or pending special assessments — roof, HVAC, plumbing, elevator, façade? What's the per-unit balance and payoff schedule, and is the seller paying it off at close or rolling it to the buyer?
- Why hasn't it sold? Are there any deal-killer items the seller is aware of (foundation, flood, title, zoning, code violations)?
- Is there a deadline driving the sale (1031 exchange, divorce, estate, relocation)? That informs how much negotiation room exists.
- The area grade is low — what's the realistic commute time and amenity access for the typical tenant pool here? Any planned neighborhood developments (good or bad) we should know about?
- What's the average days-on-market for RENTAL listings here right now (not sales)? A rising rental-DOM trend means longer vacancies and softer asking-rent achievability than the comps imply.
- What's the recent tenant-quality profile in this submarket — average credit score on applications, eviction rate, late-payment / NSF rate, and stable-employment percentage? A property-management company in the area should have these aggregated.
- How much new apartment / multifamily construction is in the pipeline within 1–3 miles? Heavy new supply (>2% of stock underway) typically softens rents 12–24 months out; light construction supports rent growth.
Investment metrics
- 1% rule
- 1.25% ✓
- Cap rate
- 5.45%
- Cash-on-cash
- -3.02%
- DSCR
- 0.87
- GRM
- 6.7
CMA / ARV
- ARV (median comp)
- $108,299
- List price
- $83,500
- Delta
- -22.90%
- Verdict
- UNDERPRICED
- Comps
- 20 within 1.0 mi
Projected returns pro-forma
-3.0% appreciation · 1.83% rent growth · sell at horizon
- IRR
- -23.1%
- Equity multiple
- 0.22×
- Total profit
- $-18,280
- Equity at exit
- $12,450
- IRR
- -22.3%
- Equity multiple
- -0.06×
- Total profit
- $-24,765
- Equity at exit
- $7,220
Cash invested: $23,380 (down + closing). Projections, not guarantees.
Landlord ↔ Tenant lean methodology
- Overall (STATE)
- 87 Strongly Landlord-Friendly
- State Arizona
- 87 Strongly Landlord-Friendly · R+3
- County
- — inherits STATE
- City
- — inherits STATE
ZIP-level market 85704
- Rents YoY
- 1.8%
- Active inventory
- 164
- Price-to-rent
- 6.7×
Monthly cashflow live
- Estimated rent
- $1,040 high interval (Pro) →
- Mortgage (P&I)
- −$438
- Tax est. 1.5%
- −$104 /mo · $1,252/yr
- Insurance
- −$35
- HOA est. from 3 same-building comps
- −$303
- Vacancy / Maint / Mgmt
- −$218
- Net cashflow
- $-59
Break-even live
UW: 25.0% down · 7.5% · 30yr · 1.5% tax · 5.0% vac · 8.0% maint · 8.0% mgmt
Financing live
Cash to close
- Down payment
- $20,875
- Closing costs
- $2,505
- Reserves months
- —
- Total cash needed
- —
Loan-product check · same deal, 3 products live
Conventional
25% down · 7.5% · 30yr
- Down + closing
- —
- Monthly P&I
- —
- Monthly cashflow
- —
- DSCR
- —
- Eligible?
- —
Personal DTI + credit; lowest rate.
DSCR
20% down · 8.5% · 30yr
- Down + closing
- —
- Monthly P&I
- —
- Monthly cashflow
- —
- DSCR
- —
- Eligible?
- —
No personal income docs; deal must DSCR.
Hard money
10% down · 12.0% · 12mo
- Down + closing
- —
- Monthly P&I
- —
- Monthly cashflow
- —
- DSCR
- —
- Eligible?
- —
Short-term bridge; refi at stabilization.
Rent comps 12 comps
| Address | Beds | Baths | Sqft | Rent | $/sqft | DOM | Units | Dist |
|---|---|---|---|---|---|---|---|---|
| 6332 N Barcelona Ln Tucson, AZ | 1.0 | 1.0 | 672 | $849 | $1.26 | 2d | 1 | 0.10mi |
| 444 W Orange Grove Rd Tucson, AZ | 1.0–2.0 | 1.0–2.0 | 641 | $939 | $1.46 | 2d | 15 | 0.13mi |
| 6341 N Barcelona Ct #809 Tucson, AZ | 1.0 | 1.0 | 672 | $899 | $1.34 | 23d | 1 | 0.16mi |
| 6351 N Barcelona Ct Tucson, AZ | 1.0 | 1.0 | 672 | $1,000 | $1.49 | 23d | 1 | 0.17mi |
| 6301 N Barcelona Ct #1010 Tucson, AZ | 1.0 | 1.0 | 672 | $899 | $1.34 | 43d | 1 | 0.18mi |
| 750 W Orange Grove Rd Tucson, AZ | 1.0–3.0 | 1.0–2.0 | 983 | $1,450 | $1.47 | 1d | 15 | 0.22mi |
| 6200 N Oracle Rd Tucson, AZ | 2.0 | 1.0–2.0 | 705 | $1,174 | $1.67 | 11d | 22 | 0.40mi |
| 513 W Panorama Rd Tucson, AZ | 1.0–2.0 | 1.0 | 600 | $853 | $1.42 | 3d | 6 | 0.45mi |
| 5921 N Oracle Rd Tucson, AZ | 1.0–3.0 | 1.0–2.0 | 896 | $1,199 | $1.34 | 3d | 16 | 0.54mi |
| 75 E Rudasill Rd Tucson, AZ | 1.0 | 1.0 | 533 | $1,250 | $2.35 | 43d | 1 | 0.60mi |
| 7040 N Montecatina Dr Unit 1 Tucson, AZ | 1.0 | 1.0 | 700 | $1,900 | $2.71 | 17d | 1 | 1.07mi |
| 7040 N Montecatina Dr Tucson, AZ | 1.0 | 1.0 | 700 | $2,000 | $2.86 | 17d | 1 | 1.07mi |
HOA detail condo
- Monthly dues
- $0 · $0/yr
- Likely covers
- watersewertrashgasexterior maint.pool
- Assessments
- None detected in remarks — confirm with the listing agent.
Listing history 16 events
-
2026-06-18days on market $83,500 Active 110 DOM
-
2026-06-17days on market $83,500 Active 109 DOM
-
2026-06-16days on market $83,500 Active 108 DOM
-
2026-06-15days on market $83,500 Active 107 DOM
-
2026-06-13days on market $83,500 Active 105 DOM
-
2026-06-10days on market $83,500 Active 102 DOM
-
2026-06-09days on market $83,500 Active 101 DOM
-
2026-06-08days on market $83,500 Active 100 DOM
-
2026-06-07days on market $83,500 Active 99 DOM
-
2026-06-05pricedays on market $83,500 Active 96 DOM
-
2026-06-03days on market $87,500 Active 95 DOM
-
2026-06-02days on market $87,500 Active 94 DOM
-
2026-06-01days on market $87,500 Active 93 DOM
-
2026-05-31days on market $87,500 Active 92 DOM
-
2026-04-09price $87,500 728-char remark
Show marketing remark (728 chars)
Prime North Tucson investment or perfect home! This 1 bed, 1 bath condo in Barcelona Manor offers unbeatable convenience near U of A, downtown, & I-10. The spacious 672 square feet layout features a large bedroom, a generous walk in closet, and a private balcony, a perfect canvas ready for your personal updates. Enjoy resort style living as the HOA fee covers gas, water, trash, sewer, exterior maintenance, 2 refreshing pools, & a clubhouse. With rentals allowed, this is a fantastic income property. Embrace a true lock-and-leave lifestyle with shopping, dining, & the Rillito Bike Path nearby. Don't miss this chance for affordable ownership in a desirable community with fantastic amenities and mountain views!
-
2026-02-28$90,000 Active 728-char remark
Show marketing remark (728 chars)
Prime North Tucson investment or perfect home! This 1 bed, 1 bath condo in Barcelona Manor offers unbeatable convenience near U of A, downtown, & I-10. The spacious 672 square feet layout features a large bedroom, a generous walk in closet, and a private balcony, a perfect canvas ready for your personal updates. Enjoy resort style living as the HOA fee covers gas, water, trash, sewer, exterior maintenance, 2 refreshing pools, & a clubhouse. With rentals allowed, this is a fantastic income property. Embrace a true lock-and-leave lifestyle with shopping, dining, & the Rillito Bike Path nearby. Don't miss this chance for affordable ownership in a desirable community with fantastic amenities and mountain views!
ⓘ Source: listings_history table (triggers on properties + properties_extension) + one-shot
backfill from property_details.listing_events for pre-trigger history.
Climate risk First Street
- Flood 1/10 Low FEMA zone X (unshaded) · 0% chance over 30 yrs
- Wildfire 3/10 Moderate
- Heat 8/10 Severe 7 d/yr ≥106°F today · 20 d/yr by 30 yrs out
- Wind 1/10 Low
- Air quality 1/10 Low 0 unhealthy d/yr today · 0 by 30 yrs out
Nearby sold comps map
Loading sold comps map…
Walkable amenities ~0.75 mi
Loading nearby amenities…
Taxation est. · year 1
- Rental income
- $12,475
- − Mortgage interest
- −$4,677
- − Property taxes
- −$1,252
- − Insurance
- −$418
- − Repairs & maintenance
- −$998
- − Management
- −$998
- − HOA
- −$3,636
- − Depreciation
- −$2,429
- Taxable loss
- −$1,933
- Est. tax savings @ 24.0%
- +$464
- After-tax cash flow
- $-241/yr
For passive investors: Depreciation is non-cash, so a rental often shows a tax loss while cash-flowing — sheltering income. Rental losses are passive: they offset passive income freely, and up to $25,000/yr can offset ordinary (W-2) income if you actively participate and your MAGI is under $100k (phasing out to $0 by $150k); unused losses carry forward. On sale, claimed depreciation is recaptured at up to 25%, and gains may owe capital-gains tax (a 1031 exchange can defer both). Figures are a year-1 estimate at your 24.0% rate — not tax advice; consult a CPA.
Condition & rehab AI · 12 photos
This 1-bedroom, 1-bath condo is in good condition with minor repairs needed in the kitchen and some maintenance required. It offers a great investment opportunity with potential for significant value increase through updates.
Repairs flagged
- Minor Kitchen cabinets — Worn appearance
- Minor Kitchen countertops — Need cleaning
Value-add opportunities
- Both Paint interior walls — Fresh paint enhances curb appeal and interior
- Both Replace worn kitchen cabinets — New cabinets improve functionality and aesthetics
- Both Replace worn kitchen countertops — New countertops improve functionality and aesthetics
- Both Landscaping — Fresh landscaping enhances curb appeal and property value
Renovation cost estimate screening
| Repair item | Severity | Est. cost |
|---|---|---|
| Kitchen cabinets · Worn appearance | Minor | $500–3,000 |
| Kitchen countertops · Need cleaning | Minor | $500–3,000 |
| Total estimated repair cost · 2 items | $1,000–6,000 |
Value-add ROI direction
- Both Paint interior walls — Fresh paint enhances curb appeal and interior ↑
- Both Replace worn kitchen cabinets — New cabinets improve functionality and aesthetics ↑
- Both Replace worn kitchen countertops — New countertops improve functionality and aesthetics ↑
- Both Landscaping — Fresh landscaping enhances curb appeal and property value ↑
ⓘ Cost ranges are severity-bucket heuristics (US national rule-of-thumb). Get contractor quotes + a written scope before underwriting a rehab budget.
Schools (NCES district)
- District
- Amphitheater Unified District (4406)
- NCES district ID
- 0400680
- Math proficiency
- 32% ▼ -13.00%
- Reading proficiency
- 40% ▼ -8.00%
- Median HH income
- $46,524
- Composite
- 30.82/100
- National rank
- #6135
- State rank
- #85 of 249 in AZ
Livability — Casas Adobes
- Score
- 79/100
- State rank
- #8
- US rank
- #2353
Category grades
Schools grade is shown separately in the Schools card above.
Census & demographics
- Census place
- Casas Adobes, AZ
- County
- Pima County · 1,012,107 people
- City population
- 67,940
- Metro
- Tucson, AZ
- Population (ZIP)
- 35,210
- Household income
- $81,696
- Rent vs Own
- Severe rent burden
- 1359.0
Population outlook (Pima County) Hauer SSP2
- Today (2025)
- 1,066,056 people
- By 2030
- 1,086,684 · +1.9%
- By 2040
- 1,117,160 · +4.8%
- By 2050
- 1,149,778 · +7.9%
- By 2075
- 1,271,480 · +19.3%
- By 2100
- 1,321,160 · +23.9%
Race, ethnicity, and origin ACS 2023
- Neighborhood character
- Predominantly White (73%)
- Race & ethnicity
- White 73% Hispanic / Latino 17% Two or more races 11% Asian 4%
- Hispanic origin (detail)
- Mexican 14%
- Common ancestry
- Lithuanian 3% Romanian 3% Iranian 3%
- Foreign-born
- 9% · Canada, South Korea, China
- Languages at home
- 86% English-only · Spanish 9% Other Asian/Pacific 1% Other Indo-European 1%
Political lean MEDSL · Pima
- 2024 margin
- D (+15.2) · D 57.0% · R 41.8% · Other 1.2%
- 2008→2024 swing
- +9.1pp toward D · 2008: 6.1pp · 2024: 15.2pp
- All cycles
- 2024: D+15.2 2020: D+18.7 2016: D+13.5 2012: D+5.8 2008: D+6.1
Not yet ingested
- Civics
- —
Market trends
- HPI YoY
- ▼ -361.61%
- Current HPI
- 300.8235
- Rent YoY
- ▲ 1.83%
- Metro
- Tucson, AZ
- State GDP YoY
- ▲ 4.54%
- F500 in state
- 20
Industry mix (Fortune 500 HQ in AZ)
| Industry | F500 HQs | Revenue |
|---|---|---|
| Technology | 2 | $13B |
|
||
| Mining / Metals | 1 | $23B |
|
||
| Environmental Services | 1 | $16B |
|
||
| Metals / Steel | 1 | $14B |
|
||
| Technology Distribution | 1 | $9B |
|
||
| Homebuilding | 1 | $8B |
|
||
Price history
-2.8% since first listed2 events — show timeline
- 2026-04-09 Price Changed $87,500 MLSSAZ
- 2026-02-28 Listed $90,000 MLSSAZ
Cash-flow waterfall
monthlySold comps — $/sqft
last 12 mo · ≤1 miLoading sold comps…