 🏗️ New Construction
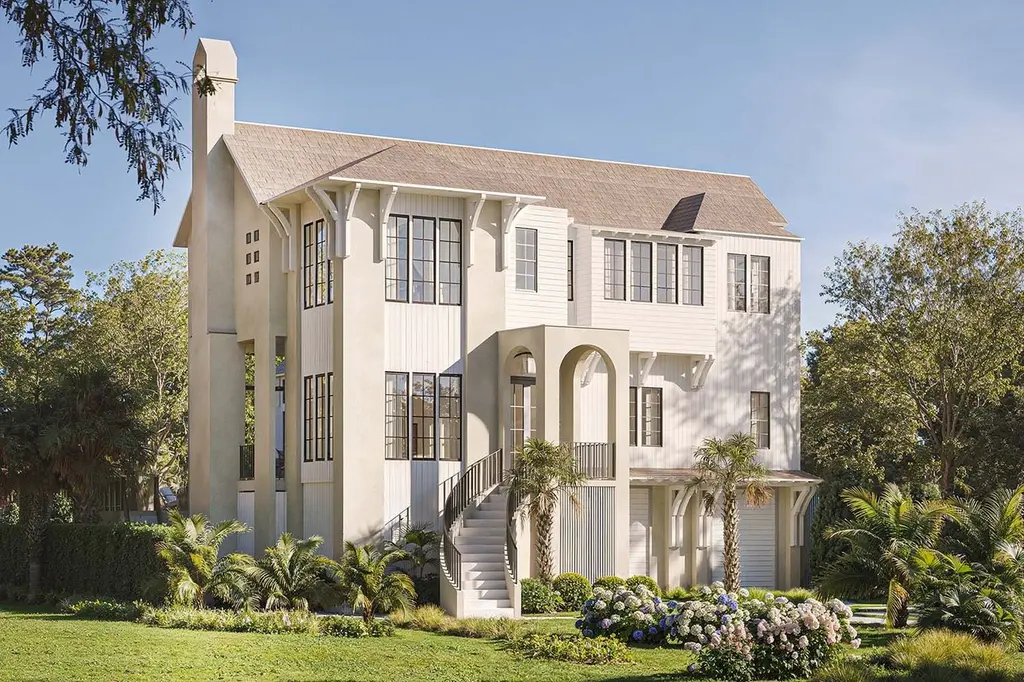
Sweetgrass Plan · Kiawah Island, SC
Flood risk No data
- FEMA flood zone
- —
- Chance of flooding over 30 yrs
- —
- Est. flood insurance / yr
- —
Fire risk No data
- Est. fire insurance / yr
- —
Heat risk No data
- Hot days now (above threshold)
- —
- Hot days in 30 yrs
- —
Wind risk No data
- Chance of severe wind over 30 yrs
- —
Air-quality risk No data
- Unhealthy air days now
- —
- Unhealthy air days in 30 yrs
- —
Risk factors via First Street. Map © Google.
Why this score? — see what drove the F grade
The composite is a weighted blend of 9 inputs, each scored 0–100. Each bar is that input's sub-score; the figure is the points it added to the 100-point composite (weight × sub-score).
- ARV discount +7.5/15.0
- Schools +4.3/10.0
- Rent growth +3.2/5.0
- Livability +3.2/5.0
- Condition / age +2.5/5.0
- Cash flow +0.0/30.0
- 1% rule +0.0/10.0
- DSCR +0.0/10.0
- Appreciation +0.0/10.0
$1
🖨 Deal sheet 📄 Offer letter ✓ Due diligence
Listing remarks
Rooted in modern coastal design, this architecturally striking residence blends sculptural form with refined livability, creating a home where artful design and everyday comfort exist in balance. A sweeping curved staircase makes an unforgettable first impression, introducing the soft geometry and thoughtful detailing carried throughout the interior. Designed to maximize light and openness, the great room features soaring fourteen-foot ceilings and expansive windows that fill the home with natural light. At the center of the living spaces, a sculpted kitchen island mirrors the home's curved architectural elements, anchoring an open layout that flows seamlessly between the kitchen, dining ar
Key facts
- Curved staircase
- Great room
- Elevated rear deck
Tags
Property features AI
Finance
- Financial info: List price available (contact listing agent for details)
Exterior
- Home design: New construction plan (Sweetgrass)
- Exterior features: Located at 2501 Mullet Hall Dr, Johns Island, SC 29455; Living area approximately 4,185
Interior
- Bedrooms: 5 bedrooms
- Bathrooms: 5 bathrooms
- Interior features: Plan named Sweetgrass; Active new-construction plan
Neighborhood map
What this means for you Summary
Snapshot
- This is a 5-bed/5.0-bath single-family listed at $1.
Deal economics
- At list price, monthly cash flow is $-18k ($-222k/yr) — negative.
- The deal already cash-flows at list — no discount required.
- Meets the 1% rule at list price ($3k rent vs $1).
- Cap rate -1.0% vs local median 0.0% in Kiawah Island — below-typical yield; the buyer is paying a premium for something (appreciation thesis, condition, location) that the cap rate doesn't capture.
Location & tenants
- Location reads 64/100 on livability (#154 in SC) — a middle-class / working-renter tenant base. Strengths: crime A+, employment A+; Watch: housing C-, amenities F, commute F.
- Charleston 01 (urban): math 48% / reading 53% proficiency, ranked #7 of 80 in SC (top 9%) — acceptable for families but not a draw, mixed tenant base, ~2y average lease.
- Market conditions: Rents rising (+3.0%/yr); 568 active listings in the ZIP; high-income renter base; 4,156 units permitted in Charleston County in 2024 (857 in 5+ unit buildings).
- This rent runs 32% of the median local income ($121k/yr) — at the standard rent-burdened threshold; future hikes will face affordability resistance.
Forward outlook
- Local home prices are declining (-3.0%/yr); year-one equity from $21k of loan paydown is wiped out by about $92k of value loss. Plan a longer hold.
- Charleston County population projected at +44% by 2050 — long-run rental-demand tailwind backs the buy-and-hold thesis.
Negotiation context
- It's been on market 29 days — a 2% lower offer ($0) is reasonable based on typical stale-listing flexibility.
Risks & watch-outs
- Watch-outs: property tax is 4576297.5% of price.
Questions for the listing agent
- What do current leases actually rent for vs. the listed asking? Can we see a recent rent roll and the last 12 months of T-12 income?
- Property tax is high relative to price — has the assessment been appealed recently, and will the sale trigger a re-assessment?
- Is there a deadline driving the sale (1031 exchange, divorce, estate, relocation)? That informs how much negotiation room exists.
- The area grade is low — what's the realistic commute time and amenity access for the typical tenant pool here? Any planned neighborhood developments (good or bad) we should know about?
- What's the average days-on-market for RENTAL listings here right now (not sales)? A rising rental-DOM trend means longer vacancies and softer asking-rent achievability than the comps imply.
- What's the recent tenant-quality profile in this submarket — average credit score on applications, eviction rate, late-payment / NSF rate, and stable-employment percentage? A property-management company in the area should have these aggregated.
- How much new for-sale + rental construction is in the pipeline within 1–3 miles? Heavy new supply typically softens prices + rents 12–24 months out; constrained supply supports both.
Investment metrics
- 1% rule
- 0.11% ✗
- Cap rate
- -0.98%
- Cash-on-cash
- -25.97%
- DSCR
- -0.16
- GRM
- 77.4
CMA / ARV
- ARV (on-the-fly)
- $3,050,865
- Comps found
- 3
Show comp detail 3 sales within ~0.75 mi
| Address | Dist | Beds/Ba | Sqft | Sold | Price | $/sf | Match |
|---|---|---|---|---|---|---|---|
| 3008 Eventide Dr | 0.31mi | 5/4.5 | 3,900 (-7%) | 18mo | $5,399,000 | $1,384 | 58 |
| 5761 Kiawah River Dr | 0.42mi | 5/5.5 | 3,669 (-12%) | 19mo | $1,950,000 | $531 | 42 |
| 4054 Drift Ln | 0.44mi | 4/4.5 (-1) | 3,633 (-13%) | 15mo | $2,650,000 | $729 | 38 |
Match score weights: distance 35% · size 25% · config 20% · recency 20%. Top-matched comps best support the ARV.
Projected returns pro-forma
-3.0% appreciation · 2.95% rent growth · sell at horizon
- IRR
- -75.4%
- Equity multiple
- -0.96×
- Total profit
- $-1,672,040
- Equity at exit
- $454,894
- IRR
- —
- Equity multiple
- -2.48×
- Total profit
- $-2,972,747
- Equity at exit
- $263,783
Cash invested: $854,242 (down + closing). Projections, not guarantees.
Landlord ↔ Tenant lean methodology
- Overall (STATE)
- 90 Strongly Landlord-Friendly
- State South Carolina
- 90 Strongly Landlord-Friendly · R+6
- County
- — inherits STATE
- City
- — inherits STATE
ZIP-level market 29455
- Rents YoY
- 3.0%
- Active inventory
- 568
Monthly cashflow live
- Estimated rent
- $3,285 medium interval (Pro) →
- Mortgage (P&I)
- −$15,999
- Tax est. 1.5%
- −$3,814 /mo · $45,763/yr
- Insurance
- −$1,271
- HOA
- −$0
- Vacancy / Maint / Mgmt
- −$690
- Net cashflow
- $-18,489
Break-even live
UW: 25.0% down · 7.5% · 30yr · 1.5% tax · 5.0% vac · 8.0% maint · 8.0% mgmt
Financing live
Cash to close
- Down payment
- $762,716
- Closing costs
- $91,526
- Reserves months
- —
- Total cash needed
- —
Loan-product check · same deal, 3 products live
Conventional
25% down · 7.5% · 30yr
- Down + closing
- —
- Monthly P&I
- —
- Monthly cashflow
- —
- DSCR
- —
- Eligible?
- —
Personal DTI + credit; lowest rate.
DSCR
20% down · 8.5% · 30yr
- Down + closing
- —
- Monthly P&I
- —
- Monthly cashflow
- —
- DSCR
- —
- Eligible?
- —
No personal income docs; deal must DSCR.
Hard money
10% down · 12.0% · 12mo
- Down + closing
- —
- Monthly P&I
- —
- Monthly cashflow
- —
- DSCR
- —
- Eligible?
- —
Short-term bridge; refi at stabilization.
Listing history 12 events
-
2026-06-18days on market $1 Active 29 DOM
-
2026-06-17days on market $1 Active 28 DOM
-
2026-06-16days on market $1 Active 27 DOM
-
2026-06-15days on market $1 Active 26 DOM
-
2026-06-10days on market $1 Active 21 DOM
-
2026-06-09days on market $1 Active 20 DOM
-
2026-06-08days on market $1 Active 19 DOM
-
2026-06-07days on market $1 Active 18 DOM
-
2026-06-05days on market $1 Active 15 DOM
-
2026-06-03days on market $1 Active 14 DOM
-
2026-06-01days on market $1 Active 12 DOM
-
2026-05-31days on market $1 Active 11 DOM
ⓘ Source: listings_history table (triggers on properties + properties_extension) + one-shot
backfill from property_details.listing_events for pre-trigger history.
Nearby sold comps map
Loading sold comps map…
Walkable amenities ~0.75 mi
Loading nearby amenities…
Taxation est. · year 1
- Rental income
- $39,420
- − Mortgage interest
- −$170,896
- − Property taxes
- −$45,763
- − Insurance
- −$15,254
- − Repairs & maintenance
- −$3,154
- − Management
- −$3,154
- − Depreciation
- −$88,752
- Taxable loss
- −$287,553
- Est. tax savings @ 24.0%
- +$69,013
- After-tax cash flow
- $-152,852/yr
For passive investors: Depreciation is non-cash, so a rental often shows a tax loss while cash-flowing — sheltering income. Rental losses are passive: they offset passive income freely, and up to $25,000/yr can offset ordinary (W-2) income if you actively participate and your MAGI is under $100k (phasing out to $0 by $150k); unused losses carry forward. On sale, claimed depreciation is recaptured at up to 25%, and gains may owe capital-gains tax (a 1031 exchange can defer both). Figures are a year-1 estimate at your 24.0% rate — not tax advice; consult a CPA.
Schools (NCES district)
- District
- Charleston 01
- NCES district ID
- 4501440
- Math proficiency
- 48% ▼ -2.00%
- Reading proficiency
- 53% ▬ 0.00%
- Median HH income
- $52,376
- Composite
- 43.41/100
- National rank
- #3018
- State rank
- #7 of 80 in SC
Livability — Kiawah Island
- Score
- 64/100
- State rank
- #154
- US rank
- #14517
Category grades
Schools grade is shown separately in the Schools card above.
Census & demographics
- County
- Charleston County · 366,793 people
- Metro
- Charleston-North Charleston, SC
- Population (ZIP)
- 27,576
- Household income
- $121,372
- Rent vs Own
- Severe rent burden
- 304.0
Population outlook (Charleston County) Hauer SSP2
- Today (2025)
- 480,562 people
- By 2030
- 525,921 · +9.4%
- By 2040
- 612,189 · +27.4%
- By 2050
- 691,627 · +43.9%
- By 2075
- 847,979 · +76.5%
- By 2100
- 926,482 · +92.8%
Race, ethnicity, and origin ACS 2023
- Neighborhood character
- Predominantly White (75%)
- Race & ethnicity
- White 75% Black 11% Hispanic / Latino 8% Two or more races 6% Native American 3%
- Hispanic origin (detail)
- Mexican 4%
- Common ancestry
- Lithuanian 5% Romanian 4% Slovak 3%
- Foreign-born
- 5% · Canada, Dominican Republic
- Languages at home
- 92% English-only · Spanish 6%
Political lean MEDSL · Charleston
- 2024 margin
- Lean D (+5.7) · D 51.9% · R 46.3% · Other 1.8%
- 2008→2024 swing
- -2.7pp toward R · 2008: 8.3pp · 2024: 5.7pp
- All cycles
- 2024: D+5.7 2020: D+12.9 2016: D+7.9 2012: D+2.4 2008: D+8.3
Not yet ingested
- Civics
- —
Market trends
- HPI YoY
- ▼ -223.02%
- Current HPI
- 297.7408
- Rent YoY
- ▲ 2.95%
- Metro
- Charleston-North Charleston, SC
- State GDP YoY
- ▲ 4.51%
- F500 in state
- 2
Industry mix (Fortune 500 HQ in SC)
| Industry | F500 HQs | Revenue |
|---|---|---|
| Packaging | 1 | $7B |
|
||
Cash-flow waterfall
monthlySold comps — $/sqft
last 12 mo · ≤1 miLoading sold comps…