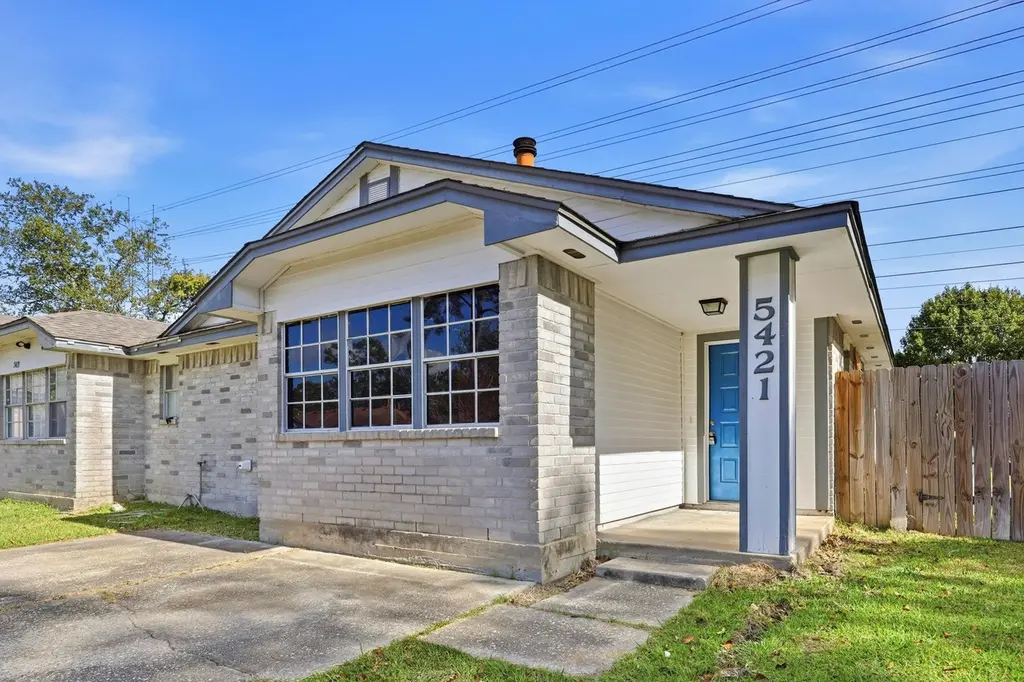
5421 Diane Ct · Spring, TX
Flood risk 1/10 · Minimal
- FEMA flood zone
- X (unshaded)
- Chance of flooding over 30 yrs
- 0.0%
- Est. flood insurance / yr
- $507 – $1,088
Fire risk 1/10 · Minimal
- Est. fire insurance / yr
- $1,222 – $2,270
Heat risk 9/10 · Severe
- Hot days now (above 111°F)
- 7 days/yr
- Hot days in 30 yrs
- 25 days/yr
Wind risk 8/10 · Major
- Chance of severe wind over 30 yrs
- 99.0%
Air-quality risk 3/10 · Minor
- Unhealthy air days now
- 3 days/yr
- Unhealthy air days in 30 yrs
- 3 days/yr
Risk factors via First Street. Map © Google.
Why this score? — see what drove the C+ grade
The composite is a weighted blend of 9 inputs, each scored 0–100. Each bar is that input's sub-score; the figure is the points it added to the 100-point composite (weight × sub-score).
- Cash flow +26.5/30.0
- DSCR +9.0/10.0
- 1% rule +8.2/10.0
- ARV discount +7.5/15.0
- Livability +3.3/5.0
- Condition / age +2.5/5.0
- Rent growth +2.4/5.0
- Schools +2.0/10.0
- Appreciation +0.0/10.0
$167,900
🖨 Deal sheet 📄 Offer letter ✓ Due diligence
Listing remarks
Recently dropped from price from 180k . Fully updated 3 bed, 2 bath home with 1,300+ sqft of comfortable living space! This all property features major upgrades already done for you including a newer roof, Newer HVAC and ducting, as well as modern LVP flooring throughout most of the home. Enjoy a functional layout with a cozy wood-burning fireplace, beautiful kitchen with new dishwasher, and a sliding glass door that brings in great natural light. Step outside to a private fenced yard, perfect for relaxing or entertaining. Located in a well-established neighborhood with HOA, this home is move-in ready and built for low-maintenance living. Survey on file. Solid value + big-ticket updates alr
Key facts
- Newer roof
- Private fenced yard
- Modern lvp flooring
Tags
Property features AI
Finance
- Financial info: Lease considered
- HOA & community: Sunbury Estates homeowners association; Annual association fee of $220
Exterior
- Utilities: Public water; Public sewer
- Home design: Residential property; One-story (entry level: first floor)
- Construction: Built in 1984; Brick and wood siding exterior; Slab foundation; Composition, shingle, and wood roof
- Exterior features: Cleared lot; Located on a cul-de-sac
Interior
- Kitchen: Dishwasher
- Bedrooms: Primary bedroom on the first floor (15 x 10); Bedroom on the first floor (12 x 15); Bedroom on the first floor (10 x 10)
- Flooring: Plank; Tile; Vinyl
- Bathrooms: 2 full bathrooms
- Heating & cooling: Central heating (electric); Central air conditioning (electric)
- Interior features: Wood-burning fireplace (1); Plank, tile, and vinyl flooring; 5 total rooms
Neighborhood map
What this means for you Summary
Snapshot
- This is a 3-bed/2.0-bath townhouse listed at $168k.
Deal economics
- At list price, monthly cash flow is $443 ($5k/yr) — positive.
- The deal already cash-flows at list — no discount required.
- Meets the 1% rule at list price ($2k rent vs $168k).
- Cap rate 9.5% vs local median 4.5% in Spring — top-decile yield for the area; either an underpriced asset or a hidden risk that comps aren't pricing in. Stress-test before assuming the spread holds.
Location & tenants
- Location reads 66/100 on livability (#635 in TX) — a middle-class / working-renter tenant base. Strengths: cost of living A+, housing A+, employment B; Watch: crime D, amenities F, commute F.
- Spring ISD (suburban): math 19% / reading 26% proficiency, ranked #730 of 826 in TX (top 88%) — low school quality limits family demand, transient renter base, plan for 1-2y turnover; 66% free/reduced lunch — lower-income household profile, screen leases tightly.
- Zoned schools: Dueitt Middle (math 12% / reading 23%, grade F, #1,507 of 1,662 statewide, top 91%, 773 students, 84% FRL); Spring H S (math 12% / reading 21%, grade F, #1,497 of 1,632 statewide, top 92%, 2,760 students, 72% FRL).
- Market conditions: Rents soft (-0.3%/yr); 595 active listings in the ZIP; solid renter incomes; 29,883 units permitted in Harris County in 2024 (8,621 in 5+ unit buildings).
- This rent runs 30% of the median local income ($89k/yr) — at the standard rent-burdened threshold; future hikes will face affordability resistance.
Forward outlook
- Local home prices are declining (-3.0%/yr); year-one equity from $1k of loan paydown is wiped out by about $5k of value loss. Plan a longer hold.
- Harris County population projected at +47% by 2050 — long-run rental-demand tailwind backs the buy-and-hold thesis.
Negotiation context
- Only 7 days on market — expect competitive offers; lowballing is unlikely to land.
- 6 sale attempts since 4y ago; this cycle's ask has dropped $14k (8%) from the opening price — seller is motivated, your offer sets the floor, not the list.
Risks & watch-outs
- Climate carrying-cost: severe wind risk, 99% chance of damaging wind over 30y; extreme-heat days projected 7→25/yr by 2055 (HVAC capex compounding) — expect insurance premiums to compound above CPI over the hold.
Questions for the listing agent
- What does the HOA fee cover, when was the last increase, and are there any pending special assessments or reserve-fund shortfalls?
- Is there a deadline driving the sale (1031 exchange, divorce, estate, relocation)? That informs how much negotiation room exists.
- Crime grade is D in this area — have there been break-ins, vandalism, or insurance claims at this property in the last 3 years? What carrier currently insures it and at what premium?
- What's the average days-on-market for RENTAL listings here right now (not sales)? A rising rental-DOM trend means longer vacancies and softer asking-rent achievability than the comps imply.
- What's the recent tenant-quality profile in this submarket — average credit score on applications, eviction rate, late-payment / NSF rate, and stable-employment percentage? A property-management company in the area should have these aggregated.
- How much new for-sale + rental construction is in the pipeline within 1–3 miles? Heavy new supply typically softens prices + rents 12–24 months out; constrained supply supports both.
Investment metrics
- 1% rule
- 1.32% ✓
- Cap rate
- 9.46%
- Cash-on-cash
- 11.31%
- DSCR
- 1.50
- GRM
- 6.3
CMA / ARV
No comps found within radius.
Projected returns pro-forma
-3.0% appreciation · 0.0% rent growth · sell at horizon
- IRR
- -3.2%
- Equity multiple
- 0.89×
- Total profit
- $-5,375
- Equity at exit
- $25,034
- IRR
- 2.4%
- Equity multiple
- 1.15×
- Total profit
- $7,018
- Equity at exit
- $14,517
Cash invested: $47,012 (down + closing). Projections, not guarantees.
Landlord ↔ Tenant lean methodology
- Overall (STATE)
- 87 Strongly Landlord-Friendly
- State Texas
- 87 Strongly Landlord-Friendly · R+5
- County
- — inherits STATE
- City
- — inherits STATE
ZIP-level market 77373
- Rents YoY
- -0.3%
- Active inventory
- 595
- Price-to-rent
- 6.3×
Monthly cashflow live
- Estimated rent
- $2,220 medium interval (Pro) →
- Mortgage (P&I)
- −$880
- Tax from tax record
- −$342 /mo · $4,107/yr
- Insurance
- −$70
- HOA
- −$18
- Vacancy / Maint / Mgmt
- −$466
- Net cashflow
- $443
Break-even live
UW: 25.0% down · 7.5% · 30yr · 1.5% tax · 5.0% vac · 8.0% maint · 8.0% mgmt
Financing live
Cash to close
- Down payment
- $41,975
- Closing costs
- $5,037
- Reserves months
- —
- Total cash needed
- —
Loan-product check · same deal, 3 products live
Conventional
25% down · 7.5% · 30yr
- Down + closing
- —
- Monthly P&I
- —
- Monthly cashflow
- —
- DSCR
- —
- Eligible?
- —
Personal DTI + credit; lowest rate.
DSCR
20% down · 8.5% · 30yr
- Down + closing
- —
- Monthly P&I
- —
- Monthly cashflow
- —
- DSCR
- —
- Eligible?
- —
No personal income docs; deal must DSCR.
Hard money
10% down · 12.0% · 12mo
- Down + closing
- —
- Monthly P&I
- —
- Monthly cashflow
- —
- DSCR
- —
- Eligible?
- —
Short-term bridge; refi at stabilization.
HOA detail
- Monthly dues
- $18 · $216/yr
Listing history 28 events
-
2026-06-18days on market $167,900 Active 7 DOM
-
2026-06-17days on market $167,900 Active 6 DOM
-
2026-06-16days on market $167,900 Active 5 DOM
-
2026-06-15days on market $167,900 Active 4 DOM
-
2026-06-13days on market $167,900 Active 2 DOM
-
2026-06-13pricedays on market $167,900 Active 1 DOM
-
2026-06-09days on market $169,900 Active 7 DOM
-
2026-06-08days on market $169,900 Active 6 DOM
-
2026-06-07days on market $169,900 Active 5 DOM
-
2026-06-04days on market $169,900 Active 2 DOM
-
2026-06-02days on market $169,900 Active 1 DOM
-
2026-06-01days on market $169,900 Active 28 DOM
-
2026-05-31days on market $169,900 Active 27 DOM
-
2026-05-04$169,900 Active 751-char remark
-
2026-04-30historical
-
2026-03-26price $169,900
-
2026-02-11price $171,555
-
2026-02-06status Active
-
2026-02-06price $181,555
-
2026-01-29historical
-
2026-01-01price $175,555
-
2025-10-10price $179,555
-
2025-09-22$181,900 Active
-
2022-11-23soldstatus Sold
-
2022-10-29status Pending
-
2022-10-19status Option Pending
-
2022-10-09$159,900 Active
-
1992-11-30soldstatus
ⓘ Source: listings_history table (triggers on properties + properties_extension) + one-shot
backfill from property_details.listing_events for pre-trigger history.
Tax reassessment forecast TX · Resets to sale price
- Current annual tax
- $4,107 · $342/mo
- Projected year-2 tax
- $4,107 · $342/mo
- Expected delta
- $0/yr ($0/mo · 0.0%)
ⓘ Screening estimate from a state-policy table — verify with the county assessor before closing.
Climate risk First Street
- Flood 1/10 Low FEMA zone X (unshaded) · 0% chance over 30 yrs
- Wildfire 1/10 Low
- Heat 9/10 Extreme 7 d/yr ≥111°F today · 25 d/yr by 30 yrs out
- Wind 8/10 Severe 99% chance of damaging wind over 30 yrs
- Air quality 3/10 Moderate 3 unhealthy d/yr today · 3 by 30 yrs out
Nearby sold comps map
Loading sold comps map…
Walkable amenities ~0.75 mi
Loading nearby amenities…
Taxation est. · year 1
- Rental income
- $26,637
- − Mortgage interest
- −$9,405
- − Property taxes
- −$4,107
- − Insurance
- −$840
- − Repairs & maintenance
- −$2,131
- − Management
- −$2,131
- − HOA
- −$216
- − Depreciation
- −$4,884
- Taxable income
- $2,924
- Est. tax owed @ 24.0%
- −$702
- After-tax cash flow
- $4,614/yr
For passive investors: Depreciation is non-cash, so a rental often shows a tax loss while cash-flowing — sheltering income. Rental losses are passive: they offset passive income freely, and up to $25,000/yr can offset ordinary (W-2) income if you actively participate and your MAGI is under $100k (phasing out to $0 by $150k); unused losses carry forward. On sale, claimed depreciation is recaptured at up to 25%, and gains may owe capital-gains tax (a 1031 exchange can defer both). Figures are a year-1 estimate at your 24.0% rate — not tax advice; consult a CPA.
Schools (NCES district)
- District
- Spring ISD
- NCES district ID
- 4841220
- Math proficiency
- 19% ▼ -13.00%
- Reading proficiency
- 26% ▼ -6.00%
- Median HH income
- $51,584
- Composite
- 20.12/100
- National rank
- #8643
- State rank
- #730 of 826 in TX
Livability — Spring
- Score
- 66/100
- State rank
- #635
- US rank
- #12101
Category grades
Schools grade is shown separately in the Schools card above.
Census & demographics
- Census place
- Spring, TX
- County
- Harris County · 4,702,590 people
- City population
- 430,529
- Metro
- Houston-The Woodlands-Sugar Land, TX
- Population (ZIP)
- 69,739
- Household income
- $88,617
- Rent vs Own
- Severe rent burden
- 1050.0
Population outlook (Harris County) Hauer SSP2
- Today (2025)
- 5,571,493 people
- By 2030
- 6,089,821 · +9.3%
- By 2040
- 7,142,806 · +28.2%
- By 2050
- 8,185,864 · +46.9%
- By 2075
- 10,574,329 · +89.8%
- By 2100
- 12,109,958 · +117.4%
Race, ethnicity, and origin ACS 2023
- Neighborhood character
- Diverse neighborhood (Simpson 0.69)
- Race & ethnicity
- Hispanic / Latino 40% White 30% Black 23% Two or more races 22% Asian 3%
- Hispanic origin (detail)
- Mexican 27% Puerto Rican 2% Cuban 2% Dominican 2%
- Common ancestry
- Lithuanian 2% Italian 1% Slovak 1%
- Foreign-born
- 17% · Canada, Jamaica, Vietnam
- Languages at home
- 64% English-only · Spanish 32% Vietnamese 1% Other Indo-European 1%
Political lean MEDSL · Harris
- 2024 margin
- Lean D (+5.5) · D 52.0% · R 46.4% · Other 1.6%
- 2008→2024 swing
- +3.9pp toward D · 2008: 1.6pp · 2024: 5.5pp
- All cycles
- 2024: D+5.5 2020: D+13.3 2016: D+12.4 2012: D+0.1 2008: D+1.6
Not yet ingested
- Civics
- —
Market trends
- HPI YoY
- ▼ -142.98%
- Current HPI
- 251.7231
- Rent YoY
- ▼ -0.30%
- Metro
- Houston-The Woodlands-Sugar Land, TX
- State GDP YoY
- ▲ 3.95%
- F500 in state
- 110
Industry mix (Fortune 500 HQ in TX)
| Industry | F500 HQs | Revenue |
|---|---|---|
| Energy | 16 | $1,198B |
|
||
| Technology | 5 | $198B |
|
||
| Engineering / Construction | 4 | $72B |
|
||
| Energy Services | 3 | $60B |
|
||
| Utilities | 3 | $41B |
|
||
| Healthcare | 2 | $330B |
|
||
Price history
+5.0% since first listed20 events — show timeline
- 2026-06-12 Price Changed $167,900 HARMLS
- 2026-06-11 Listed $181,900 HARMLS
- 2026-06-09 Listing Removed — HARMLS
- 2026-06-02 Listing Removed — HARMLS
- 2026-06-02 Listed $169,900 HARMLS
- 2026-05-04 Listed $169,900 HARMLS
- 2026-04-30 Listing Removed — HARMLS
- 2026-03-26 Price Changed $169,900 HARMLS
- 2026-02-11 Price Changed $171,555 HARMLS
- 2026-02-06 Relisted — HARMLS
- 2026-02-06 Price Changed $181,555 HARMLS
- 2026-01-29 Listing Removed — HARMLS
- 2026-01-01 Price Changed $175,555 HARMLS
- 2025-10-10 Price Changed $179,555 HARMLS
- 2025-09-22 Listed $181,900 HARMLS
- 2022-11-23 Sold (MLS) — HARMLS
- 2022-10-29 Pending — HARMLS
- 2022-10-19 Pending — HARMLS
- 2022-10-09 Listed $159,900 HARMLS
- 1992-11-30 Sold (Public Records) — Public Records
Property tax history
+9.1%/yrLatest (2025): $4,107 · +2.2% YoY. Source: county tax records.
Cash-flow waterfall
monthlySold comps — $/sqft
last 12 mo · ≤1 miLoading sold comps…