72 Steuben St Unit 2A · New York, NY
Flood risk 1/10 · Minimal
- FEMA flood zone
- X (unshaded)
- Chance of flooding over 30 yrs
- 0.0%
- Est. flood insurance / yr
- $507 – $1,088
Fire risk 1/10 · Minimal
- Est. fire insurance / yr
- $691 – $1,283
Heat risk 7/10 · Major
- Hot days now (above 99°F)
- 7 days/yr
- Hot days in 30 yrs
- 15 days/yr
Wind risk 6/10 · Moderate
- Chance of severe wind over 30 yrs
- 27.0%
Air-quality risk 4/10 · Minor
- Unhealthy air days now
- 5 days/yr
- Unhealthy air days in 30 yrs
- 7 days/yr
Risk factors via First Street. Map © Google.
Why this score? — see what drove the D- grade
The composite is a weighted blend of 9 inputs, each scored 0–100. Each bar is that input's sub-score; the figure is the points it added to the 100-point composite (weight × sub-score).
- Appreciation +10.0/10.0
- ARV discount +7.5/15.0
- Cash flow +5.0/30.0
- Schools +5.0/10.0
- Rent growth +4.7/5.0
- Livability +3.8/5.0
- Condition / age +2.5/5.0
- 1% rule +1.0/10.0
- DSCR +0.0/10.0
$739,000
🖨 Deal sheet (PDF) 📄 Offer letter ✓ Due diligence
Listing remarks
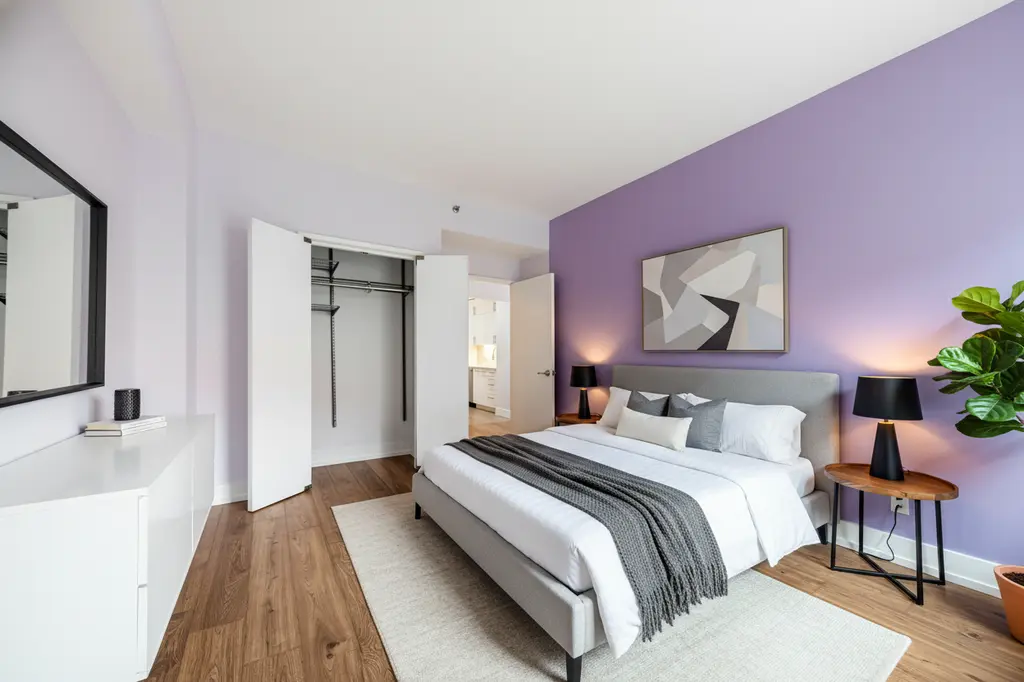
A wonderful home OR investment! Welcome to 72 Steuben Street, a boutique 10-unit elevator condo building on a very quiet block in the heart of vibrant and creative Clinton Hill! This LARGE, sun-filled 1-bedroom condo features a smart, well apportioned layout. The apartment features wide-plank flooring, modern fixtures, and fresh paint throughout. The living area has a coat closet off the entry, an oversized window, and ample space for living / dining considerations. The bedroom has a reach-in closet with built-in ELFA system. A generous bathroom features porcelain tile, a deep soaking tub, towel warmer, and large medicine cabinet. The alcove kitchen kitchen provides ample countertop and
Key facts
- Large rooftop area
- Wide plank flooring
- Deep soaking tub
Tags
Property features AI
Finance
- Financial info: Pets allowed (cats and dogs permitted in building)
- HOA & community: Part of 72 Steuben Condominium; Monthly association fee of $563; Association fee covers common area maintenance, building maintenance, pest control, sewer, snow removal, trash and water
Exterior
- Home design: Entry on level 2; Completed development
- Construction: Concrete construction; 4-story building; Elevator access
- Exterior features: Multi-family use
Interior
- Kitchen: Gas cooktop; Gas oven; Gas range; ENERGY STAR qualified refrigerator; ENERGY STAR qualified freezer; Freezer
- Bedrooms: Total of 3 rooms
- Bathrooms: 1 full bathroom
- Interior features: Unfurnished
- Laundry & utility: In-unit laundry; Washer; Dryer; Stacked washer/dryer
Neighborhood map
What this means for you Summary
Snapshot
- This is a 1-bed/1.0-bath condo listed at $739k.
Deal economics
- At list price, monthly cash flow is $-2k ($-21k/yr) — negative.
- To cash-flow at today's rent, offer at most $430k (41.8% below list).
- To meet the 1% rule (rent ≥ 1% of price), the offer needs to be $446k (39.6% below list).
- Recommended offer: $430k (41.8% below list) — sets the bar for cash-flow.
- Cap rate 3.5% vs local median 2.6% in New York — top-decile yield for the area; either an underpriced asset or a hidden risk that comps aren't pricing in. Stress-test before assuming the spread holds.
Location & tenants
- Location reads 75/100 on livability (#268 in NY, #4,188 nationally) — a middle-class / working-renter tenant base. Strengths: amenities A+, commute A+, health & safety A; Watch: crime F, cost of living F.
- Market conditions: Rents rising fast (+8.6%/yr); 88 active listings in the ZIP; 27 comparable units currently listed for rent nearby; rentals leasing fast (median 6d on market — plan ~1-2 weeks tenant-placement turnaround); solid renter incomes; 10,063 units permitted in Kings County in 2024 (9,789 in 5+ unit buildings).
- At $4,465/mo this rent would consume 57% of the median local household income ($94k/yr) (locally 3544% of renters already pay >50% of income on rent) — very limited rent-growth headroom before tenants either downsize or default.
Forward outlook
- In year one you build about $79k of equity ($5k loan paydown + $74k appreciation (10.0% local appreciation)).
- Kings County population projected at +13% by 2050 — modest demand growth; plan on rents tracking national, not racing it.
- By year 2, paydown + projected appreciation supports a ~$127k cash-out refi (75% LTV) — recoverable capital for the next deal without selling this one.
Negotiation context
- Only 4 days on market — expect competitive offers; lowballing is unlikely to land.
- 4 sale attempts since 12y ago with the ask held roughly flat each time — persistent listings suggest the price (not the market) is what's stuck; bring a comps-based counter.
- Current owner paid $605k; 22% above their basis — modest negotiation headroom, anchor on the comps not their cost.
Risks & watch-outs
- Climate carrying-cost: major wind risk, 27% chance of damaging wind over 30y; extreme-heat days projected 7→15/yr by 2055 (HVAC capex compounding) — expect insurance premiums to compound above CPI over the hold.
Questions for the listing agent
- What do current leases actually rent for vs. the listed asking? Can we see a recent rent roll and the last 12 months of T-12 income?
- What does the HOA fee cover, when was the last increase, and are there any pending special assessments or reserve-fund shortfalls?
- Any open or pending special assessments — roof, HVAC, plumbing, elevator, façade? What's the per-unit balance and payoff schedule, and is the seller paying it off at close or rolling it to the buyer?
- Is there a deadline driving the sale (1031 exchange, divorce, estate, relocation)? That informs how much negotiation room exists.
- Schools are B-rated — typically a magnet for longer-tenancy family renters. What's the average tenant stay here, and is there a school-zone premium baked into asking?
- Crime grade is F in this area — have there been break-ins, vandalism, or insurance claims at this property in the last 3 years? What carrier currently insures it and at what premium?
- The area grade is low — what's the realistic commute time and amenity access for the typical tenant pool here? Any planned neighborhood developments (good or bad) we should know about?
- What's the average days-on-market for RENTAL listings here right now (not sales)? A rising rental-DOM trend means longer vacancies and softer asking-rent achievability than the comps imply.
- What's the recent tenant-quality profile in this submarket — average credit score on applications, eviction rate, late-payment / NSF rate, and stable-employment percentage? A property-management company in the area should have these aggregated.
- How much new apartment / multifamily construction is in the pipeline within 1–3 miles? Heavy new supply (>2% of stock underway) typically softens rents 12–24 months out; light construction supports rent growth.
Investment metrics
- 1% rule
- 0.60% ✗
- Cap rate
- 3.46%
- Cash-on-cash
- -10.13%
- DSCR
- 0.55
- GRM
- 13.8
CMA / ARV
No comps found within radius.
Projected returns pro-forma
10.0% appreciation · 8.0% rent growth · sell at horizon
- IRR
- 18.4%
- Equity multiple
- 2.52×
- Total profit
- $314,981
- Equity at exit
- $665,750
- IRR
- 18.2%
- Equity multiple
- 6.19×
- Total profit
- $1,073,853
- Equity at exit
- $1,435,714
Cash invested: $206,920 (down + closing). Projections, not guarantees.
Landlord ↔ Tenant lean methodology
- Overall (CITY)
- 0 Strongly Tenant-Friendly
- State New York
- 15 Strongly Tenant-Friendly · D+10
- County
- — inherits STATE
- City New York
- 0 Strongly Tenant-Friendly · D+34
ZIP-level market 11205
- Home prices YoY
- 2.1%
- Rents YoY
- 8.6%
- Active inventory
- 88
- Price-to-rent
- 13.8×
Monthly cashflow live
- Estimated rent
- $4,465 high interval (Pro) →
- Mortgage (P&I)
- −$3,875
- Tax from tax record
- −$528 /mo · $6,331/yr
- Insurance
- −$308
- HOA
- −$563
- Vacancy / Maint / Mgmt
- −$938
- Net cashflow
- $-1,747
Break-even live
Sensitivity live
| Price | -10% $-1,329 | -5% $-1,538 | +0% $-1,747 | +5% $-1,956 | +10% $-2,165 |
|---|---|---|---|---|---|
| Rent | -10% $-2,100 | -5% $-1,923 | +0% $-1,747 | +5% $-1,571 | +10% $-1,394 |
| Rate | -1.0pp $-1,375 | -0.5pp $-1,559 | base $-1,747 | +0.5pp $-1,938 | +1.0pp $-2,133 |
UW: 25.0% down · 7.5% · 30yr · 1.5% tax · 5.0% vac · 8.0% maint · 8.0% mgmt
Financing live
Cash to close
- Down payment
- $184,750
- Closing costs
- $22,170
- Reserves months
- —
- Total cash needed
- —
Loan-product check · same deal, 3 products live
Conventional
25% down · 7.5% · 30yr
- Down + closing
- —
- Monthly P&I
- —
- Monthly cashflow
- —
- DSCR
- —
- Eligible?
- —
Personal DTI + credit; lowest rate.
DSCR
20% down · 8.5% · 30yr
- Down + closing
- —
- Monthly P&I
- —
- Monthly cashflow
- —
- DSCR
- —
- Eligible?
- —
No personal income docs; deal must DSCR.
Hard money
10% down · 12.0% · 12mo
- Down + closing
- —
- Monthly P&I
- —
- Monthly cashflow
- —
- DSCR
- —
- Eligible?
- —
Short-term bridge; refi at stabilization.
Rent comps 27 comps
| Address | Beds | Baths | Sqft | Rent | $/sqft | DOM | Units | Dist |
|---|---|---|---|---|---|---|---|---|
| 475 Clermont Ave Brooklyn, NY | 2.0 | 1.0–2.0 | 807 | $5,144 | $6.37 | 5d | 7 | 0.84mi |
| 196 Willoughby St Brooklyn, NY | 2.0 | 1.0–2.0 | 717 | $6,146 | $8.57 | 0d | 7 | 0.87mi |
| 545 Vanderbilt Ave Brooklyn, NY | 2.0 | 1.0 | 600 | $4,910 | $8.18 | 4d | 3 | 0.89mi |
| 482 Kent Ave Brooklyn, NY | 2.0 | 1.0–2.0 | 750 | $6,555 | $8.74 | 0d | 3 | 0.90mi |
| 478 Kent Ave Brooklyn, NY | 2.0 | 1.0–2.0 | 775 | $5,920 | $7.64 | 4d | 3 | 0.90mi |
| 151 S Elliott Pl Brooklyn, NY | 1.0–2.0 | 1.0–2.0 | 655 | $4,670 | $7.13 | 3d | 2 | 0.91mi |
| 11 Wharf Way Brooklyn, NY | 1.0 | 1.0 | 610 | $4,870 | $7.98 | 0d | 2 | 0.93mi |
| 343 Gold St Brooklyn, NY | 3.0 | 1.0–2.0 | 903 | $5,053 | $5.59 | 5d | 1 | 0.99mi |
| 540 Fulton St #1729 Brooklyn, NY | 3.0 | 1.0–2.0 | 750 | $5,737 | $7.65 | 25d | 4 | 1.00mi |
| 10 Nevins St Unit 9D Brooklyn, NY | — | 1.0 | 488 | $3,500 | $7.17 | 25d | 1 | 1.02mi |
| 275 S 5th St #1698 Brooklyn, NY | 1.0 | 1.0 | 450 | $4,860 | $10.80 | 25d | 2 | 1.04mi |
| 333 Schermerhorn St Brooklyn, NY | 1.0 | 1.0 | 585 | $6,782 | $11.58 | 0d | 15 | 1.04mi |
| 461 Dean St Brooklyn, NY | 1.0 | 1.0 | 781 | $5,320 | $6.81 | 6d | 5 | 1.07mi |
| 214 Duffield St Brooklyn, NY | 3.0 | 1.0–2.0 | 956 | $4,342 | $4.54 | 0d | 1 | 1.10mi |
| 100 Willoughby St Brooklyn, NY | 3.0 | 1.0–2.0 | 892 | $5,232 | $5.87 | 9d | 1 | 1.11mi |
| 250 Union Ave #2119 Brooklyn, NY | 1.0–2.0 | 1.0 | 590 | $3,500 | $5.93 | 25d | 2 | 1.14mi |
| 72 Willoughby St Brooklyn, NY | 1.0–2.0 | 1.0 | 487 | $3,900 | $8.00 | 3d | 2 | 1.17mi |
| 111 Lawrence St Brooklyn, NY | 3.0 | 1.0–2.0 | 950 | $4,282 | $4.50 | 0d | 24 | 1.17mi |
| 68 Gold St New York, NY | 1.0–2.0 | 1.0 | 700 | $3,610 | $5.16 | 25d | 2 | 1.18mi |
| 150 Lawrence St Brooklyn, NY | 1.0–2.0 | 1.0–2.0 | 700 | $4,130 | $5.90 | 0d | 2 | 1.20mi |
| 198 Hancock St Brooklyn, NY | 1.0 | 1.0 | 400 | $2,450 | $6.12 | 25d | 1 | 1.20mi |
| 328 Hancock St Brooklyn, NY | 2.0 | 1.0 | 500 | $2,800 | $5.60 | 25d | 1 | 1.38mi |
| 552 Prospect Pl Unit 3A Brooklyn, NY | 1.0 | 1.0 | 676 | $4,500 | $6.66 | 25d | 1 | 1.39mi |
| 565 Nostrand Ave Unit 1 Brooklyn, NY | — | 1.0 | 600 | $2,000 | $3.33 | 7d | 1 | 1.40mi |
| 200 Montague St #1516 Brooklyn, NY | 1.0 | 1.0 | 600 | $7,500 | $12.50 | 22d | 1 | 1.43mi |
| 755 Washington Ave Brooklyn, NY | 1.0 | 1.0 | 700 | $1,800 | $2.57 | 22d | 1 | 1.44mi |
| 180 Montague St Brooklyn, NY | 3.0 | 1.0–2.0 | 901 | $5,353 | $5.94 | 0d | 12 | 1.47mi |
HOA detail condo
- Monthly dues
- $563 · $6,756/yr
- Assessments
- None detected in remarks — confirm with the listing agent.
Listing history 3 events
-
2026-06-21days on market $739,000 Active 4 DOM
-
2026-06-17remarks 699-char remark
-
2026-06-17$739,000 Active 1 DOM
ⓘ Source: listings_history table (triggers on properties + properties_extension) + one-shot
backfill from property_details.listing_events for pre-trigger history.
Tax reassessment forecast NY · Partial reset (capped growth)
- Current annual tax
- $6,331 · $528/mo
- Projected year-2 tax
- $9,410 · $784/mo
- Expected delta
- +$3,079/yr (+$257/mo · 48.6%)
ⓘ Screening estimate from a state-policy table — verify with the county assessor before closing.
Climate risk First Street
- Flood 1/10 Low FEMA zone X (unshaded) · 0% chance over 30 yrs
- Wildfire 1/10 Low
- Heat 7/10 Severe 7 d/yr ≥99°F today · 15 d/yr by 30 yrs out
- Wind 6/10 Major 27% chance of damaging wind over 30 yrs
- Air quality 4/10 Moderate 5 unhealthy d/yr today · 7 by 30 yrs out
Nearby sold comps map
Loading sold comps map…
Walkable amenities ~0.75 mi
Loading nearby amenities…
Taxation est. · year 1
- Rental income
- $53,575
- − Mortgage interest
- −$41,395
- − Property taxes
- −$6,331
- − Insurance
- −$3,695
- − Repairs & maintenance
- −$4,286
- − Management
- −$4,286
- − HOA
- −$6,756
- − Depreciation
- −$21,498
- Taxable loss
- −$34,673
- Est. tax savings @ 24.0%
- +$8,322
- After-tax cash flow
- $-12,641/yr
For passive investors: Depreciation is non-cash, so a rental often shows a tax loss while cash-flowing — sheltering income. Rental losses are passive: they offset passive income freely, and up to $25,000/yr can offset ordinary (W-2) income if you actively participate and your MAGI is under $100k (phasing out to $0 by $150k); unused losses carry forward. On sale, claimed depreciation is recaptured at up to 25%, and gains may owe capital-gains tax (a 1031 exchange can defer both). Figures are a year-1 estimate at your 24.0% rate — not tax advice; consult a CPA.
Schools (NCES district)
No district data.
Livability — New York
- Score
- 75/100
- State rank
- #268
- US rank
- #4188
Category grades
Schools grade is shown separately in the Schools card above.
Census & demographics
- Census place
- New York, NY
- County
- Kings County · 2,614,986 people
- City population
- 7,731,280
- Metro
- New York-Newark-Jersey City, NY-NJ-PA
- Population (ZIP)
- 51,676
- Household income
- $93,887
- Rent vs Own
- Severe rent burden
- 3544.0
Population outlook (Kings County) Hauer SSP2
- Today (2025)
- 2,847,441 people
- By 2030
- 2,937,006 · +3.1%
- By 2040
- 3,095,491 · +8.7%
- By 2050
- 3,228,968 · +13.4%
- By 2075
- 3,321,723 · +16.7%
- By 2100
- 3,111,387 · +9.3%
Race, ethnicity, and origin ACS 2023
- Neighborhood character
- Diverse neighborhood (Simpson 0.66)
- Race & ethnicity
- White 52% Black 20% Hispanic / Latino 15% Two or more races 10% Asian 7%
- Hispanic origin (detail)
- Mexican 3% Puerto Rican 5% Dominican 3%
- Common ancestry
- Italian 4% Scandinavian 3% Romanian 2%
- Foreign-born
- 16% · Canada, China, South Korea
- Languages at home
- 57% English-only · German/W. Germanic 21% Spanish 11% Chinese 4%
Political lean MEDSL · Kings
- 2024 margin
- Solid D (+44.0) · D 72.0% · R 28.0%
- 2008→2024 swing
- -15.5pp toward R · 2008: 59.4pp · 2024: 44.0pp
- All cycles
- 2024: D+44.0 2020: D+54.8 2016: D+61.8 2012: D+63.9 2008: D+59.4
Not yet ingested
- Civics
- —
Market trends
- HPI YoY
- ▲ 12.40%
- Current HPI
- 605.3512
- Rent YoY
- ▲ 8.61%
- Metro
- New York-Newark-Jersey City, NY-NJ-PA
- State GDP YoY
- ▲ 2.60%
- F500 in state
- 92
Industry mix (Fortune 500 HQ in NY)
| Industry | F500 HQs | Revenue |
|---|---|---|
| Financial Services | 10 | $950B |
|
||
| Consumer Goods | 9 | $162B |
|
||
| Insurance | 4 | $225B |
|
||
| Telecommunications | 2 | $144B |
|
||
| Pharmaceuticals | 2 | $112B |
|
||
| Media / Entertainment | 2 | $69B |
|
||
Price history
+22.1% since first listed9 events — show timeline
- 2026-06-17 Listed $739,000 RLS at REBNY
- 2024-02-02 Price Changed $540,000 RLS at REBNY
- 2022-11-19 Price Changed $268,500 RLS at REBNY
- 2018-02-15 Sold (Public Records) $605,000 Public Records
- 2017-11-15 Price Changed $599,000 RLS at REBNY
- 2017-09-05 Listed $605,000 RLS at REBNY
- 2017-09-05 Listed $605,000 RLS at REBNY
- 2014-01-07 Listed $549,855 RLS at REBNY
- 2000-11-07 Price Changed $605,000 RLS at REBNY
Property tax history
+3.6%/yrLatest (2025): $6,331 · -15.5% YoY. Source: county tax records.
Cash-flow waterfall
monthlySold comps — $/sqft
last 12 mo · ≤1 miLoading sold comps…