2412 E Marmora St · Phoenix, AZ
Flood risk 1/10 · Minimal
- FEMA flood zone
- X (shaded)
- Chance of flooding over 30 yrs
- 0.0%
- Est. flood insurance / yr
- $507 – $1,088
Fire risk 3/10 · Minor
- Est. fire insurance / yr
- $610 – $1,132
Heat risk 9/10 · Severe
- Hot days now (above 110°F)
- 7 days/yr
- Hot days in 30 yrs
- 19 days/yr
Wind risk 1/10 · Minimal
- Chance of severe wind over 30 yrs
- —
Air-quality risk 3/10 · Minor
- Unhealthy air days now
- 2 days/yr
- Unhealthy air days in 30 yrs
- 3 days/yr
Risk factors via First Street. Map © Google.
Why this score? — see what drove the C- grade
The composite is a weighted blend of 9 inputs, each scored 0–100. Each bar is that input's sub-score; the figure is the points it added to the 100-point composite (weight × sub-score).
- Cash flow +21.5/30.0
- ARV discount +7.5/15.0
- DSCR +6.8/10.0
- 1% rule +4.7/10.0
- Schools +3.8/10.0
- Livability +3.8/5.0
- Condition / age +2.5/5.0
- Rent growth +2.1/5.0
- Appreciation +0.0/10.0
$250,000
🖨 Deal sheet 📄 Offer letter ✓ Due diligence
Listing remarks
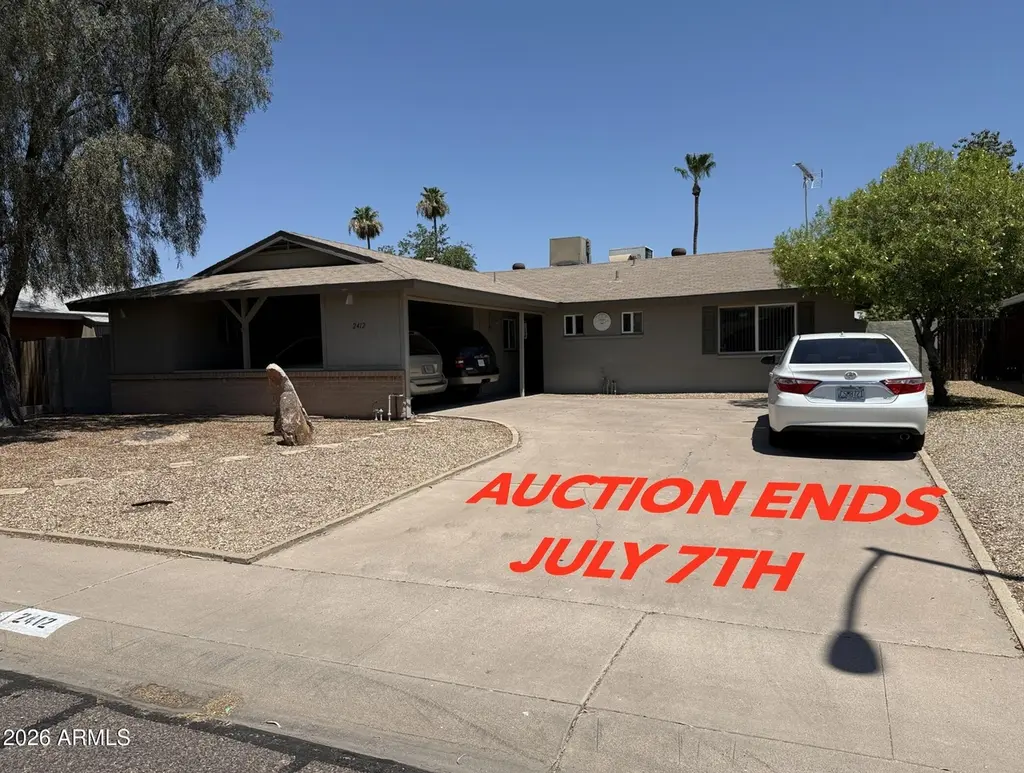
AUCTION ENDS JULY 7th for this 3 bedroom/2 bath 1,690+/- sq. ft. single-level house on 5,966+/- sq. ft. lot, Close to the 51 and 101 freeways, Piestewa Peak/North Phoenix Mountains/Hiking. Sold as-is. ACTUAL STARTING BID: $250,000.
Key facts
- 5,966 sq ft lot
- 4 parking spots
- Built 1969
Property features AI
Finance
- HOA & community: No association fees
Exterior
- Parking: 2 covered parking spaces; 2 open parking spaces; 2 carport spaces
- Utilities: Public sewer; City water
- Home design: Single-family residence; Fee simple ownership; Asphalt road access
- Construction: Stucco and painted block construction; Composition roof
- Exterior features: Sprinklers in front and rear; Alley access; Gravel/stone front and back; Block fencing
Interior
- Kitchen: Built-in microwave; Refrigerator; Dishwasher; Laminate counters
- Bedrooms: 3 possible bedrooms
- Flooring: Carpet; Vinyl
- Bathrooms: 1 full bathroom
- Heating & cooling: Electric heating; Central air; Ceiling fans; Evaporative cooling
- Interior features: 3/4 bath in primary bedroom; Laminate countertops; Dual-pane windows with vinyl frames
Neighborhood map
What this means for you Summary
Snapshot
- This is a 3-bed/2.0-bath single-family listed at $250k.
Deal economics
- At list price, monthly cash flow is $373 ($4k/yr) — positive.
- The deal already cash-flows at list — no discount required.
- To meet the 1% rule (rent ≥ 1% of price), the offer needs to be $241k (3.4% below list).
- Recommended offer: $241k (3.4% below list) — sets the bar for 1% rule.
- Cap rate 8.1% vs local median 3.3% in Phoenix — top-decile yield for the area; either an underpriced asset or a hidden risk that comps aren't pricing in. Stress-test before assuming the spread holds.
Location & tenants
- Location reads 75/100 on livability (#16 in AZ, #3,924 nationally) — a middle-class / working-renter tenant base. Strengths: amenities A+, commute A+, housing A+; Watch: health & safety C-, crime F.
- Paradise Valley Unified District (4241) (urban): math 39% / reading 46% proficiency, ranked #56 of 249 in AZ (top 22%) — families likely to look elsewhere, expect single-tenant / working-renter base with shorter leases.
- Zoned schools: Larkspur Elementary School (math 17% / reading 27%, grade F, #687 of 1,109 statewide, top 65%, 353 students, 67% FRL); Shea Middle School (math 20% / reading 34%, grade F, #97 of 218 statewide, top 45%, 511 students, 37% FRL); Shadow Mountain High School (math 27% / reading 35%, grade F, #111 of 381 statewide, top 29%, 1,109 students, 28% FRL).
- Zoned-school proficiency averages 27% at this address vs 42% district-wide (-16 pts) — the specific schools serving this property underperform the Paradise Valley Unified District (4241) average; the district grade overstates school quality for this exact location.
- Market conditions: Rents soft (-1.5%/yr); 337 active listings in the ZIP; 34 comparable units currently listed for rent nearby; rentals at typical pace (median 20d on market — plan ~3-4 weeks tenant-placement turnaround); solid renter incomes; 36,011 units permitted in Maricopa County in 2024 (12,801 in 5+ unit buildings).
- This rent runs 37% of the median local income ($79k/yr) — at the standard rent-burdened threshold; future hikes will face affordability resistance.
Forward outlook
- Local home prices are declining (-3.0%/yr); year-one equity from $2k of loan paydown is wiped out by about $8k of value loss. Plan a longer hold.
- Maricopa County population projected at +38% by 2050 — long-run rental-demand tailwind backs the buy-and-hold thesis.
Negotiation context
- Only 7 days on market — expect competitive offers; lowballing is unlikely to land.
Risks & watch-outs
- Climate carrying-cost: extreme-heat days projected 7→19/yr by 2055 (HVAC capex compounding) — expect insurance premiums to compound above CPI over the hold.
Questions for the listing agent
- Built in 1969 — when were the roof, HVAC, electrical panel, plumbing, and water heater last replaced?
- Is there a deadline driving the sale (1031 exchange, divorce, estate, relocation)? That informs how much negotiation room exists.
- Crime grade is F in this area — have there been break-ins, vandalism, or insurance claims at this property in the last 3 years? What carrier currently insures it and at what premium?
- What's the average days-on-market for RENTAL listings here right now (not sales)? A rising rental-DOM trend means longer vacancies and softer asking-rent achievability than the comps imply.
- What's the recent tenant-quality profile in this submarket — average credit score on applications, eviction rate, late-payment / NSF rate, and stable-employment percentage? A property-management company in the area should have these aggregated.
- How much new for-sale + rental construction is in the pipeline within 1–3 miles? Heavy new supply typically softens prices + rents 12–24 months out; constrained supply supports both.
Investment metrics
- 1% rule
- 0.97% ✗
- Cap rate
- 8.08%
- Cash-on-cash
- 6.39%
- DSCR
- 1.28
- GRM
- 8.6
CMA / ARV
- ARV (on-the-fly)
- $507,000
- Comps found
- 12
Show comp detail 12 sales within ~0.75 mi
| Address | Dist | Beds/Ba | Sqft | Sold | Price | $/sf | Match |
|---|---|---|---|---|---|---|---|
| 2602 E Larkspur Dr | 0.22mi | 3/2.0 | 1,700 (+1%) | 2mo | $505,000 | $297 | 87 |
| 12422 N Escobar Way | 0.33mi | 3/2.0 | 1,655 (-2%) | 1mo | $310,000 | $187 | 80 |
| 2437 E Larkspur Dr | 0.06mi | 4/3.0 (+1) | 1,845 (+9%) | 3mo | $559,000 | $303 | 70 |
| 2741 E Sylvia St | 0.44mi | 4/2.0 (+1) | 1,652 (-2%) | 3mo | $595,000 | $360 | 68 |
| 2577 E Sweetwater Ave | 0.36mi | 3/2.0 | 1,545 (-9%) | 3mo | $391,000 | $253 | 67 |
| 2749 E Sylvia St | 0.47mi | 4/2.0 (+1) | 1,750 (+4%) | 1mo | $480,000 | $274 | 67 |
| 2518 E Louise Dr | 0.21mi | 3/2.0 | 1,468 (-13%) | 2mo | $510,000 | $347 | 67 |
| 2838 E Sylvia St | 0.57mi | 3/2.0 | 1,635 (-3%) | 4mo | $490,000 | $300 | 65 |
| 2814 E Sierra St | 0.74mi | 3/2.0 | 1,546 (-8%) | 0mo | $565,000 | $365 | 51 |
| 2822 E Willow Ave | 0.75mi | 4/2.0 (+1) | 1,800 (+6%) | 1mo | $500,000 | $278 | 48 |
| 12815 N 19th St | 0.71mi | 2/2.0 (-1) | 1,555 (-8%) | 2mo | $405,300 | $261 | 47 |
| 3009 E Corrine Dr | 0.75mi | 4/2.0 (+1) | 1,512 (-10%) | 3mo | $515,000 | $341 | 40 |
Match score weights: distance 35% · size 25% · config 20% · recency 20%. Top-matched comps best support the ARV.
Projected returns pro-forma
-3.0% appreciation · 0.0% rent growth · sell at horizon
- IRR
- -9.6%
- Equity multiple
- 0.66×
- Total profit
- $-23,912
- Equity at exit
- $37,276
- IRR
- -4.4%
- Equity multiple
- 0.74×
- Total profit
- $-17,908
- Equity at exit
- $21,615
Cash invested: $70,000 (down + closing). Projections, not guarantees.
Landlord ↔ Tenant lean methodology
- Overall (STATE)
- 87 Strongly Landlord-Friendly
- State Arizona
- 87 Strongly Landlord-Friendly · R+3
- County
- — inherits STATE
- City
- — inherits STATE
ZIP-level market 85032
- Rents YoY
- -1.5%
- Active inventory
- 337
- Price-to-rent
- 8.6×
Monthly cashflow live
- Estimated rent
- $2,414 high interval (Pro) →
- Mortgage (P&I)
- −$1,311
- Tax from tax record
- −$119 /mo · $1,425/yr
- Insurance
- −$104
- HOA
- −$0
- Vacancy / Maint / Mgmt
- −$507
- Net cashflow
- $373
Break-even live
UW: 25.0% down · 7.5% · 30yr · 1.5% tax · 5.0% vac · 8.0% maint · 8.0% mgmt
Financing live
Cash to close
- Down payment
- $62,500
- Closing costs
- $7,500
- Reserves months
- —
- Total cash needed
- —
Loan-product check · same deal, 3 products live
Conventional
25% down · 7.5% · 30yr
- Down + closing
- —
- Monthly P&I
- —
- Monthly cashflow
- —
- DSCR
- —
- Eligible?
- —
Personal DTI + credit; lowest rate.
DSCR
20% down · 8.5% · 30yr
- Down + closing
- —
- Monthly P&I
- —
- Monthly cashflow
- —
- DSCR
- —
- Eligible?
- —
No personal income docs; deal must DSCR.
Hard money
10% down · 12.0% · 12mo
- Down + closing
- —
- Monthly P&I
- —
- Monthly cashflow
- —
- DSCR
- —
- Eligible?
- —
Short-term bridge; refi at stabilization.
Rent comps 34 comps
| Address | Beds | Baths | Sqft | Rent | $/sqft | DOM | Units | Dist |
|---|---|---|---|---|---|---|---|---|
| 2440 E Dahlia Dr Phoenix, AZ | 3.0 | 2.0 | 1215 | $2,455 | $2.02 | 7d | 1 | 0.26mi |
| 2601 E Dahlia Dr Phoenix, AZ | 4.0 | 2.0 | 1998 | $3,195 | $1.60 | 24d | 1 | 0.30mi |
| 2202 E Marmora St Phoenix, AZ | 3.0 | 2.0 | 1639 | $1,965 | $1.20 | 20d | 1 | 0.31mi |
| 2707 E Louise Dr Phoenix, AZ | 3.0 | 2.0 | 1536 | $5,250 | $3.42 | 24d | 1 | 0.35mi |
| 2625 E Cactus Rd Phoenix, AZ | 1.0–3.0 | 1.0–2.0 | 1026 | $2,649 | $2.58 | 1d | 19 | 0.37mi |
| 2705 E Cactus Rd Phoenix, AZ | 2.0 | 2.0 | 1394 | $1,900 | $1.36 | 1d | 1 | 0.44mi |
| 11645 N 25th Pl Phoenix, AZ | 2.0 | 2.0 | 977 | $1,400 | $1.43 | 21d | 5 | 0.53mi |
| 2822 E Willow Ave Phoenix, AZ | 4.0 | 2.0 | 1800 | $2,995 | $1.66 | 10d | 1 | 0.75mi |
| 2119 E Jennifer Lynn Way Phoenix, AZ | 3.0 | 2.5 | 1663 | $2,737 | $1.65 | 3d | 3 | 0.82mi |
| 13636 N 21st Pl #1 Phoenix, AZ | 2.0 | 2.5 | 1353 | $1,895 | $1.40 | 24d | 1 | 0.88mi |
| 13613 N 19th Pl Phoenix, AZ | 4.0 | 2.0 | 2158 | $3,199 | $1.48 | 43d | 1 | 0.94mi |
| 13613 N 19th Pl Phoenix, AZ | 4.0 | 2.0 | 2158 | $3,170 | $1.47 | 24d | 1 | 0.94mi |
| 3033 E Thunderbird Rd Phoenix, AZ | 3.0 | 2.0 | 1147 | $2,211 | $1.93 | 3d | 1 | 0.99mi |
| 3033 E Thunderbird Rd Phoenix, AZ | 3.0 | 2.0 | 1147 | $2,583 | $2.25 | 21d | 1 | 0.99mi |
| 1924 E Sharon Dr Phoenix, AZ | 4.0 | 2.0 | 1851 | $2,600 | $1.40 | 3d | 1 | 1.01mi |
| 13818 N 20th St Phoenix, AZ | 3.0 | 2.0 | 1750 | $2,750 | $1.57 | 20d | 1 | 1.02mi |
| 12424 N 33rd St Phoenix, AZ | 4.0 | 2.0 | 1470 | $3,000 | $2.04 | 2d | 1 | 1.03mi |
| 2102 E Sheena Dr Phoenix, AZ | 4.0 | 2.0 | 1750 | $2,536 | $1.45 | 21d | 1 | 1.07mi |
| 1550 E Thunderbird Rd Phoenix, AZ | 1.0–3.0 | 1.0–2.0 | 977 | $1,795 | $1.84 | 1d | 13 | 1.08mi |
| 2614 E Sahuaro Dr Phoenix, AZ | 3.0 | 2.0 | 1917 | $3,145 | $1.64 | 21d | 1 | 1.10mi |
| 3213 E Emile Zola Ave Phoenix, AZ | 3.0 | 3.0 | 1636 | $2,500 | $1.53 | 18d | 1 | 1.14mi |
| 14236 N 23rd St Phoenix, AZ | 2.0 | 2.0 | 1398 | $2,500 | $1.79 | 24d | 1 | 1.19mi |
| 2345 E Gelding Dr Phoenix, AZ | 3.0 | 2.5 | 1438 | $2,045 | $1.42 | 4d | 1 | 1.23mi |
| 11212 N 32nd St Phoenix, AZ | 4.0 | 2.0 | 1965 | $2,900 | $1.48 | 18d | 1 | 1.23mi |
| 1821 E Hearn Rd Phoenix, AZ | 3.0 | 1.5 | 1650 | $2,046 | $1.24 | 24d | 1 | 1.26mi |
| 2366 E Evans Dr Phoenix, AZ | 3.0 | 2.5 | 1595 | $2,285 | $1.43 | 24d | 1 | 1.28mi |
| 13035 N 34th St #15 Phoenix, AZ | 2.0 | 2.0 | 1053 | $1,295 | $1.23 | 24d | 1 | 1.30mi |
| 11035 N 32nd St Phoenix, AZ | 4.0 | 2.0 | 1871 | $3,550 | $1.90 | 14d | 1 | 1.32mi |
| 14014 N 32nd St Phoenix, AZ | 1.0–2.0 | 1.0–2.0 | 914 | $1,337 | $1.46 | 3d | 5 | 1.33mi |
| 3430 E Poinsettia Dr Phoenix, AZ | 4.0 | 2.0 | 1497 | $2,995 | $2.00 | 24d | 1 | 1.37mi |
| 3434 E Poinsettia Dr Phoenix, AZ | 3.0 | 2.0 | 1924 | $2,700 | $1.40 | 24d | 1 | 1.39mi |
| 3335 E Yucca St Phoenix, AZ | 3.0 | 2.0 | 1590 | $2,600 | $1.64 | 3d | 1 | 1.45mi |
| 10801 N 32nd St Phoenix, AZ | 2.0 | 1.0–2.0 | 824 | $1,942 | $2.36 | 7d | 11 | 1.48mi |
| 3515 E Cortez St Phoenix, AZ | 4.0 | 2.0 | 1550 | $2,100 | $1.35 | 24d | 1 | 1.50mi |
Listing history 7 events
-
2026-06-18days on market $250,000 Active 7 DOM
-
2026-06-17days on market $250,000 Active 6 DOM
-
2026-06-16days on market $250,000 Active 5 DOM
-
2026-06-15days on market $250,000 Active 4 DOM
-
2026-06-13days on market $250,000 Active 2 DOM
-
2026-06-13remarks 232-char remark
-
2026-06-13$250,000 Active 1 DOM
ⓘ Source: listings_history table (triggers on properties + properties_extension) + one-shot
backfill from property_details.listing_events for pre-trigger history.
Tax reassessment forecast AZ · Resets to sale price
- Current annual tax
- $1,425 · $119/mo
- Projected year-2 tax
- $1,650 · $138/mo
- Expected delta
- +$225/yr (+$19/mo · 15.8%)
ⓘ Screening estimate from a state-policy table — verify with the county assessor before closing.
Climate risk First Street
- Flood 1/10 Low FEMA zone X (shaded) · 0% chance over 30 yrs
- Wildfire 3/10 Moderate
- Heat 9/10 Extreme 7 d/yr ≥110°F today · 19 d/yr by 30 yrs out
- Wind 1/10 Low
- Air quality 3/10 Moderate 2 unhealthy d/yr today · 3 by 30 yrs out
Nearby sold comps map
Loading sold comps map…
Walkable amenities ~0.75 mi
Loading nearby amenities…
Taxation est. · year 1
- Rental income
- $28,965
- − Mortgage interest
- −$14,004
- − Property taxes
- −$1,425
- − Insurance
- −$1,250
- − Repairs & maintenance
- −$2,317
- − Management
- −$2,317
- − Depreciation
- −$7,273
- Taxable income
- $380
- Est. tax owed @ 24.0%
- −$91
- After-tax cash flow
- $4,385/yr
For passive investors: Depreciation is non-cash, so a rental often shows a tax loss while cash-flowing — sheltering income. Rental losses are passive: they offset passive income freely, and up to $25,000/yr can offset ordinary (W-2) income if you actively participate and your MAGI is under $100k (phasing out to $0 by $150k); unused losses carry forward. On sale, claimed depreciation is recaptured at up to 25%, and gains may owe capital-gains tax (a 1031 exchange can defer both). Figures are a year-1 estimate at your 24.0% rate — not tax advice; consult a CPA.
Schools (NCES district)
- District
- Paradise Valley Unified District (4241)
- NCES district ID
- 0405930
- Math proficiency
- 39% ▼ -11.00%
- Reading proficiency
- 46% ▼ -7.00%
- Median HH income
- $64,106
- Composite
- 37.89/100
- National rank
- #4316
- State rank
- #56 of 249 in AZ
Livability — Phoenix
- Score
- 75/100
- State rank
- #16
- US rank
- #3924
Category grades
Schools grade is shown separately in the Schools card above.
Census & demographics
- Census place
- Phoenix, AZ
- County
- Maricopa County · 4,537,380 people
- City population
- 1,500,198
- Metro
- Phoenix-Mesa-Chandler, AZ
- Population (ZIP)
- 70,839
- Household income
- $78,643
- Rent vs Own
- Severe rent burden
- 2887.0
Population outlook (Maricopa County) Hauer SSP2
- Today (2025)
- 4,979,203 people
- By 2030
- 5,378,229 · +8.0%
- By 2040
- 6,156,598 · +23.6%
- By 2050
- 6,872,376 · +38.0%
- By 2075
- 8,401,270 · +68.7%
- By 2100
- 9,247,439 · +85.7%
Race, ethnicity, and origin ACS 2023
- Neighborhood character
- Diverse neighborhood (Simpson 0.57)
- Race & ethnicity
- White 59% Hispanic / Latino 29% Two or more races 17% Asian 4% Black 3% Native American 2%
- Hispanic origin (detail)
- Mexican 25%
- Common ancestry
- Romanian 2% Slovak 2% Portuguese 2%
- Foreign-born
- 18% · Canada, China
- Languages at home
- 71% English-only · Spanish 21% Russian/Polish/Slavic 2% Other Indo-European 1%
Political lean MEDSL · Maricopa
- 2024 margin
- Toss-up / Even · D 47.7% · R 51.2% · Other 1.1%
- 2008→2024 swing
- +7.1pp toward D · 2008: -10.6pp · 2024: -3.5pp
- All cycles
- 2024: R+3.5 2020: D+2.2 2016: R+3.5 2012: R+12.0 2008: R+10.6
Not yet ingested
- Civics
- —
Market trends
- HPI YoY
- ▼ -488.65%
- Current HPI
- 339.4181
- Rent YoY
- ▼ -1.46%
- Metro
- Phoenix-Mesa-Chandler, AZ
- State GDP YoY
- ▲ 4.54%
- F500 in state
- 20
Industry mix (Fortune 500 HQ in AZ)
| Industry | F500 HQs | Revenue |
|---|---|---|
| Technology | 2 | $13B |
|
||
| Mining / Metals | 1 | $23B |
|
||
| Environmental Services | 1 | $16B |
|
||
| Metals / Steel | 1 | $14B |
|
||
| Technology Distribution | 1 | $9B |
|
||
| Homebuilding | 1 | $8B |
|
||
Price history
1 event — show timeline
- 2026-06-09 Listed $250,000 ARMLS
Property tax history
+0.6%/yrLatest (2025): $1,425 · +2.6% YoY. Source: county tax records.
Cash-flow waterfall
monthlySold comps — $/sqft
last 12 mo · ≤1 miLoading sold comps…