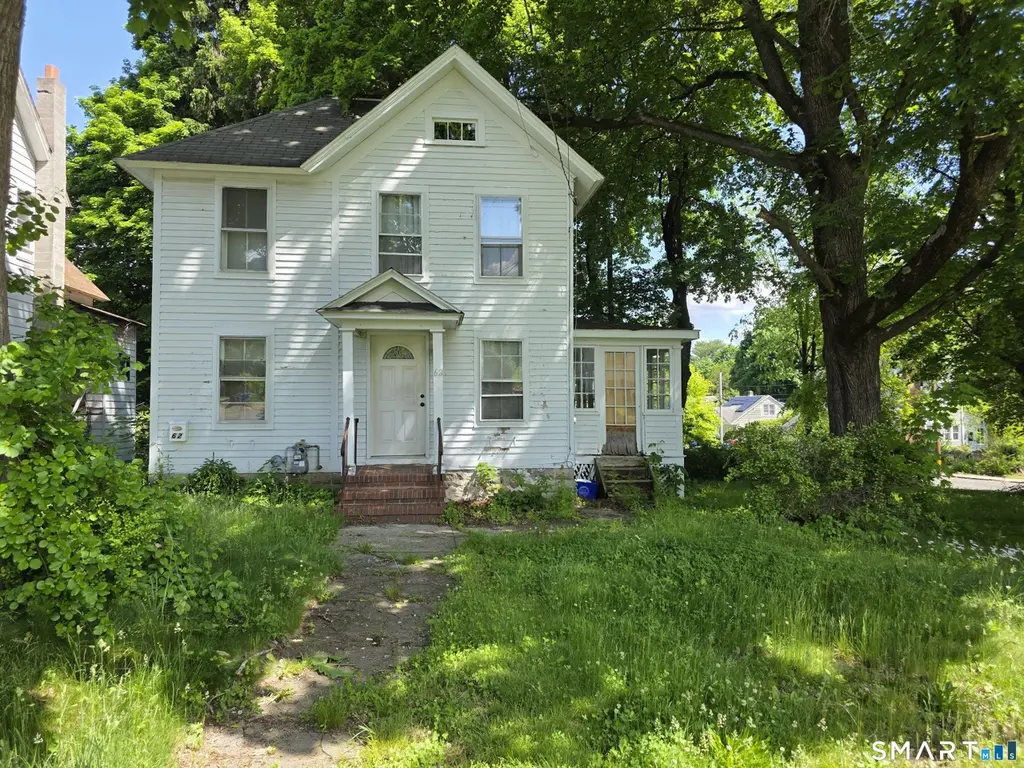
62 Highland Ave · Torrington, CT
Flood risk 1/10 · Minimal
- FEMA flood zone
- X
- Chance of flooding over 30 yrs
- 0.0%
- Est. flood insurance / yr
- $473 – $860
Fire risk 3/10 · Minor
- Est. fire insurance / yr
- $829 – $1,539
Heat risk 4/10 · Minor
- Hot days now (above 93°F)
- 8 days/yr
- Hot days in 30 yrs
- 18 days/yr
Wind risk 5/10 · Moderate
- Chance of severe wind over 30 yrs
- 26.0%
Air-quality risk 2/10 · Minimal
- Unhealthy air days now
- 1 days/yr
- Unhealthy air days in 30 yrs
- 1 days/yr
Risk factors via First Street. Map © Google.
Why this score? — see what drove the B- grade
The composite is a weighted blend of 9 inputs, each scored 0–100. Each bar is that input's sub-score; the figure is the points it added to the 100-point composite (weight × sub-score).
- Cash flow +28.9/30.0
- DSCR +10.0/10.0
- 1% rule +9.6/10.0
- ARV discount +7.5/15.0
- Rent growth +4.0/5.0
- Livability +3.8/5.0
- Schools +2.7/10.0
- Condition / age +2.5/5.0
- Appreciation +0.0/10.0
$139,500
🖨 Deal sheet 📄 Offer letter ✓ Due diligence
Listing remarks
Spacious 4-bedroom Colonial full of potential! This home features a large eat-in kitchen, formal dining room and large living room. Enjoy relaxing on the enclosed porch overlooking a level yard on a corner lot. With solid space, newer boiler, wood floors and classic charm, this property is ready for your renovation ideas and personal touch. Great opportunity to restore and customize to your style. Home is being sold "as is where is" Cash only or rehab loans best to qualify! FINAL AND BEST BY 4 SUNDAY MAY 31
Key facts
- Level yard
- Formal dining room
- Newer boiler
Tags
Property features AI
Exterior
- Parking: Attached garage; Driveway parking; Total of 4 parking spaces; 1 garage bay
- Utilities: Public water connected; Public sewer connected; Natural gas service
- Home design: Single-family home; Frame construction; White exterior; Clapboard siding; Asphalt shingle roof
- Construction: Built with frame construction; Stone foundation
- Exterior features: Enclosed porch and open porch; Corner and level lot; Gravel driveway
Interior
- Kitchen: Refrigerator included
- Bedrooms: 4 bedrooms
- Bathrooms: 2 full bathrooms
- Heating & cooling: Baseboard and hot water heating (natural gas); Ceiling fans for cooling
- Interior features: Ceiling fans; Full basement with walk-out; Has walk-up attic; Total of 8 rooms
- Laundry & utility: Laundry on main level; 40-gallon natural gas hot water tank
Neighborhood map
What this means for you Summary
Snapshot
- This is a 3-bed/1.0-bath single-family listed at $140k.
Deal economics
- At list price, monthly cash flow is $473 ($6k/yr) — positive.
- The deal already cash-flows at list — no discount required.
- Meets the 1% rule at list price ($2k rent vs $140k).
- Cap rate 10.4% vs local median 3.9% in Torrington — top-decile yield for the area; either an underpriced asset or a hidden risk that comps aren't pricing in. Stress-test before assuming the spread holds.
Location & tenants
- Location reads 76/100 on livability (#53 in CT, #3,449 nationally) — a middle-class / working-renter tenant base. Strengths: crime A+, cost of living A+, housing A+; Watch: schools D, commute F.
- Torrington School District (town): math 22% / reading 39% proficiency, ranked #125 of 153 in CT (top 82%) — families likely to look elsewhere, expect single-tenant / working-renter base with shorter leases.
- Market conditions: Rents rising fast (+5.9%/yr); 188 active listings in the ZIP; 19 comparable units currently listed for rent nearby; rentals lingering (median 44d on market — plan ~5-8 weeks vacancy on turnover, expect pricing pressure); 84% of comp listings sitting > 30 days — soft ceiling on asking rent; 154 units permitted in Northwest Hills Planning Region in 2024 (6 in 5+ unit buildings).
- This rent runs 34% of the median local income ($71k/yr) — at the standard rent-burdened threshold; future hikes will face affordability resistance.
Forward outlook
- Local home prices are declining (-3.0%/yr); year-one equity from $964 of loan paydown is wiped out by about $4k of value loss. Plan a longer hold.
- At projected returns (-3.0% appreciation + 5.9% rent growth), your $39k cash investment doubles in ~7 years — after that, you're playing with house money.
Negotiation context
- Only 4 days on market — expect competitive offers; lowballing is unlikely to land.
Risks & watch-outs
- Watch-outs: property tax is 2.9% of price; built in 1900 — expect roof / HVAC / electrical / plumbing capex.
- Climate carrying-cost: moderate wind risk, 26% chance of damaging wind over 30y — expect insurance premiums to compound above CPI over the hold.
Questions for the listing agent
- Built in 1900 — when were the roof, HVAC, electrical panel, plumbing, and water heater last replaced?
- Property tax is high relative to price — has the assessment been appealed recently, and will the sale trigger a re-assessment?
- Is there a deadline driving the sale (1031 exchange, divorce, estate, relocation)? That informs how much negotiation room exists.
- Schools are D-rated, which usually means shorter tenancies and higher turnover. Who's the typical renter profile here, and what's been the actual vacancy rate?
- What's the average days-on-market for RENTAL listings here right now (not sales)? A rising rental-DOM trend means longer vacancies and softer asking-rent achievability than the comps imply.
- What's the recent tenant-quality profile in this submarket — average credit score on applications, eviction rate, late-payment / NSF rate, and stable-employment percentage? A property-management company in the area should have these aggregated.
- How much new for-sale + rental construction is in the pipeline within 1–3 miles? Heavy new supply typically softens prices + rents 12–24 months out; constrained supply supports both.
Investment metrics
- 1% rule
- 1.46% ✓
- Cap rate
- 10.36%
- Cash-on-cash
- 14.54%
- DSCR
- 1.65
- GRM
- 5.7
CMA / ARV
- ARV (on-the-fly)
- $292,320
- Comps found
- 12
Show comp detail 12 sales within ~0.75 mi
| Address | Dist | Beds/Ba | Sqft | Sold | Price | $/sf | Match |
|---|---|---|---|---|---|---|---|
| 64 Hoffman St | 0.38mi | 3/2.5 | 1,728 (-1%) | 1mo | $275,000 | $159 | 74 |
| 116 Johnson St | 0.25mi | 3/2.0 | 1,698 (-2%) | 8mo | $308,000 | $181 | 74 |
| 36 Beechwood Ave | 0.07mi | 4/2.0 (+1) | 1,620 (-7%) | 10mo | $260,000 | $160 | 67 |
| 279 Main St | 0.62mi | 3/1.0 | 1,697 (-2%) | 5mo | $228,000 | $134 | 63 |
| 130 Oakbrook Ln | 0.51mi | 2/2.0 (-1) | 1,735 (-0%) | 7mo | $399,900 | $230 | 61 |
| 67 Birden St | 0.29mi | 4/2.0 (+1) | 1,852 (+6%) | 10mo | $370,000 | $200 | 58 |
| 113 Pearl St | 0.48mi | 3/1.5 | 1,570 (-10%) | 11mo | $240,000 | $153 | 50 |
| 508 Highland Ave | 0.63mi | 3/1.5 | 1,600 (-8%) | 11mo | $315,000 | $197 | 46 |
| 24 Zappula Dr | 0.70mi | 3/1.5 | 1,876 (+8%) | 10mo | $375,000 | $200 | 44 |
| 17 Prospect Pl | 0.71mi | 2/2.0 (-1) | 1,846 (+6%) | 8mo | $205,000 | $111 | 41 |
| 12 Oregon St | 0.52mi | 3/1.0 | 1,490 (-14%) | 14mo | $243,750 | $164 | 40 |
| 547 Riverside Ave | 0.70mi | 4/2.0 (+1) | 1,610 (-8%) | 9mo | $270,000 | $168 | 38 |
Match score weights: distance 35% · size 25% · config 20% · recency 20%. Top-matched comps best support the ARV.
Projected returns pro-forma
-3.0% appreciation · 5.89% rent growth · sell at horizon
- IRR
- 8.6%
- Equity multiple
- 1.35×
- Total profit
- $13,749
- Equity at exit
- $20,800
- IRR
- 20.4%
- Equity multiple
- 2.99×
- Total profit
- $77,780
- Equity at exit
- $12,061
Cash invested: $39,060 (down + closing). Projections, not guarantees.
Landlord ↔ Tenant lean methodology
- Overall (STATE)
- 27 Tenant-Leaning
- State Connecticut
- 27 Tenant-Leaning · D+7
- County
- — inherits STATE
- City
- — inherits STATE
ZIP-level market 06790
- Rents YoY
- 5.9%
- Active inventory
- 188
- Price-to-rent
- 5.7×
Monthly cashflow live
- Estimated rent
- $2,030 high interval (Pro) →
- Mortgage (P&I)
- −$732
- Tax from tax record
- −$341 /mo · $4,089/yr
- Insurance
- −$58
- HOA
- −$0
- Vacancy / Maint / Mgmt
- −$426
- Net cashflow
- $473
Break-even live
UW: 25.0% down · 7.5% · 30yr · 1.5% tax · 5.0% vac · 8.0% maint · 8.0% mgmt
Financing live
Cash to close
- Down payment
- $34,875
- Closing costs
- $4,185
- Reserves months
- —
- Total cash needed
- —
Loan-product check · same deal, 3 products live
Conventional
25% down · 7.5% · 30yr
- Down + closing
- —
- Monthly P&I
- —
- Monthly cashflow
- —
- DSCR
- —
- Eligible?
- —
Personal DTI + credit; lowest rate.
DSCR
20% down · 8.5% · 30yr
- Down + closing
- —
- Monthly P&I
- —
- Monthly cashflow
- —
- DSCR
- —
- Eligible?
- —
No personal income docs; deal must DSCR.
Hard money
10% down · 12.0% · 12mo
- Down + closing
- —
- Monthly P&I
- —
- Monthly cashflow
- —
- DSCR
- —
- Eligible?
- —
Short-term bridge; refi at stabilization.
Rent comps 19 comps
| Address | Beds | Baths | Sqft | Rent | $/sqft | DOM | Units | Dist |
|---|---|---|---|---|---|---|---|---|
| 63 Smith St Torrington, CT | 3.0 | 1.5 | 1392 | $2,200 | $1.58 | 44d | 1 | 0.14mi |
| 17 Woodbine St Torrington, CT | 3.0 | 1.5 | 1430 | $2,200 | $1.54 | 44d | 1 | 0.20mi |
| 21 Woodbine St Torrington, CT | 2.0 | 1.0 | 1516 | $1,850 | $1.22 | 44d | 1 | 0.21mi |
| 199 Migeon Ave Unit 2 Torrington, CT | 3.0 | 1.0 | 1500 | $2,350 | $1.57 | 44d | 1 | 0.27mi |
| 163 Beechwood Ave Torrington, CT | 4.0 | 2.0 | 1896 | $2,800 | $1.48 | 44d | 1 | 0.27mi |
| 42 Pulver St Torrington, CT | 3.0 | 1.0 | 1443 | $1,800 | $1.25 | 44d | 1 | 0.33mi |
| 14 Culvert St Unit 2 Torrington, CT | 4.0 | 1.0 | 1638 | $1,695 | $1.03 | 44d | 1 | 0.33mi |
| 101 Culvert St Unit 101 Torrington, CT | 3.0 | 1.0 | 1200 | $1,600 | $1.33 | 44d | 1 | 0.34mi |
| 375 N Elm St Unit 2 Torrington, CT | 2.0 | 1.0 | 1100 | $1,700 | $1.55 | 44d | 1 | 0.56mi |
| 152 Turner Ave #2 Torrington, CT | 2.0 | 1.0 | 1200 | $1,550 | $1.29 | 44d | 1 | 0.61mi |
| 53 Prospect St Unit 2 Torrington, CT | 3.0 | 1.5 | 1100 | $2,100 | $1.91 | 44d | 1 | 0.64mi |
| 5 Winthrop St Torrington, CT | 3.0 | 1.5 | 1072 | $2,350 | $2.19 | 44d | 1 | 0.85mi |
| 93 E Elm St Unit U2 Torrington, CT | 3.0 | 1.0 | 1100 | $1,550 | $1.41 | 44d | 1 | 0.86mi |
| 696 Main St Unit 2 Torrington, CT | 2.0 | 1.0 | 1117 | $1,350 | $1.21 | 44d | 1 | 0.94mi |
| 340 Brightwood Ave Unit 2 Torrington, CT | 3.0 | 1.0 | 1080 | $1,900 | $1.76 | 44d | 1 | 1.10mi |
| 19 Wadhams Ave Torrington, CT | 2.0 | 1.5 | 1112 | $1,895 | $1.70 | 44d | 1 | 1.16mi |
| 71 Arthur St #1 Torrington, CT | 2.0 | 1.5 | 1326 | $1,800 | $1.36 | 24d | 1 | 1.18mi |
| 261 Hillside Ave Unit 2 Torrington, CT | 2.0 | 1.0 | 1344 | $1,300 | $0.97 | 24d | 1 | 1.28mi |
| 84 Wilmot St Torrington, CT | 2.0 | 1.5 | 1768 | $1,850 | $1.05 | 24d | 1 | 1.50mi |
Listing history 6 events
-
2026-06-02status $139,500 Under Contract 4 DOM
-
2026-06-01days on market $139,500 Active 4 DOM
-
2026-05-31remarks 513-char remark
-
2026-05-31days on market $139,500 Active 3 DOM
-
2026-05-30days on market $139,500 Active 2 DOM
-
2026-05-28$139,500 Active
ⓘ Source: listings_history table (triggers on properties + properties_extension) + one-shot
backfill from property_details.listing_events for pre-trigger history.
Tax reassessment forecast CT · Partial reset (capped growth)
- Current annual tax
- $4,089 · $341/mo
- Projected year-2 tax
- $4,089 · $341/mo
- Expected delta
- $0/yr ($0/mo · 0.0%)
ⓘ Screening estimate from a state-policy table — verify with the county assessor before closing.
Climate risk First Street
- Flood 1/10 Low FEMA zone X · 0% chance over 30 yrs
- Wildfire 3/10 Moderate
- Heat 4/10 Moderate 8 d/yr ≥93°F today · 18 d/yr by 30 yrs out
- Wind 5/10 Major 26% chance of damaging wind over 30 yrs
- Air quality 2/10 Low 1 unhealthy d/yr today · 1 by 30 yrs out
Nearby sold comps map
Loading sold comps map…
Walkable amenities ~0.75 mi
Loading nearby amenities…
Taxation est. · year 1
- Rental income
- $24,361
- − Mortgage interest
- −$7,814
- − Property taxes
- −$4,089
- − Insurance
- −$698
- − Repairs & maintenance
- −$1,949
- − Management
- −$1,949
- − Depreciation
- −$4,058
- Taxable income
- $3,805
- Est. tax owed @ 24.0%
- −$913
- After-tax cash flow
- $4,767/yr
For passive investors: Depreciation is non-cash, so a rental often shows a tax loss while cash-flowing — sheltering income. Rental losses are passive: they offset passive income freely, and up to $25,000/yr can offset ordinary (W-2) income if you actively participate and your MAGI is under $100k (phasing out to $0 by $150k); unused losses carry forward. On sale, claimed depreciation is recaptured at up to 25%, and gains may owe capital-gains tax (a 1031 exchange can defer both). Figures are a year-1 estimate at your 24.0% rate — not tax advice; consult a CPA.
Schools (NCES district)
- District
- Torrington School District
- NCES district ID
- 0904590
- Math proficiency
- 22% ▼ -8.00%
- Reading proficiency
- 39% ▼ -6.00%
- Median HH income
- $53,647
- Composite
- 26.9/100
- National rank
- #7087
- State rank
- #125 of 153 in CT
Livability — Torrington
- Score
- 76/100
- State rank
- #53
- US rank
- #3449
Category grades
Schools grade is shown separately in the Schools card above.
Census & demographics
- Census place
- Torrington, CT
- County
- Litchfield County · 81,203 people
- City population
- 35,566
- Metro
- Torrington, CT
- Population (ZIP)
- 35,566
- Household income
- $70,912
- Rent vs Own
- Severe rent burden
- 1401.0
Population outlook (Northwest Hills County) Hauer SSP2
- By 2040
- 118,998
Race, ethnicity, and origin ACS 2023
- Neighborhood character
- Predominantly White (73%)
- Race & ethnicity
- White 73% Hispanic / Latino 14% Two or more races 8% Black 6% Asian 3%
- Hispanic origin (detail)
- Puerto Rican 5% Dominican 2%
- Common ancestry
- Romanian 8% Lithuanian 5% Slovak 2%
- Foreign-born
- 12% · Canada, South Korea, Jamaica
- Languages at home
- 86% English-only · Spanish 8% Other Indo-European 2% Russian/Polish/Slavic 1%
Political lean MEDSL · Northwest Hills
- 2024 margin
- Toss-up / Even · D 48.6% · R 49.9% · Other 1.6%
- All cycles
- 2024: R+1.3
Not yet ingested
- Civics
- —
Market trends
- HPI YoY
- ▼ -122.78%
- Current HPI
- 208.4818
- Rent YoY
- ▲ 5.89%
- Metro
- Torrington, CT
- State GDP YoY
- ▲ 1.06%
- F500 in state
- 38
Industry mix (Fortune 500 HQ in CT)
| Industry | F500 HQs | Revenue |
|---|---|---|
| Industrial Machinery | 4 | $38B |
|
||
| Insurance | 3 | $71B |
|
||
| Financial Services | 2 | $25B |
|
||
| Transportation / Logistics | 2 | $18B |
|
||
| Healthcare | 1 | $247B |
|
||
| Telecommunications | 1 | $55B |
|
||
Price history
1 event — show timeline
- 2026-05-28 Listed $139,500 Smart MLS
Property tax history
+1.2%/yrLatest (2023): $4,089 · +1.7% YoY. Source: county tax records.
Cash-flow waterfall
monthlySold comps — $/sqft
last 12 mo · ≤1 miLoading sold comps…