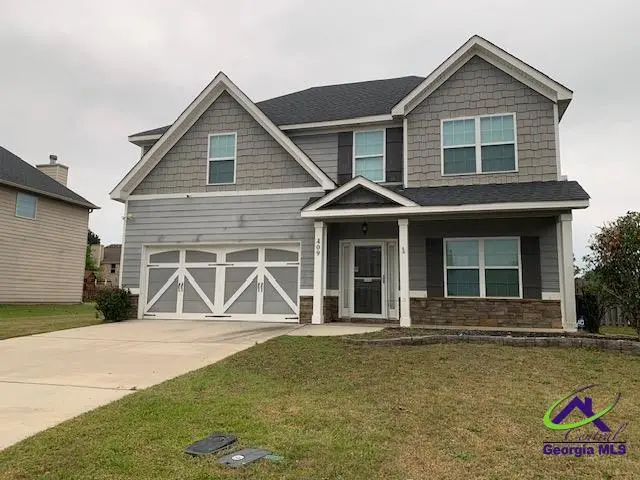
409 Rolling Acres Dr · Perry, GA
Flood risk 1/10 · Minimal
- FEMA flood zone
- X (unshaded)
- Chance of flooding over 30 yrs
- 0.0%
- Est. flood insurance / yr
- $507 – $1,088
Fire risk 4/10 · Minor
- Est. fire insurance / yr
- $963 – $1,789
Heat risk 7/10 · Major
- Hot days now (above 109°F)
- 7 days/yr
- Hot days in 30 yrs
- 19 days/yr
Wind risk 7/10 · Major
- Chance of severe wind over 30 yrs
- 78.0%
Air-quality risk 3/10 · Minor
- Unhealthy air days now
- 3 days/yr
- Unhealthy air days in 30 yrs
- 4 days/yr
Risk factors via First Street. Map © Google.
Why this score? — see what drove the C grade
The composite is a weighted blend of 9 inputs, each scored 0–100. Each bar is that input's sub-score; the figure is the points it added to the 100-point composite (weight × sub-score).
- Cash flow +20.2/30.0
- ARV discount +15.0/15.0
- DSCR +6.4/10.0
- 1% rule +4.8/10.0
- Schools +3.9/10.0
- Livability +3.4/5.0
- Rent growth +2.5/5.0
- Condition / age +2.5/5.0
- Appreciation +0.0/10.0
$271,500
🖨 Deal sheet (PDF) 📄 Offer letter ✓ Due diligence
Listing remarks MLS
Lots of room in this 4 bedroom 2.5 bath with open floorplan. Formal dining and large main bedroom.
Key facts
- 9,583 sq ft lot
- Garage
- Built 2016
Property features AI
Finance
- Other: Lot about 0.22 acre; Located in The Woodlands Sanford Place subdivision; Address: Kathleen, GA 31047
- HOA & community: Homeowners association with a $180 fee (fee does not include additional services)
Exterior
- Parking: Attached garage
- Utilities: Public water; Public sewer; Electricity available on property
- Home design: Single family residence; House structure; Resale property; Built in 2016
- Construction: Vinyl siding; Other roof
- Exterior features: Private lot
Interior
- Kitchen: Refrigerator included
- Bedrooms: 4 bedrooms
- Flooring: Carpet; Laminate
- Bathrooms: 3 full bathrooms and 1 half bathroom; Main level half bath
- Heating & cooling: Electric heating; Electric cooling
- Interior features: Two-level layout; Family room; Laundry room; One fireplace
- Laundry & utility: Laundry room (other features)
Neighborhood map
What this means for you Summary
Snapshot
- This is a 4-bed/2.5-bath single-family listed at $272k.
Deal economics
- At list price, monthly cash flow is $344 ($4k/yr) — positive.
- The deal already cash-flows at list — no discount required.
- To meet the 1% rule (rent ≥ 1% of price), the offer needs to be $265k (2.4% below list).
- Recommended offer: $263k (3.0% below list) — sets the bar for market timing.
- Cap rate 7.8% vs local median 4.5% in Perry — top-decile yield for the area; either an underpriced asset or a hidden risk that comps aren't pricing in. Stress-test before assuming the spread holds.
Location & tenants
- Location reads 68/100 on livability (#149 in GA) — a middle-class / working-renter tenant base. Strengths: cost of living A+, housing A+, crime B+; Watch: amenities F, commute F, health & safety F.
- Houston County (urban): math 43% / reading 46% proficiency, ranked #23 of 174 in GA (top 13%) — families likely to look elsewhere, expect single-tenant / working-renter base with shorter leases.
- Zoned schools: Matthew Arthur Elementary School (math 72% / reading 71%, grade A-, #47 of 1,228 statewide, top 4%, 873 students, 29% FRL); Bonaire Middle School (math 67% / reading 68%, grade A-, #21 of 470 statewide, top 4%, 1,140 students, 32% FRL); Veterans High School (math 33% / reading 32%, grade F, #104 of 424 statewide, top 25%, 1,914 students, 30% FRL) — zoned schools average 30% FRL vs 46% district-wide (15 pts lower); this property's tenant base skews higher-income than the district average.
- Zoned-school proficiency averages 57% at this address vs 44% district-wide (+13 pts) — the actual schools serving this property are materially stronger than the Houston County average implies; a family-tenant draw the district grade alone would hide.
- Market conditions: 258 active listings in the ZIP; 8 comparable units currently listed for rent nearby; rentals at typical pace (median 23d on market — plan ~3-4 weeks tenant-placement turnaround); high-income renter base; 1,545 units permitted in Houston County in 2024 (336 in 5+ unit buildings).
Forward outlook
- Local home prices are declining (-3.0%/yr); year-one equity from $2k of loan paydown is wiped out by about $8k of value loss. Plan a longer hold.
- Houston County population projected at +22% by 2050 — long-run rental-demand tailwind backs the buy-and-hold thesis.
Negotiation context
- It's been on market 38 days — a 3% lower offer ($263k) is reasonable based on typical stale-listing flexibility.
- 8 sale attempts since 10y ago with the ask held roughly flat each time — persistent listings suggest the price (not the market) is what's stuck; bring a comps-based counter.
Risks & watch-outs
- Climate carrying-cost: major wind risk, 78% chance of damaging wind over 30y; extreme-heat days projected 7→19/yr by 2055 (HVAC capex compounding) — expect insurance premiums to compound above CPI over the hold.
Questions for the listing agent
- It's been on market 38 days. Have you received any prior offers? Is the seller open to a 3% concession, seller financing, or rate buy-down credit?
- What does the HOA fee cover, when was the last increase, and are there any pending special assessments or reserve-fund shortfalls?
- Is there a deadline driving the sale (1031 exchange, divorce, estate, relocation)? That informs how much negotiation room exists.
- What's the average days-on-market for RENTAL listings here right now (not sales)? A rising rental-DOM trend means longer vacancies and softer asking-rent achievability than the comps imply.
- What's the recent tenant-quality profile in this submarket — average credit score on applications, eviction rate, late-payment / NSF rate, and stable-employment percentage? A property-management company in the area should have these aggregated.
- How much new for-sale + rental construction is in the pipeline within 1–3 miles? Heavy new supply typically softens prices + rents 12–24 months out; constrained supply supports both.
Investment metrics
- 1% rule
- 0.98% ✗
- Cap rate
- 7.81%
- Cash-on-cash
- 5.44%
- DSCR
- 1.24
- GRM
- 8.5
CMA / ARV
- ARV (median comp)
- $357,588
- List price
- $271,500
- Delta
- -24.07%
- Verdict
- UNDERPRICED
- Comps
- 20 within 1.0 mi
Show comp detail 12 sales within ~0.75 mi
| Address | Dist | Beds/Ba | Sqft | Sold | Price | $/sf | Match |
|---|---|---|---|---|---|---|---|
| 318 Flowing Meadows Dr | 0.16mi | 4/2.5 | 2,324 (+2%) | 6mo | $280,000 | $120 | 84 |
| 204 Flowing Meadows Dr | 0.28mi | 4/2.5 | 2,382 (+5%) | 4mo | $287,500 | $121 | 76 |
| 404 Rolling Acres Dr | 0.06mi | 4/2.5 | 2,613 (+15%) | 3mo | $354,000 | $135 | 70 |
| 126 Blue Mist Ln | 0.69mi | 4/3.0 | 2,299 (+1%) | 2mo | $405,000 | $176 | 62 |
| 310 Rolling Acres Dr | 0.24mi | 3/2.0 (-1) | 1,979 (-13%) | 1mo | $340,000 | $172 | 60 |
| 124 Blue Mist Ln | 0.69mi | 4/2.0 | 2,328 (+2%) | 3mo | $395,000 | $170 | 59 |
| 106 Gracetree Way | 0.53mi | 4/3.0 | 2,435 (+7%) | 5mo | $402,000 | $165 | 57 |
| 129 Windborne Ct | 0.37mi | 4/3.0 | 2,598 (+14%) | 1mo | $480,700 | $185 | 56 |
| 202 Brook Hollow Ct | 0.56mi | 5/3.0 (+1) | 2,414 (+6%) | 4mo | $410,000 | $170 | 53 |
| 107 Windborne Ct | 0.52mi | 5/3.0 (+1) | 2,472 (+9%) | 2mo | $422,900 | $171 | 53 |
| 110 Bella Ct | 0.66mi | 4/2.5 | 2,558 (+12%) | 2mo | $374,900 | $147 | 47 |
| 307 Foxberry Nook | 0.69mi | 5/3.0 (+1) | 2,569 (+13%) | 3mo | $420,000 | $163 | 36 |
Match score weights: distance 35% · size 25% · config 20% · recency 20%. Top-matched comps best support the ARV.
Projected returns pro-forma
-3.0% appreciation · 3.0% rent growth · sell at horizon
- IRR
- -7.9%
- Equity multiple
- 0.71×
- Total profit
- $-22,100
- Equity at exit
- $40,482
- IRR
- 1.6%
- Equity multiple
- 1.12×
- Total profit
- $8,842
- Equity at exit
- $23,474
Cash invested: $76,020 (down + closing). Projections, not guarantees.
Landlord ↔ Tenant lean methodology
- Overall (STATE)
- 90 Strongly Landlord-Friendly
- State Georgia
- 90 Strongly Landlord-Friendly · R+3
- County
- — inherits STATE
- City
- — inherits STATE
ZIP-level market 31047
- Home prices YoY
- -14.4%
- Active inventory
- 258
- Price-to-rent
- 8.5×
Monthly cashflow live
- Estimated rent
- $2,650 high interval (Pro) →
- Mortgage (P&I)
- −$1,424
- Tax from tax record
- −$197 /mo · $2,365/yr
- Insurance
- −$113
- HOA
- −$15
- Vacancy / Maint / Mgmt
- −$556
- Net cashflow
- $344
Break-even live
Sensitivity live
| Price | -10% $498 | -5% $421 | +0% $344 | +5% $268 | +10% $191 |
|---|---|---|---|---|---|
| Rent | -10% $135 | -5% $240 | +0% $344 | +5% $449 | +10% $554 |
| Rate | -1.0pp $481 | -0.5pp $413 | base $344 | +0.5pp $274 | +1.0pp $202 |
UW: 25.0% down · 7.5% · 30yr · 1.5% tax · 5.0% vac · 8.0% maint · 8.0% mgmt
Financing live
Cash to close
- Down payment
- $67,875
- Closing costs
- $8,145
- Reserves months
- —
- Total cash needed
- —
Loan-product check · same deal, 3 products live
Conventional
25% down · 7.5% · 30yr
- Down + closing
- —
- Monthly P&I
- —
- Monthly cashflow
- —
- DSCR
- —
- Eligible?
- —
Personal DTI + credit; lowest rate.
DSCR
20% down · 8.5% · 30yr
- Down + closing
- —
- Monthly P&I
- —
- Monthly cashflow
- —
- DSCR
- —
- Eligible?
- —
No personal income docs; deal must DSCR.
Hard money
10% down · 12.0% · 12mo
- Down + closing
- —
- Monthly P&I
- —
- Monthly cashflow
- —
- DSCR
- —
- Eligible?
- —
Short-term bridge; refi at stabilization.
Rent comps 8 comps
| Address | Beds | Baths | Sqft | Rent | $/sqft | DOM | Units | Dist |
|---|---|---|---|---|---|---|---|---|
| 109 Hidesta Ct Kathleen, GA | 5.0 | 3.0 | 2657 | $2,575 | $0.97 | 45d | 1 | 0.23mi |
| 609 Bristleleaf Path , GA | 3.0 | 2.0 | 1675 | $2,250 | $1.34 | 22d | 1 | 0.93mi |
| 307 Willowbrook Ln Kathleen, GA | 3.0 | 2.0 | 1675 | $2,150 | $1.28 | 22d | 1 | 0.94mi |
| 307 Willowbrook Ln Kathleen, GA | 3.0 | 2.0 | 1675 | $2,100 | $1.25 | 45d | 1 | 0.94mi |
| 513 Bristleleaf Path , GA | 3.0 | 2.0 | 1675 | $2,250 | $1.34 | 22d | 1 | 0.94mi |
| 531 Bristleleaf Path , GA | 3.0 | 2.0 | 1620 | $2,250 | $1.39 | 45d | 1 | 0.94mi |
| 521 Bristleleaf Path , GA | 3.0 | 2.0 | 1675 | $2,250 | $1.34 | 22d | 1 | 0.94mi |
| 531 Bristleleaf Path , GA | 3.0 | 2.0 | 1620 | $2,250 | $1.39 | 22d | 1 | 1.11mi |
HOA detail
- Monthly dues
- $15 · $180/yr
Listing history 37 events
-
2026-06-21days on market $271,500 Active 38 DOM
-
2026-06-19days on market $271,500 Active 36 DOM
-
2026-06-18days on market $271,500 Active 35 DOM
-
2026-06-17days on market $271,500 Active 34 DOM
Show marketing remark (98 chars)
Lots of room in this 4 bedroom 2.5 bath with open floorplan. Formal dining and large main bedroom.
-
2026-06-16days on market $271,500 Active 33 DOM
-
2026-06-15days on market $271,500 Active 32 DOM
-
2026-06-14days on market $271,500 Active 30 DOM
-
2026-06-13days on market $271,500 Active 29 DOM
-
2026-06-10days on market $271,500 Active 27 DOM
-
2026-06-09days on market $271,500 Active 26 DOM
-
2026-06-08days on market $271,500 Active 25 DOM
-
2026-06-07days on market $271,500 Active 24 DOM
-
2026-06-05days on market $271,500 Active 21 DOM
-
2026-06-03days on market $271,500 Active 20 DOM
-
2026-06-02days on market $271,500 Active 19 DOM
-
2026-06-01days on market $271,500 Active 18 DOM
-
2026-05-31days on market $271,500 Active 17 DOM
-
2026-05-30days on market $271,500 Active 16 DOM
-
2026-05-13$271,500 Active 98-char remark
Show marketing remark (98 chars)
Lots of room in this 4 bedroom 2.5 bath with open floorplan. Formal dining and large main bedroom.
-
2026-05-13$271,500 New 98-char remark
Show marketing remark (98 chars)
Lots of room in this 4 bedroom 2.5 bath with open floorplan. Formal dining and large main bedroom.
-
2026-05-13$271,500 Active
Show marketing remark (98 chars)
Lots of room in this 4 bedroom 2.5 bath with open floorplan. Formal dining and large main bedroom.
-
2024-05-14soldstatus $297,000
-
2024-05-09soldstatus $297,000 Closed
-
2024-05-09soldstatus $297,000 Sold
-
2024-03-28status Under Contract
-
2024-03-28status Pending
-
2024-03-18price $295,000
-
2024-03-18price $295,000
-
2024-02-08$300,000 Active
-
2024-01-16$300,000 New
-
2020-11-20soldstatus $225,000
-
2020-11-10soldstatus $225,000
-
2020-10-09$225,000
-
2016-05-11soldstatus $185,500
-
2016-05-11soldstatus $185,500
-
2016-02-04$185,500
-
2016-02-04$185,500
ⓘ Source: listings_history table (triggers on properties + properties_extension) + one-shot
backfill from property_details.listing_events for pre-trigger history.
Tax reassessment forecast GA · Resets to sale price
- Current annual tax
- $2,365 · $197/mo
- Projected year-2 tax
- $2,498 · $208/mo
- Expected delta
- +$132/yr (+$11/mo · 5.6%)
ⓘ Screening estimate from a state-policy table — verify with the county assessor before closing.
Climate risk First Street
- Flood 1/10 Low FEMA zone X (unshaded) · 0% chance over 30 yrs
- Wildfire 4/10 Moderate
- Heat 7/10 Severe 7 d/yr ≥109°F today · 19 d/yr by 30 yrs out
- Wind 7/10 Severe 78% chance of damaging wind over 30 yrs
- Air quality 3/10 Moderate 3 unhealthy d/yr today · 4 by 30 yrs out
Nearby sold comps map
Loading sold comps map…
Walkable amenities ~0.75 mi
Loading nearby amenities…
Taxation est. · year 1
- Rental income
- $31,798
- − Mortgage interest
- −$15,208
- − Property taxes
- −$2,365
- − Insurance
- −$1,358
- − Repairs & maintenance
- −$2,544
- − Management
- −$2,544
- − HOA
- −$180
- − Depreciation
- −$7,898
- Taxable loss
- −$299
- Est. tax savings @ 24.0%
- +$72
- After-tax cash flow
- $4,204/yr
For passive investors: Depreciation is non-cash, so a rental often shows a tax loss while cash-flowing — sheltering income. Rental losses are passive: they offset passive income freely, and up to $25,000/yr can offset ordinary (W-2) income if you actively participate and your MAGI is under $100k (phasing out to $0 by $150k); unused losses carry forward. On sale, claimed depreciation is recaptured at up to 25%, and gains may owe capital-gains tax (a 1031 exchange can defer both). Figures are a year-1 estimate at your 24.0% rate — not tax advice; consult a CPA.
Schools (NCES district)
- District
- Houston County
- NCES district ID
- 1302880
- Math proficiency
- 43% ▼ -7.00%
- Reading proficiency
- 46% ▼ -2.00%
- Median HH income
- $54,823
- Composite
- 38.68/100
- National rank
- #4144
- State rank
- #23 of 174 in GA
Livability — Perry
- Score
- 68/100
- State rank
- #149
- US rank
- #9757
Category grades
Schools grade is shown separately in the Schools card above.
Census & demographics
- Census place
- Perry, GA
- County
- Houston County · 157,321 people
- City population
- 22,953
- Metro
- Warner Robins, GA
- Population (ZIP)
- 20,203
- Household income
- $117,332
- Rent vs Own
- Severe rent burden
- 11.0
Population outlook (Houston County) Hauer SSP2
- Today (2025)
- 169,502 people
- By 2030
- 178,486 · +5.3%
- By 2040
- 194,642 · +14.8%
- By 2050
- 207,119 · +22.2%
- By 2075
- 231,480 · +36.6%
- By 2100
- 235,034 · +38.7%
Race, ethnicity, and origin ACS 2023
- Neighborhood character
- Majority White (65%)
- Race & ethnicity
- White 65% Black 18% Two or more races 12% Hispanic / Latino 8% Asian 3%
- Hispanic origin (detail)
- Mexican 3% Cuban 2%
- Common ancestry
- Italian 3% Slovak 3% Lithuanian 1%
- Foreign-born
- 6% · Canada, South Korea, Jamaica
- Languages at home
- 94% English-only · Spanish 4% Korean 1% Tagalog/Filipino 1%
Political lean MEDSL · Houston
- 2024 margin
- R (+11.3) · D 44.0% · R 55.3%
- 2008→2024 swing
- +8.9pp toward D · 2008: -20.2pp · 2024: -11.3pp
- All cycles
- 2024: R+11.3 2020: R+12.4 2016: R+21.6 2012: R+20.7 2008: R+20.2
Not yet ingested
- Civics
- —
Market trends
- HPI YoY
- ▼ -36.77%
- Current HPI
- 218.1333
- Rent YoY
- —
- Metro
- Warner Robins, GA
- State GDP YoY
- ▲ 2.66%
- F500 in state
- 28
Industry mix (Fortune 500 HQ in GA)
| Industry | F500 HQs | Revenue |
|---|---|---|
| Paper / Packaging | 2 | $29B |
|
||
| Retail | 1 | $160B |
|
||
| Transportation / Logistics | 1 | $91B |
|
||
| Airlines | 1 | $62B |
|
||
| Consumer Goods | 1 | $47B |
|
||
| Utilities | 1 | $25B |
|
||
Price history
+42.9% since first listed20 events — show timeline
- 2026-06-17 Price Changed $265,000 CGMLS
- 2026-05-13 Listed $271,500 MGMLS
- 2026-05-13 Listed $271,500 GAMLS
- 2026-05-13 Listed $271,500 CGMLS
- 2024-05-14 Sold (Public Records) $297,000 Public Records
- 2024-05-09 Sold (MLS) $297,000 CGMLS
- 2024-05-09 Sold (MLS) $297,000 GAMLS
- 2024-03-28 Pending — GAMLS
- 2024-03-28 Pending — CGMLS
- 2024-03-18 Price Changed $295,000 GAMLS
- 2024-03-18 Price Changed $295,000 CGMLS
- 2024-02-08 Listed $300,000 CGMLS
- 2024-01-16 Listed $300,000 GAMLS
- 2020-11-20 Sold (Public Records) $225,000 Public Records
- 2020-11-10 Sold (MLS) $225,000 CGMLS
- 2020-10-09 Listed $225,000 CGMLS
- 2016-05-11 Sold (MLS) $185,500 CGMLS
- 2016-05-11 Sold (MLS) $185,500 GAMLS
- 2016-02-04 Listed $185,500 CGMLS
- 2016-02-04 Listed $185,500 GAMLS
Property tax history
+38.0%/yrLatest (2025): $2,365 · +0.0% YoY. Source: county tax records.
Cash-flow waterfall
monthlySold comps — $/sqft
last 12 mo · ≤1 miLoading sold comps…