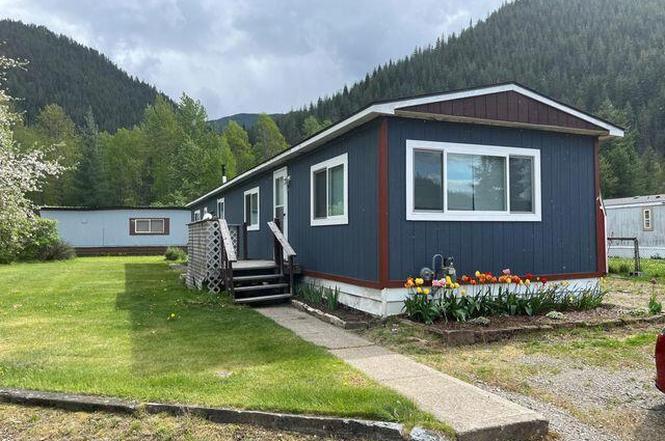
1600 West Yellowstone #31 · Osburn, ID
Flood risk No data
- FEMA flood zone
- —
- Chance of flooding over 30 yrs
- —
- Est. flood insurance / yr
- —
Fire risk No data
- Est. fire insurance / yr
- —
Heat risk No data
- Hot days now (above threshold)
- —
- Hot days in 30 yrs
- —
Wind risk No data
- Chance of severe wind over 30 yrs
- —
Air-quality risk No data
- Unhealthy air days now
- —
- Unhealthy air days in 30 yrs
- —
Risk factors via First Street. Map © Google.
Why this score? — see what drove the C- grade
The composite is a weighted blend of 9 inputs, each scored 0–100. Each bar is that input's sub-score; the figure is the points it added to the 100-point composite (weight × sub-score).
- Cash flow +21.4/30.0
- ARV discount +7.5/15.0
- DSCR +6.8/10.0
- 1% rule +5.6/10.0
- Schools +3.4/10.0
- Livability +3.2/5.0
- Rent growth +2.5/5.0
- Condition / age +2.5/5.0
- Appreciation +0.0/10.0
$80,000
🖨 Deal sheet 📄 Offer letter ✓ Due diligence
Listing remarks
a spacious, two bedroom, two bath located in a nice park of Osburn. Close to Rails to Trails and Gene Day Park
Key facts
- Built 1980
- Listed 169 days
Property features AI
Finance
- Other: Multifamily/common walls: No common walls
- Financial info: Financial details not provided
- HOA & community: HOA information not provided
Exterior
- Parking: Parking details not provided
- Security: No security features listed
- Utilities: Public water; Community sewer
- Home design: Manufactured home
- Construction: T1-11 exterior; Composition roof; Crawl space foundation (see remarks)
- Exterior features: Open, level lot; Publicly maintained paved road; Has a view
Interior
- Kitchen: Electric range; Refrigerator; Dishwasher not listed
- Bedrooms: 2 main-level bedrooms
- Flooring: Laminate flooring; Carpet
- Bathrooms: 2 main-level bathrooms
- Heating & cooling: Natural gas heating; Forced air
- Interior features: Electric Range; Electric Dryer; Washer; Refrigerator
- Laundry & utility: Washer; Electric dryer hookup
Neighborhood map
What this means for you Summary
Snapshot
- This is a 2-bed/2.0-bath single-family listed at $80k.
Deal economics
- At list price, monthly cash flow is $118 ($1k/yr) — positive.
- The deal already cash-flows at list — no discount required.
- Meets the 1% rule at list price ($850 rent vs $80k).
- Recommended offer: $70k (12.0% below list) — sets the bar for market timing.
Location & tenants
- Location reads 64/100 on livability (#141 in ID) — a middle-class / working-renter tenant base. Strengths: cost of living A+, housing A+, crime A-; Watch: schools D, amenities F, commute F.
- Kellogg Joint District (rural): math 28% / reading 53% proficiency, ranked #66 of 92 in ID (top 72%) — families likely to look elsewhere, expect single-tenant / working-renter base with shorter leases.
- Market conditions: 20 active listings in the ZIP; 36 units permitted in Shoshone County in 2024 (0 in 5+ unit buildings).
Forward outlook
- Local home prices are declining (-3.0%/yr); year-one equity from $553 of loan paydown is wiped out by about $2k of value loss. Plan a longer hold.
- Shoshone County population projected at -18% by 2050 — secular population decline; favor cash flow + early exit over multi-decade hold.
Negotiation context
- It's been on market 170 days — a 12% lower offer ($70k) is reasonable based on typical stale-listing flexibility.
- 2 sale attempts with the ask held roughly flat each time — persistent listings suggest the price (not the market) is what's stuck; bring a comps-based counter.
Questions for the listing agent
- It's been on market 170 days. Have you received any prior offers? Is the seller open to a 12% concession, seller financing, or rate buy-down credit?
- Why hasn't it sold? Are there any deal-killer items the seller is aware of (foundation, flood, title, zoning, code violations)?
- Is there a deadline driving the sale (1031 exchange, divorce, estate, relocation)? That informs how much negotiation room exists.
- Schools are D-rated, which usually means shorter tenancies and higher turnover. Who's the typical renter profile here, and what's been the actual vacancy rate?
- What's the average days-on-market for RENTAL listings here right now (not sales)? A rising rental-DOM trend means longer vacancies and softer asking-rent achievability than the comps imply.
- What's the recent tenant-quality profile in this submarket — average credit score on applications, eviction rate, late-payment / NSF rate, and stable-employment percentage? A property-management company in the area should have these aggregated.
- How much new for-sale + rental construction is in the pipeline within 1–3 miles? Heavy new supply typically softens prices + rents 12–24 months out; constrained supply supports both.
Investment metrics
- 1% rule
- 1.06% ✓
- Cap rate
- 8.07%
- Cash-on-cash
- 6.34%
- DSCR
- 1.28
- GRM
- 7.8
CMA / ARV
No comps found within radius.
Projected returns pro-forma
-3.0% appreciation · 3.0% rent growth · sell at horizon
- IRR
- -6.5%
- Equity multiple
- 0.76×
- Total profit
- $-5,411
- Equity at exit
- $11,928
- IRR
- 3.1%
- Equity multiple
- 1.23×
- Total profit
- $5,049
- Equity at exit
- $6,917
Cash invested: $22,400 (down + closing). Projections, not guarantees.
Landlord ↔ Tenant lean methodology
- Overall (STATE)
- 91 Strongly Landlord-Friendly
- State Idaho
- 91 Strongly Landlord-Friendly · R+18
- County
- — inherits STATE
- City
- — inherits STATE
ZIP-level market 83849
- Home prices YoY
- -16.4%
- Active inventory
- 20
- Price-to-rent
- 7.8×
Monthly cashflow live
- Estimated rent
- $850 medium interval (Pro) →
- Mortgage (P&I)
- −$420
- Tax est. 1.5%
- −$100 /mo · $1,200/yr
- Insurance
- −$33
- HOA
- −$0
- Vacancy / Maint / Mgmt
- −$178
- Net cashflow
- $118
Break-even live
UW: 25.0% down · 7.5% · 30yr · 1.5% tax · 5.0% vac · 8.0% maint · 8.0% mgmt
Financing live
Cash to close
- Down payment
- $20,000
- Closing costs
- $2,400
- Reserves months
- —
- Total cash needed
- —
Loan-product check · same deal, 3 products live
Conventional
25% down · 7.5% · 30yr
- Down + closing
- —
- Monthly P&I
- —
- Monthly cashflow
- —
- DSCR
- —
- Eligible?
- —
Personal DTI + credit; lowest rate.
DSCR
20% down · 8.5% · 30yr
- Down + closing
- —
- Monthly P&I
- —
- Monthly cashflow
- —
- DSCR
- —
- Eligible?
- —
No personal income docs; deal must DSCR.
Hard money
10% down · 12.0% · 12mo
- Down + closing
- —
- Monthly P&I
- —
- Monthly cashflow
- —
- DSCR
- —
- Eligible?
- —
Short-term bridge; refi at stabilization.
Listing history 20 events
-
2026-06-19days on market $80,000 Active 170 DOM
-
2026-06-18days on market $80,000 Active 169 DOM
-
2026-06-17days on market $80,000 Active 168 DOM
-
2026-06-16days on market $80,000 Active 167 DOM
-
2026-06-15days on market $80,000 Active 166 DOM
-
2026-06-14days on market $80,000 Active 164 DOM
-
2026-06-13days on market $80,000 Active 163 DOM
-
2026-06-10days on market $80,000 Active 161 DOM
-
2026-06-09days on market $80,000 Active 160 DOM
-
2026-06-08days on market $80,000 Active 159 DOM
-
2026-06-07days on market $80,000 Active 158 DOM
-
2026-06-05days on market $80,000 Active 155 DOM
-
2026-06-03days on market $80,000 Active 154 DOM
-
2026-06-02days on market $80,000 Active 153 DOM
-
2026-06-01days on market $80,000 Active 152 DOM
-
2026-05-31days on market $80,000 Active 151 DOM
-
2026-05-30days on market $80,000 Active 150 DOM
-
2026-01-24status Active
-
2026-01-09status Pending
-
2025-12-15$80,000 Active
ⓘ Source: listings_history table (triggers on properties + properties_extension) + one-shot
backfill from property_details.listing_events for pre-trigger history.
Nearby sold comps map
Loading sold comps map…
Walkable amenities ~0.75 mi
Loading nearby amenities…
Taxation est. · year 1
- Rental income
- $10,196
- − Mortgage interest
- −$4,481
- − Property taxes
- −$1,200
- − Insurance
- −$400
- − Repairs & maintenance
- −$816
- − Management
- −$816
- − Depreciation
- −$2,327
- Taxable income
- $156
- Est. tax owed @ 24.0%
- −$37
- After-tax cash flow
- $1,383/yr
For passive investors: Depreciation is non-cash, so a rental often shows a tax loss while cash-flowing — sheltering income. Rental losses are passive: they offset passive income freely, and up to $25,000/yr can offset ordinary (W-2) income if you actively participate and your MAGI is under $100k (phasing out to $0 by $150k); unused losses carry forward. On sale, claimed depreciation is recaptured at up to 25%, and gains may owe capital-gains tax (a 1031 exchange can defer both). Figures are a year-1 estimate at your 24.0% rate — not tax advice; consult a CPA.
Schools (NCES district)
- District
- Kellogg Joint District
- NCES district ID
- 1601650
- Math proficiency
- 28% ▼ -10.00%
- Reading proficiency
- 53% ▼ -4.00%
- Median HH income
- $38,044
- Composite
- 33.67/100
- National rank
- #5389
- State rank
- #66 of 92 in ID
Livability — Osburn
- Score
- 64/100
- State rank
- #141
- US rank
- #13676
Category grades
Schools grade is shown separately in the Schools card above.
Census & demographics
- Population (ZIP)
- 2,057
Population outlook (Shoshone County) Hauer SSP2
- Today (2025)
- 11,864 people
- By 2030
- 11,416 · -3.8%
- By 2040
- 10,462 · -11.8%
- By 2050
- 9,693 · -18.3%
- By 2075
- 8,438 · -28.9%
- By 2100
- 7,028 · -40.8%
Race, ethnicity, and origin ACS 2023
- Neighborhood character
- Predominantly White (87%)
- Race & ethnicity
- White 87% Hispanic / Latino 8% Two or more races 7% Black 1%
- Hispanic origin (detail)
- Mexican 3%
- Common ancestry
- Portuguese 5% Slovak 4% Lithuanian 4%
- Foreign-born
- 2% · Canada
- Languages at home
- 96% English-only · German/W. Germanic 2% Spanish 1% Russian/Polish/Slavic 1%
Political lean MEDSL · Shoshone
- 2024 margin
- Solid R (+49.4) · D 24.0% · R 73.4% · Other 2.6%
- 2008→2024 swing
- -41.8pp toward R · 2008: -7.6pp · 2024: -49.4pp
- All cycles
- 2024: R+49.4 2020: R+41.7 2016: R+37.4 2012: R+8.2 2008: R+7.6
Not yet ingested
- Civics
- —
Market trends
- HPI YoY
- ▼ -50.12%
- Current HPI
- 255.32
- Rent YoY
- —
- Metro
- —
- State GDP YoY
- ▲ 4.51%
- F500 in state
- 6
Industry mix (Fortune 500 HQ in ID)
| Industry | F500 HQs | Revenue |
|---|---|---|
| Retail | 1 | $79B |
|
||
| Technology | 1 | $25B |
|
||
| Food / Agriculture | 1 | $6B |
|
||
Price history
3 events — show timeline
- 2026-01-24 Relisted — CDAMLS
- 2026-01-09 Pending — CDAMLS
- 2025-12-15 Listed $80,000 CDAMLS
Cash-flow waterfall
monthlySold comps — $/sqft
last 12 mo · ≤1 miLoading sold comps…