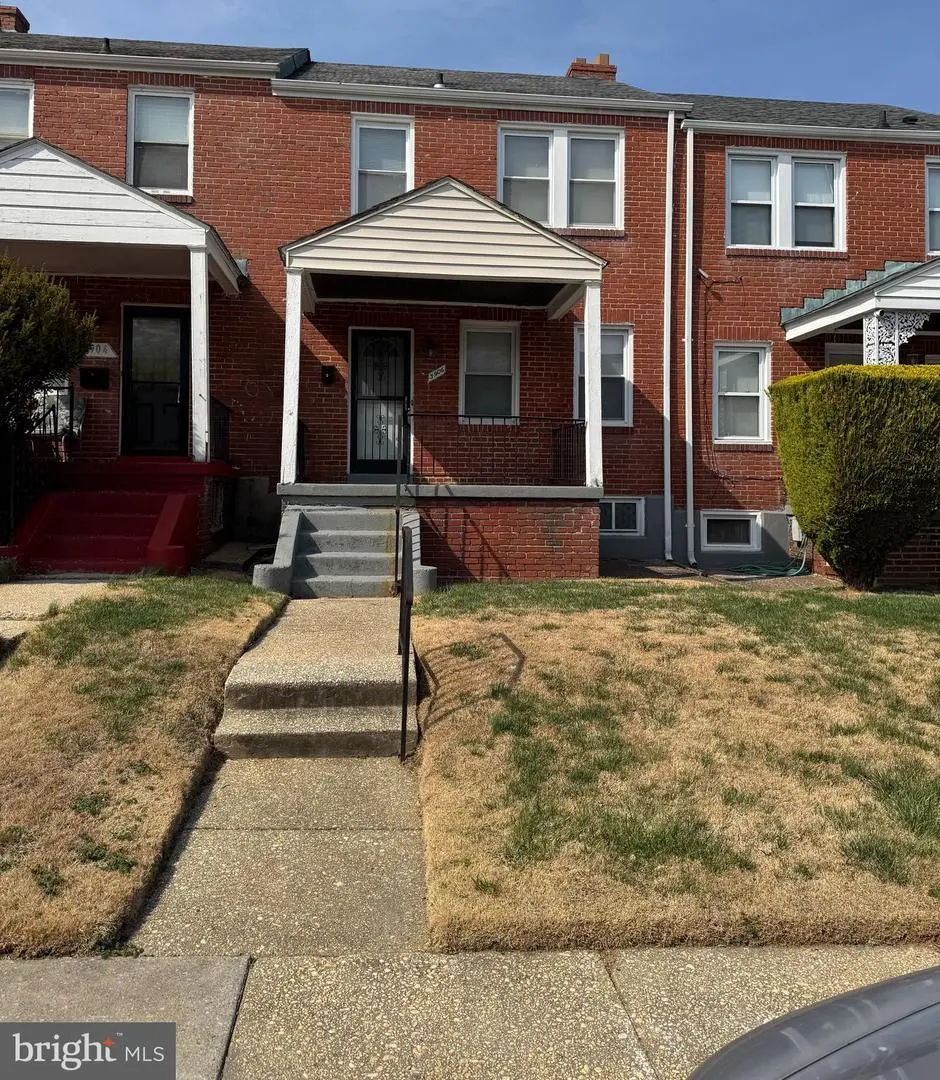
3906 Grantley Rd · Baltimore, MD
Flood risk 1/10 · Minimal
- FEMA flood zone
- X (unshaded)
- Chance of flooding over 30 yrs
- 0.0%
- Est. flood insurance / yr
- $473 – $860
Fire risk 1/10 · Minimal
- Est. fire insurance / yr
- $755 – $1,403
Heat risk 7/10 · Major
- Hot days now (above 104°F)
- 7 days/yr
- Hot days in 30 yrs
- 15 days/yr
Wind risk 6/10 · Moderate
- Chance of severe wind over 30 yrs
- 27.0%
Air-quality risk 3/10 · Minor
- Unhealthy air days now
- 3 days/yr
- Unhealthy air days in 30 yrs
- 4 days/yr
Risk factors via First Street. Map © Google.
Why this score? — see what drove the D grade
The composite is a weighted blend of 9 inputs, each scored 0–100. Each bar is that input's sub-score; the figure is the points it added to the 100-point composite (weight × sub-score).
- Cash flow +19.8/30.0
- DSCR +6.3/10.0
- 1% rule +6.0/10.0
- Livability +3.8/5.0
- Rent growth +3.1/5.0
- Condition / age +2.5/5.0
- ARV discount +1.4/15.0
- Schools +1.0/10.0
- Appreciation +0.0/10.0
$139,000
🖨 Deal sheet 📄 Offer letter ✓ Due diligence
Listing remarks
$10,000 Price Improvement! Welcome to 3906 Grantley Road, a promising opportunity in the heart of Baltimore! This 3-bedroom, 1.5-bath rowhome is nestled in a well-established neighborhood known for its long-time residents and strong sense of community. Priced to sell and offered "AS IS", this property is perfect for a buyer with vision. Whether you're a first-time homebuyer looking to customize your dream home using a 203(k) renovation loan, or an investor seeking your next value-add project, this home offers incredible potential. With solid bones and a desirable location, this is your chance to create something special while building equity. Don’t miss out on this opportuni
Key facts
- Built 1955
- Listed 28 days
Neighborhood map
What this means for you Summary
Snapshot
- This is a 3-bed/1.0-bath townhouse listed at $139k.
Deal economics
- At list price, monthly cash flow is $165 ($2k/yr) — positive.
- The deal already cash-flows at list — no discount required.
- Meets the 1% rule at list price ($2k rent vs $139k).
- Recommended offer: $137k (1.5% below list) — sets the bar for market timing.
- Cap rate 7.7% vs local median 6.0% in Baltimore — meaningfully above typical; check what's discounted (condition, days-on-market, listing class) to confirm the premium yield is real.
Location & tenants
- Location reads 76/100 on livability (#90 in MD, #3,396 nationally) — a middle-class / working-renter tenant base. Strengths: amenities A+, commute A+, housing A+; Watch: schools D, crime F.
- Baltimore City Public Schools (urban): math 7% / reading 16% proficiency, ranked #24 of 24 in MD (top 100%) — low school quality limits family demand, transient renter base, plan for 1-2y turnover; 79% free/reduced lunch — lower-income household profile, screen leases tightly.
- Market conditions: Rents rising (+2.4%/yr); 351 active listings in the ZIP; 40 comparable units currently listed for rent nearby; rentals at typical pace (median 24d on market — plan ~3-4 weeks tenant-placement turnaround); 45% of comp listings sitting > 30 days — soft ceiling on asking rent; 1,273 units permitted in Baltimore city in 2024 (1,104 in 5+ unit buildings).
- This rent runs 35% of the median local income ($52k/yr) — at the standard rent-burdened threshold; future hikes will face affordability resistance.
Forward outlook
- Local home prices are declining (-3.0%/yr); year-one equity from $961 of loan paydown is wiped out by about $4k of value loss. Plan a longer hold.
- Baltimore County population projected to shrink 4% by 2050 — rents likely to lag national; underwrite the cash flow, not the appreciation.
Negotiation context
- It's been on market 28 days — a 2% lower offer ($137k) is reasonable based on typical stale-listing flexibility.
Risks & watch-outs
- Watch-outs: built in 1955 — expect roof / HVAC / electrical / plumbing capex.
- Climate carrying-cost: major wind risk, 27% chance of damaging wind over 30y; extreme-heat days projected 7→15/yr by 2055 (HVAC capex compounding) — expect insurance premiums to compound above CPI over the hold.
Questions for the listing agent
- Built in 1955 — when were the roof, HVAC, electrical panel, plumbing, and water heater last replaced?
- Is there a deadline driving the sale (1031 exchange, divorce, estate, relocation)? That informs how much negotiation room exists.
- Schools are D-rated, which usually means shorter tenancies and higher turnover. Who's the typical renter profile here, and what's been the actual vacancy rate?
- Crime grade is F in this area — have there been break-ins, vandalism, or insurance claims at this property in the last 3 years? What carrier currently insures it and at what premium?
- The area grade is low — what's the realistic commute time and amenity access for the typical tenant pool here? Any planned neighborhood developments (good or bad) we should know about?
- What's the average days-on-market for RENTAL listings here right now (not sales)? A rising rental-DOM trend means longer vacancies and softer asking-rent achievability than the comps imply.
- What's the recent tenant-quality profile in this submarket — average credit score on applications, eviction rate, late-payment / NSF rate, and stable-employment percentage? A property-management company in the area should have these aggregated.
- How much new for-sale + rental construction is in the pipeline within 1–3 miles? Heavy new supply typically softens prices + rents 12–24 months out; constrained supply supports both.
Investment metrics
- 1% rule
- 1.10% ✓
- Cap rate
- 7.72%
- Cash-on-cash
- 5.09%
- DSCR
- 1.23
- GRM
- 7.6
CMA / ARV
- ARV (on-the-fly)
- $122,512
- Comps found
- 12
Show comp detail 12 sales within ~0.75 mi
| Address | Dist | Beds/Ba | Sqft | Sold | Price | $/sf | Match |
|---|---|---|---|---|---|---|---|
| 3906 Grantley Rd | 0.00mi | 3/1.5 | 1,178 (0%) | 1mo | $127,000 | $108 | 97 |
| 3701 Columbus Dr | 0.36mi | 3/1.0 | 1,200 (+2%) | 4mo | $108,000 | $90 | 77 |
| 3709 Columbus Dr | 0.39mi | 3/1.5 | 1,200 (+2%) | 0mo | $133,900 | $112 | 76 |
| 3716 Columbus Dr | 0.41mi | 4/2.0 (+1) | 1,200 (+2%) | 3mo | $242,000 | $202 | 66 |
| 3912 Reisterstown Rd | 0.44mi | 3/1.5 | 1,100 (-7%) | 1mo | $55,000 | $50 | 66 |
| 3741 Boarman Ave | 0.37mi | 3/1.0 | 1,280 (+9%) | 3mo | $115,000 | $90 | 66 |
| 3823 Cottage Ave | 0.65mi | 3/1.0 | 1,140 (-3%) | 3mo | $118,000 | $104 | 62 |
| 3841 Boarman Ave | 0.46mi | 3/2.0 | 1,249 (+6%) | 5mo | $52,250 | $42 | 60 |
| 3918 Dolfield Ave | 0.70mi | 3/1.5 | 1,216 (+3%) | 5mo | $200,000 | $164 | 55 |
| 3824 Beehler Ave | 0.58mi | 3/1.5 | 1,080 (-8%) | 3mo | $88,000 | $81 | 55 |
| 2644 Oswego Ave | 0.57mi | 3/2.5 | 1,299 (+10%) | 5mo | $205,000 | $158 | 46 |
| 3306 N Hilton St #202 | 0.64mi | 2/1.0 (-1) | 1,044 (-11%) | 3mo | $41,000 | $39 | 44 |
Match score weights: distance 35% · size 25% · config 20% · recency 20%. Top-matched comps best support the ARV.
Projected returns pro-forma
-3.0% appreciation · 2.41% rent growth · sell at horizon
- IRR
- -9.0%
- Equity multiple
- 0.67×
- Total profit
- $-12,835
- Equity at exit
- $20,725
- IRR
- -0.4%
- Equity multiple
- 0.97×
- Total profit
- $-991
- Equity at exit
- $12,018
Cash invested: $38,920 (down + closing). Projections, not guarantees.
Landlord ↔ Tenant lean methodology
- Overall (CITY)
- 12 Strongly Tenant-Friendly
- State Maryland
- 27 Tenant-Leaning · D+14
- County
- — inherits STATE
- City Baltimore
- 12 Strongly Tenant-Friendly · D+58
ZIP-level market 21215
- Rents YoY
- 2.4%
- Active inventory
- 351
- Price-to-rent
- 7.6×
Monthly cashflow live
- Estimated rent
- $1,523 high interval (Pro) →
- Mortgage (P&I)
- −$729
- Tax from tax record
- −$251 /mo · $3,012/yr
- Insurance
- −$58
- HOA
- −$0
- Vacancy / Maint / Mgmt
- −$320
- Net cashflow
- $165
Break-even live
UW: 25.0% down · 7.5% · 30yr · 1.5% tax · 5.0% vac · 8.0% maint · 8.0% mgmt
Financing live
Cash to close
- Down payment
- $34,750
- Closing costs
- $4,170
- Reserves months
- —
- Total cash needed
- —
Loan-product check · same deal, 3 products live
Conventional
25% down · 7.5% · 30yr
- Down + closing
- —
- Monthly P&I
- —
- Monthly cashflow
- —
- DSCR
- —
- Eligible?
- —
Personal DTI + credit; lowest rate.
DSCR
20% down · 8.5% · 30yr
- Down + closing
- —
- Monthly P&I
- —
- Monthly cashflow
- —
- DSCR
- —
- Eligible?
- —
No personal income docs; deal must DSCR.
Hard money
10% down · 12.0% · 12mo
- Down + closing
- —
- Monthly P&I
- —
- Monthly cashflow
- —
- DSCR
- —
- Eligible?
- —
Short-term bridge; refi at stabilization.
Rent comps 40 comps
| Address | Beds | Baths | Sqft | Rent | $/sqft | DOM | Units | Dist |
|---|---|---|---|---|---|---|---|---|
| 4008 Hilton Rd Unit 1st Fl Baltimore, MD | 2.0 | 1.0 | 750 | $1,295 | $1.73 | 43d | 1 | 0.23mi |
| 4037 Edgewood Rd Unit 1 Baltimore, MD | 2.0 | 1.0 | 726 | $1,100 | $1.52 | 43d | 1 | 0.24mi |
| 4230 Towanda Ave Baltimore, MD | 3.0 | 2.0 | 1400 | $1,800 | $1.29 | 17d | 1 | 0.33mi |
| 3508 Grantley Rd Baltimore, MD | 2.0 | 1.0 | 1250 | $1,350 | $1.08 | 23d | 1 | 0.37mi |
| 3784 Columbus Dr Baltimore, MD | 4.0 | 2.0 | 1250 | $2,200 | $1.76 | 23d | 1 | 0.54mi |
| 3701 Garrison Blvd Unit 3 Baltimore, MD | 2.0 | 1.0 | 820 | $1,399 | $1.71 | 23d | 1 | 0.57mi |
| 3600 Garrison Blvd Unit T2 Baltimore, MD | 2.0 | 1.0 | 750 | $1,149 | $1.53 | 23d | 1 | 0.62mi |
| 3600 Garrison Blvd Apt T1 Baltimore, MD | 2.0 | 1.0 | 800 | $1,125 | $1.41 | 3d | 1 | 0.62mi |
| 2619 Loyola Northway Baltimore, MD | 3.0 | 2.0 | 1400 | $1,995 | $1.43 | 23d | 1 | 0.66mi |
| 3904 Penhurst Ave Baltimore, MD | 2.0 | 1.0 | 760 | $1,175 | $1.55 | 43d | 1 | 0.68mi |
| 3822 Pall Mall Rd Baltimore, MD | 3.0 | 1.5 | 1320 | $1,875 | $1.42 | 43d | 1 | 0.68mi |
| 3735 Manchester Ave Baltimore, MD | 2.0 | 1.0 | 1000 | $1,350 | $1.35 | 4d | 1 | 0.68mi |
| 2915 Oakford Ave Baltimore, MD | 3.0 | 2.0 | 1102 | $1,600 | $1.45 | 17d | 1 | 0.73mi |
| 4828 Beaufort Ave Baltimore, MD | 2.0 | 2.5 | 1200 | $1,850 | $1.54 | 23d | 1 | 0.76mi |
| 2415 Loyola Southway Baltimore, MD | 3.0 | 1.5 | 1200 | $2,033 | $1.69 | 43d | 1 | 0.78mi |
| 3915 Liberty Heights Ave Gwynn Oak, MD | 1.0–2.0 | 1.0–2.0 | 680 | $1,345 | $1.98 | 12d | 5 | 0.78mi |
| 2454 W Cold Spring Ln Baltimore, MD | 3.0 | 1.0 | 1200 | $1,650 | $1.38 | 23d | 1 | 0.81mi |
| 4010 Fernhill Ave Unit 2 Baltimore, MD | 2.0 | 1.0 | 1100 | $1,500 | $1.36 | 43d | 1 | 0.84mi |
| 2824 Edgecombe Cir S Baltimore, MD | 2.0 | 2.0 | 950 | $1,475 | $1.55 | 21d | 1 | 0.85mi |
| 2905 Garrison Blvd Unit 21 Baltimore, MD | 2.0 | 1.0 | 800 | $1,175 | $1.47 | 43d | 1 | 0.88mi |
| 3908 Groveland Ave Apt F Baltimore, MD | 2.0 | 1.0 | 815 | $1,695 | $2.08 | 43d | 1 | 0.89mi |
| 5000 Litchfield Ave #1 Baltimore, MD | 2.0 | 1.0 | 1100 | $1,100 | $1.00 | 43d | 1 | 0.89mi |
| 3016 Thorndale Ave Baltimore, MD | 1.0–3.0 | 1.0 | 700 | $1,200 | $1.71 | 4d | 14 | 0.96mi |
| 3403 Carlisle Ave Apt 1 Baltimore, MD | 2.0 | 1.0 | 1100 | $1,600 | $1.45 | 11d | 1 | 0.97mi |
| 2530 Edgecombe Cir N Baltimore, MD | 2.0–3.0 | 1.0 | 920 | $1,325 | $1.44 | 2d | 4 | 1.02mi |
| 3001 Carlisle Ave Baltimore, MD | 3.0 | 1.0 | 1024 | $1,300 | $1.27 | 43d | 1 | 1.02mi |
| 2738 N Longwood St Baltimore, MD | 3.0 | 1.0 | 1024 | $1,399 | $1.37 | 43d | 1 | 1.03mi |
| 2742 N Rosedale St Baltimore, MD | 3.0 | 1.0 | 1024 | $1,350 | $1.32 | 43d | 2 | 1.04mi |
| 2700 Roslyn Ave Unit 5 Baltimore, MD | 2.0 | 1.0 | 800 | $1,500 | $1.88 | 17d | 1 | 1.07mi |
| 2700 Roslyn Ave Unit 8 Baltimore, MD | 2.0 | 1.0 | 800 | $1,500 | $1.88 | 4d | 1 | 1.07mi |
| 3615 Mohawk Ave Gwynn Oak, MD | 2.0 | 1.0 | 1000 | $1,610 | $1.61 | 43d | 1 | 1.08mi |
| 3617 Mohawk Ave Baltimore, MD | 2.0 | 1.0 | 1000 | $1,595 | $1.59 | 43d | 1 | 1.08mi |
| 4714 Greenspring Ave Baltimore, MD | 2.0 | 1.0 | 890 | $1,295 | $1.46 | 43d | 1 | 1.09mi |
| 2601 Garrison Blvd Baltimore, MD | 2.0 | 1.0 | 750 | $1,175 | $1.57 | 21d | 2 | 1.10mi |
| 3416 Alto Rd Unit 21 Baltimore, MD | 2.0 | 1.0 | 700 | $1,175 | $1.68 | 43d | 1 | 1.10mi |
| 3028 Hanlon Ave Baltimore, MD | 3.0 | 2.0 | 1200 | $1,711 | $1.43 | 23d | 1 | 1.16mi |
| 2910 Reisterstown Rd Baltimore, MD | 1.0–3.0 | 1.0 | 950 | $1,414 | $1.49 | 14d | 4 | 1.20mi |
| 2908 Reisterstown Rd Baltimore, MD | 2.0 | 1.0 | 750 | $1,299 | $1.73 | 43d | 1 | 1.20mi |
| 4309 Norfolk Ave Unit 1st Floor Baltimore, MD | 2.0 | 1.0 | 1470 | $1,500 | $1.02 | 11d | 1 | 1.20mi |
| 2906 Reisterstown Rd Baltimore, MD | 2.0 | 1.0 | 750 | $1,299 | $1.73 | 43d | 1 | 1.21mi |
Listing history 4 events
-
2026-04-23status Pending
-
2026-04-07price $139,000
-
2026-03-26$149,000 Active
-
2026-03-24historical $149,000
ⓘ Source: listings_history table (triggers on properties + properties_extension) + one-shot
backfill from property_details.listing_events for pre-trigger history.
Tax reassessment forecast MD · Partial reset (capped growth)
- Current annual tax
- $3,012 · $251/mo
- Projected year-2 tax
- $3,012 · $251/mo
- Expected delta
- $0/yr ($0/mo · 0.0%)
ⓘ Screening estimate from a state-policy table — verify with the county assessor before closing.
Climate risk First Street
- Flood 1/10 Low FEMA zone X (unshaded) · 0% chance over 30 yrs
- Wildfire 1/10 Low
- Heat 7/10 Severe 7 d/yr ≥104°F today · 15 d/yr by 30 yrs out
- Wind 6/10 Major 27% chance of damaging wind over 30 yrs
- Air quality 3/10 Moderate 3 unhealthy d/yr today · 4 by 30 yrs out
Nearby sold comps map
Loading sold comps map…
Walkable amenities ~0.75 mi
Loading nearby amenities…
Taxation est. · year 1
- Rental income
- $18,274
- − Mortgage interest
- −$7,786
- − Property taxes
- −$3,012
- − Insurance
- −$695
- − Repairs & maintenance
- −$1,462
- − Management
- −$1,462
- − Depreciation
- −$4,044
- Taxable loss
- −$187
- Est. tax savings @ 24.0%
- +$45
- After-tax cash flow
- $2,027/yr
For passive investors: Depreciation is non-cash, so a rental often shows a tax loss while cash-flowing — sheltering income. Rental losses are passive: they offset passive income freely, and up to $25,000/yr can offset ordinary (W-2) income if you actively participate and your MAGI is under $100k (phasing out to $0 by $150k); unused losses carry forward. On sale, claimed depreciation is recaptured at up to 25%, and gains may owe capital-gains tax (a 1031 exchange can defer both). Figures are a year-1 estimate at your 24.0% rate — not tax advice; consult a CPA.
Schools (NCES district)
- District
- Baltimore City Public Schools
- NCES district ID
- 2400090
- Math proficiency
- 7% ▼ -9.00%
- Reading proficiency
- 16% ▼ -5.00%
- Median HH income
- $42,108
- Composite
- 10.08/100
- National rank
- #9805
- State rank
- #24 of 24 in MD
Livability — Baltimore
- Score
- 76/100
- State rank
- #90
- US rank
- #3396
Category grades
Schools grade is shown separately in the Schools card above.
Census & demographics
- Census place
- Baltimore, MD
- County
- Baltimore City · 558,601 people
- City population
- 588,727
- Metro
- Baltimore-Columbia-Towson, MD
- Population (ZIP)
- 52,229
- Household income
- $51,587
- Rent vs Own
- Severe rent burden
- 3644.0
Population outlook (Baltimore County) Hauer SSP2
- Today (2025)
- 624,249 people
- By 2030
- 621,541 · -0.4%
- By 2040
- 609,756 · -2.3%
- By 2050
- 597,249 · -4.3%
- By 2075
- 552,236 · -11.5%
- By 2100
- 513,934 · -17.7%
Race, ethnicity, and origin ACS 2023
- Neighborhood character
- Predominantly Black (73%)
- Race & ethnicity
- Black 73% White 17% Hispanic / Latino 5% Two or more races 4% Asian 1%
- Common ancestry
- Scotch-Irish 2% Romanian 2% Italian 1%
- Foreign-born
- 9% · Canada, South Korea
- Languages at home
- 91% English-only · Spanish 4% French/Haitian/Cajun 1% Other Indo-European 1%
Political lean MEDSL · Baltimore
- 2024 margin
- Solid D (+73.0) · D 85.2% · R 12.2% · Other 2.6%
- 2008→2024 swing
- -2.5pp toward R · 2008: 75.5pp · 2024: 73.0pp
- All cycles
- 2024: D+73.0 2020: D+76.6 2016: D+74.6 2012: D+76.4 2008: D+75.5
Not yet ingested
- Civics
- —
Market trends
- HPI YoY
- ▼ -318.58%
- Current HPI
- 291.4926
- Rent YoY
- ▲ 2.41%
- Metro
- Baltimore-Columbia-Towson, MD
- State GDP YoY
- ▲ 2.97%
- F500 in state
- 12
Industry mix (Fortune 500 HQ in MD)
| Industry | F500 HQs | Revenue |
|---|---|---|
| Aerospace / Defense | 1 | $71B |
|
||
| Utilities | 1 | $25B |
|
||
| Hotels | 1 | $24B |
|
||
| Consumer Goods | 1 | $7B |
|
||
| Real Estate | 1 | $6B |
|
||
| Chemicals | 1 | $2B |
|
||
Price history
-6.7% since first listed4 events — show timeline
- 2026-04-23 Pending — BRIGHT MLS
- 2026-04-07 Price Changed $139,000 BRIGHT MLS
- 2026-03-26 Listed $149,000 BRIGHT MLS
- 2026-03-24 Coming Soon $149,000 BRIGHT MLS
Property tax history
+1.3%/yrLatest (2025): $3,012 · +4.8% YoY. Source: county tax records.
Cash-flow waterfall
monthlySold comps — $/sqft
last 12 mo · ≤1 miLoading sold comps…