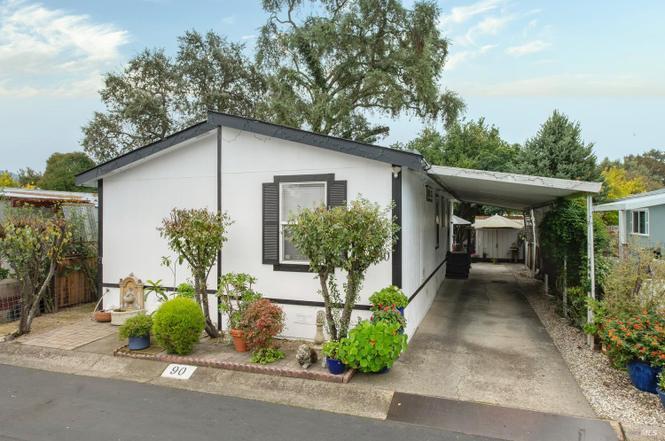
90 Vista Cir · Fetters Hot Springs-Agua Caliente, CA
Flood risk 6/10 · Moderate
- FEMA flood zone
- X (unshaded)
- Chance of flooding over 30 yrs
- 0.74%
- Est. flood insurance / yr
- $507 – $1,088
Fire risk 6/10 · Moderate
- Est. fire insurance / yr
- $659 – $1,223
Heat risk 4/10 · Minor
- Hot days now (above 97°F)
- 7 days/yr
- Hot days in 30 yrs
- 16 days/yr
Wind risk 1/10 · Minimal
- Chance of severe wind over 30 yrs
- —
Air-quality risk 9/10 · Severe
- Unhealthy air days now
- 19 days/yr
- Unhealthy air days in 30 yrs
- 19 days/yr
Risk factors via First Street. Map © Google.
Why this score? — see what drove the B- grade
The composite is a weighted blend of 9 inputs, each scored 0–100. Each bar is that input's sub-score; the figure is the points it added to the 100-point composite (weight × sub-score).
- Cash flow +27.5/30.0
- ARV discount +12.1/15.0
- DSCR +9.6/10.0
- 1% rule +7.5/10.0
- Schools +3.4/10.0
- Rent growth +2.7/5.0
- Livability +2.5/5.0
- Condition / age +2.5/5.0
- Appreciation +0.0/10.0
$250,000
🖨 Deal sheet 📄 Offer letter ✓ Due diligence
Listing remarks
Lovely home located in a quiet, private family mobile home park, an ideal place to start! This beautifully updated 3-bedroom, 2-bath residence features an attached carport and a private, fully fenced yard, perfect for relaxing or entertaining. The home shows true pride of ownership throughout. Community amenities include a guest parking area and an inviting in-ground pool for residents to enjoy.
Key facts
- In-ground pool
- Attached carport
- Guest parking area
Tags
Property features AI
Finance
- Other: Located in Sonoma area
- Financial info: Monthly land lease: $1,200
- HOA & community: No homeowners association; Not a senior community
Exterior
- Parking: Covered parking; 2 total parking spaces; Guest parking available
- Utilities: Cable connected; Public sewer
- Home design: Manufactured home in park; Double wide
- Construction: Manufactured by Fleetwood Homes; Wood skirting
- Exterior features: Located in Sonoma Rancho Vista park; Guest parking available
Interior
- Kitchen: Stone countertops; Dishwasher; Free standing gas range
- Bedrooms: 3 bedrooms
- Flooring: Simulated wood flooring
- Bathrooms: 2 full bathrooms; Tub with shower over
- Heating & cooling: Central heating; Central cooling
- Interior features: Stone countertops in kitchen; Dishwasher; Free standing gas range
- Laundry & utility: Laundry inside the home
Neighborhood map
What this means for you Summary
Snapshot
- This is a 3-bed/2.0-bath manufactured listed at $250k.
Deal economics
- At list price, monthly cash flow is $736 ($9k/yr) — positive.
- The deal already cash-flows at list — no discount required.
- Meets the 1% rule at list price ($3k rent vs $250k).
- Recommended offer: $220k (12.0% below list) — sets the bar for market timing.
Location & tenants
- Location reads: area grade B — affects rentability + tenant quality, not the cash-flow math above.
- Sonoma Valley Unified (town): math 27% / reading 42% proficiency, ranked #849 of 1,400 in CA (top 61%) — families likely to look elsewhere, expect single-tenant / working-renter base with shorter leases.
- Market conditions: Rents flat; 263 active listings in the ZIP; 6 comparable units currently listed for rent nearby; rentals at typical pace (median 24d on market — plan ~3-4 weeks tenant-placement turnaround); solid renter incomes; 1,039 units permitted in Sonoma County in 2024 (185 in 5+ unit buildings).
- This rent runs 36% of the median local income ($105k/yr) — at the standard rent-burdened threshold; future hikes will face affordability resistance.
Forward outlook
- Local home prices are declining (-3.0%/yr); year-one equity from $2k of loan paydown is wiped out by about $8k of value loss. Plan a longer hold.
- Sonoma County population projected at +8% by 2050 — modest demand growth; plan on rents tracking national, not racing it.
Negotiation context
- It's been on market 185 days — a 12% lower offer ($220k) is reasonable based on typical stale-listing flexibility.
Risks & watch-outs
- Climate carrying-cost: major flood risk; major wildfire risk — expect insurance premiums to compound above CPI over the hold.
Questions for the listing agent
- It's been on market 185 days. Have you received any prior offers? Is the seller open to a 12% concession, seller financing, or rate buy-down credit?
- Why hasn't it sold? Are there any deal-killer items the seller is aware of (foundation, flood, title, zoning, code violations)?
- Is there a deadline driving the sale (1031 exchange, divorce, estate, relocation)? That informs how much negotiation room exists.
- What's the average days-on-market for RENTAL listings here right now (not sales)? A rising rental-DOM trend means longer vacancies and softer asking-rent achievability than the comps imply.
- What's the recent tenant-quality profile in this submarket — average credit score on applications, eviction rate, late-payment / NSF rate, and stable-employment percentage? A property-management company in the area should have these aggregated.
- How much new for-sale + rental construction is in the pipeline within 1–3 miles? Heavy new supply typically softens prices + rents 12–24 months out; constrained supply supports both.
Investment metrics
- 1% rule
- 1.25% ✓
- Cap rate
- 9.83%
- Cash-on-cash
- 12.62%
- DSCR
- 1.56
- GRM
- 6.7
CMA / ARV
- ARV (on-the-fly)
- $278,640
- Comps found
- 1
Show comp detail 1 sale within ~0.75 mi
| Address | Dist | Beds/Ba | Sqft | Sold | Price | $/sf | Match |
|---|---|---|---|---|---|---|---|
| 70 Rancho Dr | 0.08mi | 3/2.0 | 1,120 (+4%) | 6mo | $289,000 | $258 | 85 |
Match score weights: distance 35% · size 25% · config 20% · recency 20%. Top-matched comps best support the ARV.
Projected returns pro-forma
-3.0% appreciation · 0.79% rent growth · sell at horizon
- IRR
- -0.1%
- Equity multiple
- 0.99×
- Total profit
- $-371
- Equity at exit
- $37,276
- IRR
- 7.1%
- Equity multiple
- 1.48×
- Total profit
- $33,596
- Equity at exit
- $21,615
Cash invested: $70,000 (down + closing). Projections, not guarantees.
Landlord ↔ Tenant lean methodology
- Overall (STATE)
- 18 Strongly Tenant-Friendly
- State California
- 18 Strongly Tenant-Friendly · D+13
- County
- — inherits STATE
- City
- — inherits STATE
ZIP-level market 95476
- Rents YoY
- 0.8%
- Active inventory
- 263
- Price-to-rent
- 6.7×
Monthly cashflow live
- Estimated rent
- $3,119 high interval (Pro) →
- Mortgage (P&I)
- −$1,311
- Tax est. 1.5%
- −$312 /mo · $3,750/yr
- Insurance
- −$104
- HOA
- −$0
- Vacancy / Maint / Mgmt
- −$655
- Net cashflow
- $736
Break-even live
UW: 25.0% down · 7.5% · 30yr · 1.5% tax · 5.0% vac · 8.0% maint · 8.0% mgmt
Financing live
Cash to close
- Down payment
- $62,500
- Closing costs
- $7,500
- Reserves months
- —
- Total cash needed
- —
Loan-product check · same deal, 3 products live
Conventional
25% down · 7.5% · 30yr
- Down + closing
- —
- Monthly P&I
- —
- Monthly cashflow
- —
- DSCR
- —
- Eligible?
- —
Personal DTI + credit; lowest rate.
DSCR
20% down · 8.5% · 30yr
- Down + closing
- —
- Monthly P&I
- —
- Monthly cashflow
- —
- DSCR
- —
- Eligible?
- —
No personal income docs; deal must DSCR.
Hard money
10% down · 12.0% · 12mo
- Down + closing
- —
- Monthly P&I
- —
- Monthly cashflow
- —
- DSCR
- —
- Eligible?
- —
Short-term bridge; refi at stabilization.
Rent comps 6 comps
| Address | Beds | Baths | Sqft | Rent | $/sqft | DOM | Units | Dist |
|---|---|---|---|---|---|---|---|---|
| 17353 Park Ave Unit 17351 Sonoma, CA | 2.0 | 1.0 | 700 | $2,150 | $3.07 | 14d | 1 | 0.32mi |
| 17253 Park Ave Sonoma, CA | 3.0 | 2.0 | 1300 | $3,600 | $2.77 | 43d | 1 | 0.36mi |
| 16914 Sonoma Hwy Sonoma, CA | 2.0 | 1.0 | 750 | $2,595 | $3.46 | 43d | 1 | 0.44mi |
| 18109 Barrett Ave Unit 2 Sonoma, CA | 2.0 | 1.0 | 760 | $2,295 | $3.02 | 14d | 1 | 0.63mi |
| 18260 Las Lomas Rd Sonoma, CA | 3.0 | 2.0 | 1350 | $3,750 | $2.78 | 23d | 1 | 0.77mi |
| 18495 Riverside Dr Sonoma, CA | 2.0 | 1.0 | 860 | $2,800 | $3.26 | 14d | 1 | 0.89mi |
Listing history 10 events
-
2026-06-05statusdays on market $250,000 Pending 185 DOM
-
2026-06-03days on market $250,000 Active 184 DOM
-
2026-06-02days on market $250,000 Active 183 DOM
-
2026-06-01days on market $250,000 Active 182 DOM
-
2026-05-31days on market $250,000 Active 181 DOM
-
2026-05-30days on market $250,000 Active 180 DOM
-
2026-04-09historical Contingent (Show)
-
2026-03-13price $250,000
-
2026-01-27price $279,000
-
2025-12-01$295,000 Active
ⓘ Source: listings_history table (triggers on properties + properties_extension) + one-shot
backfill from property_details.listing_events for pre-trigger history.
Climate risk First Street
- Flood 6/10 Major FEMA zone X (unshaded) · 74% chance over 30 yrs
- Wildfire 6/10 Major
- Heat 4/10 Moderate 7 d/yr ≥97°F today · 16 d/yr by 30 yrs out
- Wind 1/10 Low
- Air quality 9/10 Extreme 19 unhealthy d/yr today · 19 by 30 yrs out
Nearby sold comps map
Loading sold comps map…
Walkable amenities ~0.75 mi
Loading nearby amenities…
Taxation est. · year 1
- Rental income
- $37,424
- − Mortgage interest
- −$14,004
- − Property taxes
- −$3,750
- − Insurance
- −$1,250
- − Repairs & maintenance
- −$2,994
- − Management
- −$2,994
- − Depreciation
- −$7,273
- Taxable income
- $5,159
- Est. tax owed @ 24.0%
- −$1,238
- After-tax cash flow
- $7,594/yr
For passive investors: Depreciation is non-cash, so a rental often shows a tax loss while cash-flowing — sheltering income. Rental losses are passive: they offset passive income freely, and up to $25,000/yr can offset ordinary (W-2) income if you actively participate and your MAGI is under $100k (phasing out to $0 by $150k); unused losses carry forward. On sale, claimed depreciation is recaptured at up to 25%, and gains may owe capital-gains tax (a 1031 exchange can defer both). Figures are a year-1 estimate at your 24.0% rate — not tax advice; consult a CPA.
Schools (NCES district)
- District
- Sonoma Valley Unified
- NCES district ID
- 0637200
- Math proficiency
- 27% ▼ -1.00%
- Reading proficiency
- 42% ▲ 1.00%
- Median HH income
- $63,880
- Composite
- 33.88/100
- National rank
- #10355
- State rank
- #849 of 1400 in CA
Livability — Fetters Hot Springs-Agua Caliente
No livability data for this city. (Only ~50 U.S. cities are tracked.)
Census & demographics
- Census place
- Fetters Hot Springs-Agua Caliente, CA
- County
- Sonoma County · 449,805 people
- Metro
- Santa Rosa-Petaluma, CA
- Population (ZIP)
- 35,196
- Household income
- $105,374
- Rent vs Own
- Severe rent burden
- 1218.0
Population outlook (Sonoma County) Hauer SSP2
- Today (2025)
- 539,935 people
- By 2030
- 554,870 · +2.8%
- By 2040
- 573,262 · +6.2%
- By 2050
- 580,715 · +7.6%
- By 2075
- 579,229 · +7.3%
- By 2100
- 547,835 · +1.5%
Race, ethnicity, and origin ACS 2023
- Neighborhood character
- Predominantly White (66%)
- Race & ethnicity
- White 66% Hispanic / Latino 28% Two or more races 13% Asian 2% Black 1%
- Hispanic origin (detail)
- Mexican 23%
- Common ancestry
- Italian 5% Lithuanian 4% Portuguese 3%
- Foreign-born
- 16% · Canada, Dominican Republic
- Languages at home
- 75% English-only · Spanish 21% Other Indo-European 1% Other Asian/Pacific 0%
Political lean MEDSL · Sonoma
- 2024 margin
- Solid D (+46.2) · D 71.4% · R 25.2% · Other 3.3%
- 2008→2024 swing
- -3.4pp toward R · 2008: 49.6pp · 2024: 46.2pp
- All cycles
- 2024: D+46.2 2020: D+51.5 2016: D+47.9 2012: D+44.9 2008: D+49.6
Not yet ingested
- Civics
- —
Market trends
- HPI YoY
- ▼ -1116.03%
- Current HPI
- 236.6408
- Rent YoY
- ▲ 0.79%
- Metro
- Santa Rosa-Petaluma, CA
- State GDP YoY
- ▲ 3.21%
- F500 in state
- 116
Industry mix (Fortune 500 HQ in CA)
| Industry | F500 HQs | Revenue |
|---|---|---|
| Technology | 27 | $1,492B |
|
||
| Financial Services | 3 | $174B |
|
||
| Retail | 3 | $44B |
|
||
| Insurance | 3 | $26B |
|
||
| Media / Entertainment | 2 | $115B |
|
||
| Pharmaceuticals / Biotech | 2 | $62B |
|
||
Price history
-15.3% since first listed4 events — show timeline
- 2026-04-09 Contingent — BAREIS
- 2026-03-13 Price Changed $250,000 BAREIS
- 2026-01-27 Price Changed $279,000 BAREIS
- 2025-12-01 Listed $295,000 BAREIS
Property tax history
-0.9%/yrLatest (2025): $451 · -0.2% YoY. Source: county tax records.
Cash-flow waterfall
monthlySold comps — $/sqft
last 12 mo · ≤1 miLoading sold comps…