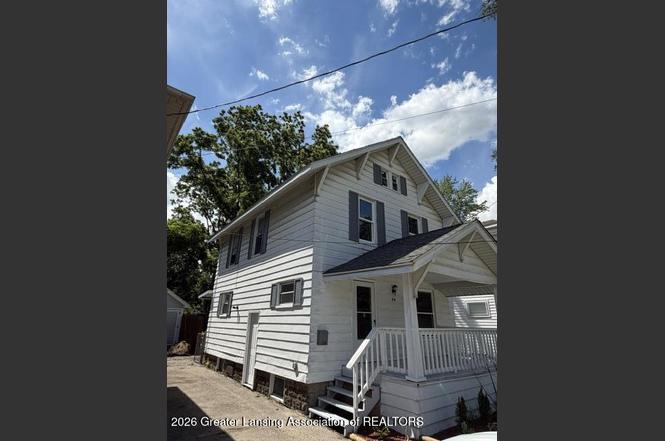
314 Regent St · Lansing, MI
Flood risk 1/10 · Minimal
- FEMA flood zone
- X (unshaded)
- Chance of flooding over 30 yrs
- 0.0%
- Est. flood insurance / yr
- $473 – $860
Fire risk 1/10 · Minimal
- Est. fire insurance / yr
- $784 – $1,456
Heat risk 2/10 · Minimal
- Hot days now (above 96°F)
- 7 days/yr
- Hot days in 30 yrs
- 16 days/yr
Wind risk 2/10 · Minimal
- Chance of severe wind over 30 yrs
- —
Air-quality risk 2/10 · Minimal
- Unhealthy air days now
- 1 days/yr
- Unhealthy air days in 30 yrs
- 2 days/yr
Risk factors via First Street. Map © Google.
Why this score? — see what drove the D grade
The composite is a weighted blend of 9 inputs, each scored 0–100. Each bar is that input's sub-score; the figure is the points it added to the 100-point composite (weight × sub-score).
- Cash flow +18.7/30.0
- DSCR +5.9/10.0
- 1% rule +5.3/10.0
- Rent growth +4.3/5.0
- Livability +4.0/5.0
- Condition / age +2.5/5.0
- Schools +1.9/10.0
- ARV discount +0.0/15.0
- Appreciation +0.0/10.0
$139,900
🖨 Deal sheet 📄 Offer letter ✓ Due diligence
Listing remarks MLS
Remodeled 2 Story 3 Bedroom Close to MSU Ready for Move In. New Stainless-Steel Appliances. Large Front Porch and Deck in Rear for Entertaining. Extra Storage in Garage and Shed.
Key facts
- Remodeled
- Large front porch
- Deck in rear
Tags
Property features AI
Exterior
- Parking: Detached garage; Driveway parking
- Utilities: Public sewer; Natural gas connected; High-speed internet available; Cable available; Concrete road access
- Home design: Two-story residence; Built in 1921; Located in the HUDSON ADDition subdivision
- Construction: Aluminum siding
- Exterior features: Back yard fencing; Deck and porch
Interior
- Kitchen: Electric range; Refrigerator
- Bedrooms: Primary bedroom (16 x 10); Bedroom 2 (12 x 19); Bedroom 3 (9 x 9)
- Bathrooms: 2 full bathrooms
- Heating & cooling: Central air conditioning; Forced air heating with natural gas
- Interior features: Electric range and refrigerator included; Basement is full with concrete floor
- Laundry & utility: Laundry located in the basement
Neighborhood map
What this means for you Summary
Snapshot
- This is a 3-bed/1.0-bath single-family listed at $140k.
Deal economics
- At list price, monthly cash flow is $138 ($2k/yr) — positive.
- The deal already cash-flows at list — no discount required.
- Meets the 1% rule at list price ($1k rent vs $140k).
- Cap rate 7.5% vs local median 6.0% in Lansing — meaningfully above typical; check what's discounted (condition, days-on-market, listing class) to confirm the premium yield is real.
Location & tenants
- Location reads 79/100 on livability (#94 in MI, #2,182 nationally) — a middle-class / working-renter tenant base. Strengths: amenities A+, commute A+, cost of living A+; Watch: employment D, schools F, crime F.
- Lansing Public School District (urban): math 14% / reading 23% proficiency, ranked #650 of 760 in MI (top 86%) — low school quality limits family demand, transient renter base, plan for 1-2y turnover; 68% free/reduced lunch — lower-income household profile, screen leases tightly.
- Market conditions: Rents rising fast (+7.0%/yr); 98 active listings in the ZIP; 31 comparable units currently listed for rent nearby; rentals lingering (median 44d on market — plan ~5-8 weeks vacancy on turnover, expect pricing pressure); 61% of comp listings sitting > 30 days — soft ceiling on asking rent; 350 units permitted in Ingham County in 2024 (186 in 5+ unit buildings).
- This rent runs 32% of the median local income ($54k/yr) — at the standard rent-burdened threshold; future hikes will face affordability resistance.
Forward outlook
- Local home prices are declining (-3.0%/yr); year-one equity from $967 of loan paydown is wiped out by about $4k of value loss. Plan a longer hold.
- Ingham County population projected at +11% by 2050 — modest demand growth; plan on rents tracking national, not racing it.
- At projected returns (-3.0% appreciation + 7.0% rent growth), your $39k cash investment doubles in ~10 years — after that, you're playing with house money.
Negotiation context
- Only 2 days on market — expect competitive offers; lowballing is unlikely to land.
- 4 sale attempts since 19y ago with the ask held roughly flat each time — persistent listings suggest the price (not the market) is what's stuck; bring a comps-based counter.
- Current owner paid $41k; list at $140k implies a 242% gain — meaningful room to come down on a strong offer.
Risks & watch-outs
- Watch-outs: built in 1921 — expect roof / HVAC / electrical / plumbing capex.
Questions for the listing agent
- Built in 1921 — when were the roof, HVAC, electrical panel, plumbing, and water heater last replaced?
- Is there a deadline driving the sale (1031 exchange, divorce, estate, relocation)? That informs how much negotiation room exists.
- Schools are F-rated, which usually means shorter tenancies and higher turnover. Who's the typical renter profile here, and what's been the actual vacancy rate?
- Crime grade is F in this area — have there been break-ins, vandalism, or insurance claims at this property in the last 3 years? What carrier currently insures it and at what premium?
- The area grade is low — what's the realistic commute time and amenity access for the typical tenant pool here? Any planned neighborhood developments (good or bad) we should know about?
- What's the average days-on-market for RENTAL listings here right now (not sales)? A rising rental-DOM trend means longer vacancies and softer asking-rent achievability than the comps imply.
- What's the recent tenant-quality profile in this submarket — average credit score on applications, eviction rate, late-payment / NSF rate, and stable-employment percentage? A property-management company in the area should have these aggregated.
- How much new for-sale + rental construction is in the pipeline within 1–3 miles? Heavy new supply typically softens prices + rents 12–24 months out; constrained supply supports both.
Investment metrics
- 1% rule
- 1.03% ✓
- Cap rate
- 7.48%
- Cash-on-cash
- 4.24%
- DSCR
- 1.19
- GRM
- 8.1
CMA / ARV
- ARV (on-the-fly)
- $119,600
- Comps found
- 12
Show comp detail 12 sales within ~0.75 mi
| Address | Dist | Beds/Ba | Sqft | Sold | Price | $/sf | Match |
|---|---|---|---|---|---|---|---|
| 400 Lathrop St | 0.25mi | 3/2.0 | 1,003 (-4%) | 1mo | $115,000 | $115 | 77 |
| 710 Leslie St | 0.31mi | 2/1.0 (-1) | 976 (-6%) | 0mo | $125,000 | $128 | 70 |
| 509 Clifford St | 0.32mi | 3/1.0 | 936 (-10%) | 0mo | $32,000 | $34 | 68 |
| 605 N Fairview Ave | 0.65mi | 3/1.0 | 1,046 (+1%) | 1mo | $177,000 | $169 | 68 |
| 646 S Clemens Ave | 0.31mi | 3/1.0 | 912 (-12%) | 1mo | $105,100 | $115 | 64 |
| 605 N Clemens Ave | 0.64mi | 3/1.0 | 1,004 (-4%) | 1mo | $169,900 | $169 | 64 |
| 311 N Magnolia Ave | 0.45mi | 3/1.0 | 910 (-12%) | 1mo | $102,000 | $112 | 58 |
| 404 S Hayford Ave | 0.26mi | 2/1.0 (-1) | 884 (-15%) | 2mo | $58,000 | $66 | 56 |
| 1240 Climax St | 0.64mi | 3/1.0 | 1,144 (+10%) | 0mo | $109,900 | $96 | 53 |
| 314 Bingham St | 0.64mi | 3/1.0 | 1,144 (+10%) | 2mo | $75,000 | $66 | 52 |
| 316 Jones St | 0.57mi | 4/1.0 (+1) | 1,176 (+13%) | 1mo | $70,500 | $60 | 46 |
| 1031 Bement St | 0.66mi | 2/1.0 (-1) | 908 (-13%) | 1mo | $106,500 | $117 | 42 |
Match score weights: distance 35% · size 25% · config 20% · recency 20%. Top-matched comps best support the ARV.
Projected returns pro-forma
-3.0% appreciation · 7.02% rent growth · sell at horizon
- IRR
- -5.1%
- Equity multiple
- 0.80×
- Total profit
- $-7,737
- Equity at exit
- $20,860
- IRR
- 8.9%
- Equity multiple
- 1.81×
- Total profit
- $31,875
- Equity at exit
- $12,096
Cash invested: $39,172 (down + closing). Projections, not guarantees.
Landlord ↔ Tenant lean methodology
- Overall (STATE)
- 62 Landlord-Friendly
- State Michigan
- 62 Landlord-Friendly · EVEN
- County
- — inherits STATE
- City
- — inherits STATE
ZIP-level market 48912
- Rents YoY
- 7.0%
- Active inventory
- 98
- Price-to-rent
- 8.1×
Monthly cashflow live
- Estimated rent
- $1,444 high interval (Pro) →
- Mortgage (P&I)
- −$734
- Tax from tax record
- −$210 /mo · $2,523/yr
- Insurance
- −$58
- HOA
- −$0
- Vacancy / Maint / Mgmt
- −$303
- Net cashflow
- $138
Break-even live
UW: 25.0% down · 7.5% · 30yr · 1.5% tax · 5.0% vac · 8.0% maint · 8.0% mgmt
Financing live
Cash to close
- Down payment
- $34,975
- Closing costs
- $4,197
- Reserves months
- —
- Total cash needed
- —
Loan-product check · same deal, 3 products live
Conventional
25% down · 7.5% · 30yr
- Down + closing
- —
- Monthly P&I
- —
- Monthly cashflow
- —
- DSCR
- —
- Eligible?
- —
Personal DTI + credit; lowest rate.
DSCR
20% down · 8.5% · 30yr
- Down + closing
- —
- Monthly P&I
- —
- Monthly cashflow
- —
- DSCR
- —
- Eligible?
- —
No personal income docs; deal must DSCR.
Hard money
10% down · 12.0% · 12mo
- Down + closing
- —
- Monthly P&I
- —
- Monthly cashflow
- —
- DSCR
- —
- Eligible?
- —
Short-term bridge; refi at stabilization.
Rent comps 31 comps
| Address | Beds | Baths | Sqft | Rent | $/sqft | DOM | Units | Dist |
|---|---|---|---|---|---|---|---|---|
| 329 S Clemens Ave Lansing, MI | 3.0 | 1.0 | 1194 | $1,400 | $1.17 | 21d | 1 | 0.09mi |
| 409 Lathrop St Lansing, MI | 2.0 | 1.0 | 1342 | $1,500 | $1.12 | 21d | 1 | 0.22mi |
| 1629 E Michigan Ave Unit 306 Lansing, MI | 2.0 | 1.0 | 901 | $1,550 | $1.72 | 43d | 1 | 0.29mi |
| 2222 E Michigan Ave Unit 206 Lansing, MI | 2.0 | 2.0 | 900 | $1,700 | $1.89 | 43d | 1 | 0.34mi |
| 2222 E Michigan Ave Unit 411 Lansing, MI | 2.0 | 2.0 | 900 | $1,700 | $1.89 | 21d | 1 | 0.34mi |
| 910 Dakin St Lansing, MI | 3.0 | 1.0 | 908 | $1,295 | $1.43 | 43d | 1 | 0.49mi |
| 414 N Hayford Ave Lansing, MI | 3.0 | 1.0 | 990 | $1,425 | $1.44 | 43d | 1 | 0.60mi |
| 208 S Bingham St Lansing, MI | 4.0 | 1.0 | 1020 | $1,500 | $1.47 | 13d | 1 | 0.66mi |
| 1100 Malcolm X St Unit B Lansing, MI | 2.0 | 1.0 | 979 | $1,050 | $1.07 | 13d | 1 | 0.70mi |
| 1027 Climax St Lansing, MI | 3.0 | 1.5 | 1298 | $1,550 | $1.19 | 13d | 1 | 0.74mi |
| 1223 Bensch St Lansing, MI | 3.0 | 1.0 | 850 | $1,200 | $1.41 | 21d | 1 | 0.78mi |
| 805 Bement St Unit Hosmer 507 Lansing, MI | 2.0 | 1.0 | 1120 | $1,075 | $0.96 | 43d | 1 | 0.86mi |
| 507 S Hosmer St Lansing, MI | 2.0 | 1.0 | 1120 | $1,075 | $0.96 | 43d | 1 | 0.87mi |
| 905 E Shiawassee St Unit 837-02 Lansing, MI | 2.0 | 1.0 | 800 | $750 | $0.94 | 43d | 1 | 0.92mi |
| 905 E Shiawassee St Unit 837-01 Lansing, MI | 2.0 | 1.0 | 800 | $850 | $1.06 | 43d | 1 | 0.92mi |
| 936 N Fairview Ave Lansing, MI | 1.0–2.0 | 1.0 | 825 | $1,245 | $1.51 | 43d | 2 | 1.00mi |
| 824 Cleveland St Lansing, MI | 2.0 | 1.0 | 839 | $1,150 | $1.37 | 21d | 1 | 1.01mi |
| 730 Johnson Ave Lansing, MI | 2.0 | 1.0 | 840 | $1,225 | $1.46 | 43d | 1 | 1.02mi |
| 113 Pere Marquette Dr Lansing, MI | 1.0–2.0 | 1.0–2.0 | 1065 | $2,250 | $2.11 | 13d | 9 | 1.04mi |
| 2620 Senate Dr Lansing, MI | 1.0–2.0 | 1.0–2.0 | 950 | $1,800 | $1.89 | 43d | 1 | 1.11mi |
| 1102 Clark St Lansing, MI | 3.0 | 1.0 | 1232 | $1,550 | $1.26 | 21d | 1 | 1.15mi |
| 1228 N Fairview Ave Lansing, MI | 3.0 | 2.0 | 1100 | $1,700 | $1.55 | 43d | 1 | 1.22mi |
| 335 E Saint Joseph St Unit 6 Lansing, MI | 2.0 | 1.0 | 700 | $949 | $1.36 | 43d | 1 | 1.23mi |
| 1115 Chester Rd Unit Two Bedroom Lansing, MI | 2.0 | 1.5 | 1100 | $1,200 | $1.09 | 43d | 1 | 1.27mi |
| 620 May St Lansing, MI | 1.0–2.0 | 1.0–2.0 | 1126 | $1,578 | $1.40 | 13d | 12 | 1.29mi |
| 1245 Weber Dr Unit 2 Lansing, MI | 2.0 | 1.0 | 700 | $1,250 | $1.79 | 43d | 1 | 1.29mi |
| 2937 Kenwick Cir Unit 2928 2931 2936 Lansing, MI | 2.0 | 1.0 | 922 | $999 | $1.08 | 21d | 1 | 1.30mi |
| 605 S Grand Ave Unit 2 Lansing, MI | 4.0 | 1.0 | 1200 | $1,100 | $0.92 | 43d | 1 | 1.36mi |
| 832 N Larch St Apt 3 Lansing, MI | 2.0 | 1.0 | 890 | $1,095 | $1.23 | 43d | 1 | 1.38mi |
| 401 S Washington Sq Unit 205 Lansing, MI | 2.0 | 1.0 | 968 | $1,355 | $1.40 | 43d | 1 | 1.42mi |
| 401 S Washington Sq Unit 201 Lansing, MI | 3.0 | 1.0 | 1254 | $1,560 | $1.24 | 43d | 1 | 1.42mi |
Listing history 3 events
-
2026-06-18days on market $139,900 Active 2 DOM
-
2026-06-17remarks 178-char remark
Show marketing remark (178 chars)
Remodeled 2 Story 3 Bedroom Close to MSU Ready for Move In. New Stainless-Steel Appliances. Large Front Porch and Deck in Rear for Entertaining. Extra Storage in Garage and Shed.
-
2026-06-17$139,900 Active 1 DOM
Show marketing remark (178 chars)
Remodeled 2 Story 3 Bedroom Close to MSU Ready for Move In. New Stainless-Steel Appliances. Large Front Porch and Deck in Rear for Entertaining. Extra Storage in Garage and Shed.
ⓘ Source: listings_history table (triggers on properties + properties_extension) + one-shot
backfill from property_details.listing_events for pre-trigger history.
Tax reassessment forecast MI · Partial reset (capped growth)
- Current annual tax
- $2,523 · $210/mo
- Projected year-2 tax
- $2,523 · $210/mo
- Expected delta
- $0/yr ($0/mo · 0.0%)
ⓘ Screening estimate from a state-policy table — verify with the county assessor before closing.
Climate risk First Street
- Flood 1/10 Low FEMA zone X (unshaded) · 0% chance over 30 yrs
- Wildfire 1/10 Low
- Heat 2/10 Low 7 d/yr ≥96°F today · 16 d/yr by 30 yrs out
- Wind 2/10 Low
- Air quality 2/10 Low 1 unhealthy d/yr today · 2 by 30 yrs out
Nearby sold comps map
Loading sold comps map…
Walkable amenities ~0.75 mi
Loading nearby amenities…
Taxation est. · year 1
- Rental income
- $17,325
- − Mortgage interest
- −$7,837
- − Property taxes
- −$2,523
- − Insurance
- −$700
- − Repairs & maintenance
- −$1,386
- − Management
- −$1,386
- − Depreciation
- −$4,070
- Taxable loss
- −$576
- Est. tax savings @ 24.0%
- +$138
- After-tax cash flow
- $1,799/yr
For passive investors: Depreciation is non-cash, so a rental often shows a tax loss while cash-flowing — sheltering income. Rental losses are passive: they offset passive income freely, and up to $25,000/yr can offset ordinary (W-2) income if you actively participate and your MAGI is under $100k (phasing out to $0 by $150k); unused losses carry forward. On sale, claimed depreciation is recaptured at up to 25%, and gains may owe capital-gains tax (a 1031 exchange can defer both). Figures are a year-1 estimate at your 24.0% rate — not tax advice; consult a CPA.
Schools (NCES district)
- District
- Lansing Public School District
- NCES district ID
- 2621150
- Math proficiency
- 14% ▲ 1.00%
- Reading proficiency
- 23% ▲ 3.00%
- Median HH income
- $37,453
- Composite
- 18.76/100
- National rank
- #14002
- State rank
- #650 of 760 in MI
Livability — Lansing
- Score
- 79/100
- State rank
- #94
- US rank
- #2182
Category grades
Schools grade is shown separately in the Schools card above.
Census & demographics
- Census place
- Lansing, MI
- County
- Ingham County · 237,052 people
- City population
- 161,269
- Metro
- Lansing-East Lansing, MI
- Population (ZIP)
- 17,674
- Household income
- $54,429
- Rent vs Own
- Severe rent burden
- 1171.0
Population outlook (Ingham County) Hauer SSP2
- Today (2025)
- 300,362 people
- By 2030
- 307,808 · +2.5%
- By 2040
- 320,492 · +6.7%
- By 2050
- 333,223 · +10.9%
- By 2075
- 373,693 · +24.4%
- By 2100
- 392,021 · +30.5%
Race, ethnicity, and origin ACS 2023
- Neighborhood character
- Diverse neighborhood (Simpson 0.62)
- Race & ethnicity
- White 56% Black 22% Two or more races 12% Hispanic / Latino 10% Asian 4%
- Hispanic origin (detail)
- Mexican 6% Cuban 1%
- Common ancestry
- Romanian 5% Iranian 4% Lithuanian 3%
- Foreign-born
- 12% · Canada, Vietnam, China
- Languages at home
- 84% English-only · Spanish 5% French/Haitian/Cajun 1% Korean 1%
Political lean MEDSL · Ingham
- 2024 margin
- Strong D (+29.7) · D 63.9% · R 34.2% · Other 2.0%
- 2008→2024 swing
- -3.6pp toward R · 2008: 33.3pp · 2024: 29.7pp
- All cycles
- 2024: D+29.7 2020: D+32.2 2016: D+27.6 2012: D+27.9 2008: D+33.3
Not yet ingested
- Civics
- —
Market trends
- HPI YoY
- ▼ -167.67%
- Current HPI
- 171.1549
- Rent YoY
- ▲ 7.02%
- Metro
- Lansing-East Lansing, MI
- State GDP YoY
- ▲ 1.37%
- F500 in state
- 28
Industry mix (Fortune 500 HQ in MI)
| Industry | F500 HQs | Revenue |
|---|---|---|
| Automotive Parts | 3 | $48B |
|
||
| Automotive | 2 | $372B |
|
||
| Chemicals | 1 | $45B |
|
||
| Automotive Retail | 1 | $29B |
|
||
| Healthcare / Medical Devices | 1 | $23B |
|
||
| Automotive Technology | 1 | $20B |
|
||
Price history
+192.1% since first listed6 events — show timeline
- 2026-06-17 Listed $139,900 REALCOMP
- 2026-06-16 Listed $139,900 Greater Lansing AoR
- 2007-10-30 Sold (MLS) $40,900 Greater Lansing AoR
- 2007-08-08 Listed $42,900 Greater Lansing AoR
- 2007-07-27 Listing Removed — Greater Lansing AoR
- 2007-04-06 Listed $47,900 Greater Lansing AoR
Property tax history
+3.4%/yrLatest (2025): $2,523 · +3.0% YoY. Source: county tax records.
Cash-flow waterfall
monthlySold comps — $/sqft
last 12 mo · ≤1 miLoading sold comps…