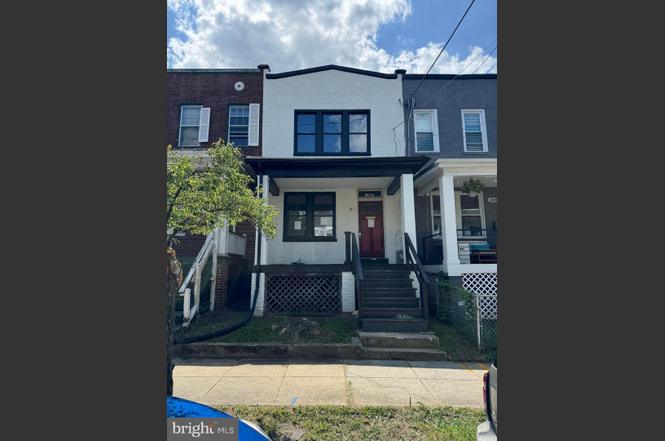
1467 Ridge Pl SE · Washington, DC
Flood risk 1/10 · Minimal
- FEMA flood zone
- X (unshaded)
- Chance of flooding over 30 yrs
- 0.0%
- Est. flood insurance / yr
- $473 – $860
Fire risk 1/10 · Minimal
- Est. fire insurance / yr
- $631 – $1,173
Heat risk 8/10 · Major
- Hot days now (above 104°F)
- 7 days/yr
- Hot days in 30 yrs
- 15 days/yr
Wind risk 4/10 · Minor
- Chance of severe wind over 30 yrs
- 20.0%
Air-quality risk 4/10 · Minor
- Unhealthy air days now
- 4 days/yr
- Unhealthy air days in 30 yrs
- 5 days/yr
Risk factors via First Street. Map © Google.
Why this score? — see what drove the B grade
The composite is a weighted blend of 9 inputs, each scored 0–100. Each bar is that input's sub-score; the figure is the points it added to the 100-point composite (weight × sub-score).
- Cash flow +30.0/30.0
- 1% rule +10.0/10.0
- DSCR +10.0/10.0
- ARV discount +7.5/15.0
- Livability +3.7/5.0
- Schools +3.6/10.0
- Rent growth +3.5/5.0
- Condition / age +2.5/5.0
- Appreciation +0.0/10.0
$100,000
🖨 Deal sheet 📄 Offer letter ✓ Due diligence
Listing remarks
Auction Property. In Collaboration with Alex Cooper Auctioneers. List price is Opening Bid at The Online Only Auction Sale to Be Held on The Auctioneers Website – Bidding begins Thursday, June 25 and ends Tuesday, June 30, 2026 at 12:00 PM. Exceptional renovation opportunity in the heart of Anacostia! This property is currently in shell condition and requires a full renovation, offering strong potential for value-add improvements. Approximate total square footage of 1,326±. Zoned R-3, providing long-term upside and flexibility. Includes plans in hand, making this a prime opportunity in SE Washington, DC.
Key facts
- Waterfront trails
- Approved plans
- Public transit
Tags
Property features AI
Exterior
- Parking: On-street parking
- Utilities: Public water; Public sewer
- Home design: Interior townhouse/rowhouse; Three floors in unit; Fee simple ownership
- Construction: Brick construction; Brick/mortar foundation; Above-grade and below-grade structures; Listed as average condition; major rehab may be needed
- Exterior features: No tidal water
Interior
- Bedrooms: Two bedrooms on the upper level; One bedroom on the lower level
- Bathrooms: Two full bathrooms; One half bathroom
- Heating & cooling: Forced air heating (natural gas); Central air conditioning (electric); Natural gas hot water
- Interior features: Fully finished basement
Neighborhood map
What this means for you Summary
Snapshot
- This is a 2-bed/1.5-bath townhouse listed at $100k.
Deal economics
- At list price, monthly cash flow is $866 ($10k/yr) — positive.
- The deal already cash-flows at list — no discount required.
- Meets the 1% rule at list price ($2k rent vs $100k).
- Recommended offer: $91k (9.0% below list) — sets the bar for market timing.
- Cap rate 16.7% vs local median 2.5% in Washington — top-decile yield for the area; either an underpriced asset or a hidden risk that comps aren't pricing in. Stress-test before assuming the spread holds.
Location & tenants
- Location reads 73/100 on livability (#1 in DC) — a middle-class / working-renter tenant base. Strengths: amenities A+, commute A+, employment A+; Watch: crime F, cost of living F.
- District Of Columbia Public Schools (urban): math 33% / reading 40% proficiency, ranked #8 of 32 in DC (top 25%) — families likely to look elsewhere, expect single-tenant / working-renter base with shorter leases; 65% free/reduced lunch — lower-income household profile, screen leases tightly.
- Market conditions: Rents rising (+3.9%/yr); 296 active listings in the ZIP; 40 comparable units currently listed for rent nearby; rentals at typical pace (median 25d on market — plan ~3-4 weeks tenant-placement turnaround); 1,737 units permitted in District of Columbia in 2024 (1,506 in 5+ unit buildings).
- This rent runs 44% of the median local income ($54k/yr) — at the standard rent-burdened threshold; future hikes will face affordability resistance.
Forward outlook
- Local home prices are declining (-3.0%/yr); year-one equity from $691 of loan paydown is wiped out by about $3k of value loss. Plan a longer hold.
- District of Columbia County population projected at +50% by 2050 — long-run rental-demand tailwind backs the buy-and-hold thesis.
- At projected returns (-3.0% appreciation + 3.9% rent growth), your $28k cash investment doubles in ~4 years — after that, you're playing with house money.
Negotiation context
- It's been on market 102 days — a 9% lower offer ($91k) is reasonable based on typical stale-listing flexibility.
- 4 sale attempts since 2y ago; this cycle's ask has dropped $200k (67%) from the opening price — seller is motivated, your offer sets the floor, not the list.
Risks & watch-outs
- Watch-outs: built in 1927 — expect roof / HVAC / electrical / plumbing capex.
- Climate carrying-cost: extreme-heat days projected 7→15/yr by 2055 (HVAC capex compounding) — expect insurance premiums to compound above CPI over the hold.
Questions for the listing agent
- It's been on market 102 days. Have you received any prior offers? Is the seller open to a 9% concession, seller financing, or rate buy-down credit?
- Built in 1927 — when were the roof, HVAC, electrical panel, plumbing, and water heater last replaced?
- Why hasn't it sold? Are there any deal-killer items the seller is aware of (foundation, flood, title, zoning, code violations)?
- Is there a deadline driving the sale (1031 exchange, divorce, estate, relocation)? That informs how much negotiation room exists.
- Crime grade is F in this area — have there been break-ins, vandalism, or insurance claims at this property in the last 3 years? What carrier currently insures it and at what premium?
- What's the average days-on-market for RENTAL listings here right now (not sales)? A rising rental-DOM trend means longer vacancies and softer asking-rent achievability than the comps imply.
- What's the recent tenant-quality profile in this submarket — average credit score on applications, eviction rate, late-payment / NSF rate, and stable-employment percentage? A property-management company in the area should have these aggregated.
- How much new for-sale + rental construction is in the pipeline within 1–3 miles? Heavy new supply typically softens prices + rents 12–24 months out; constrained supply supports both.
Investment metrics
- 1% rule
- 1.97% ✓
- Cap rate
- 16.68%
- Cash-on-cash
- 37.10%
- DSCR
- 2.65
- GRM
- 4.2
CMA / ARV
- ARV (on-the-fly)
- $274,924
- Comps found
- 12
Show comp detail 12 sales within ~0.75 mi
| Address | Dist | Beds/Ba | Sqft | Sold | Price | $/sf | Match |
|---|---|---|---|---|---|---|---|
| 1469 Ridge Pl SE | 0.00mi | 2/1.0 | 884 (0%) | 2mo | $157,000 | $178 | 96 |
| 1920 Naylor Rd SE Unit T2 | 0.44mi | 2/1.0 | 887 (+0%) | 2mo | $105,000 | $118 | 76 |
| 1621 T St SE #1 | 0.14mi | 3/1.0 (+1) | 949 (+7%) | 4mo | $295,000 | $311 | 71 |
| 2139 Young St SE #101 | 0.47mi | 2/1.0 | 864 (-2%) | 3mo | $145,000 | $168 | 70 |
| 1415 Bangor St SE | 0.62mi | 2/2.0 | 864 (-2%) | 1mo | $275,000 | $318 | 64 |
| 1621 T St SE #2 | 0.14mi | 3/1.0 (+1) | 972 (+10%) | 8mo | $285,000 | $293 | 64 |
| 2321 Altamont Pl SE #102 | 0.68mi | 2/1.0 | 868 (-2%) | 8mo | $80,000 | $92 | 57 |
| 1345 K St SE #401 | 0.69mi | 2/2.0 | 927 (+5%) | 5mo | $700,000 | $755 | 54 |
| 2305 Nicholson St SE #305 | 0.60mi | 2/2.0 | 966 (+9%) | 7mo | $440,000 | $455 | 49 |
| 1345 K St SE #406 | 0.69mi | 2/1.0 | 965 (+9%) | 5mo | $545,000 | $565 | 47 |
| 1514 K St SE #2 | 0.68mi | 2/1.0 | 772 (-13%) | 1mo | $465,000 | $602 | 44 |
| 1300 Dexter Ter SE | 0.66mi | 2/1.5 | 1,016 (+15%) | 8mo | $290,000 | $285 | 37 |
Match score weights: distance 35% · size 25% · config 20% · recency 20%. Top-matched comps best support the ARV.
Projected returns pro-forma
-3.0% appreciation · 3.86% rent growth · sell at horizon
- IRR
- 34.0%
- Equity multiple
- 2.45×
- Total profit
- $40,677
- Equity at exit
- $14,910
- IRR
- 41.3%
- Equity multiple
- 5.06×
- Total profit
- $113,714
- Equity at exit
- $8,646
Cash invested: $28,000 (down + closing). Projections, not guarantees.
Landlord ↔ Tenant lean methodology
- Overall (CITY)
- 0 Strongly Tenant-Friendly
- State District of Columbia
- 12 Strongly Tenant-Friendly · D+43
- County
- — inherits STATE
- City Washington
- 0 Strongly Tenant-Friendly · D+43
ZIP-level market 20020
- Rents YoY
- 3.9%
- Active inventory
- 296
- Price-to-rent
- 4.2×
Monthly cashflow live
- Estimated rent
- $1,971 high interval (Pro) →
- Mortgage (P&I)
- −$524
- Tax est. 1.5%
- −$125 /mo · $1,500/yr
- Insurance
- −$42
- HOA
- −$0
- Vacancy / Maint / Mgmt
- −$414
- Net cashflow
- $866
Break-even live
UW: 25.0% down · 7.5% · 30yr · 1.5% tax · 5.0% vac · 8.0% maint · 8.0% mgmt
Financing live
Cash to close
- Down payment
- $25,000
- Closing costs
- $3,000
- Reserves months
- —
- Total cash needed
- —
Loan-product check · same deal, 3 products live
Conventional
25% down · 7.5% · 30yr
- Down + closing
- —
- Monthly P&I
- —
- Monthly cashflow
- —
- DSCR
- —
- Eligible?
- —
Personal DTI + credit; lowest rate.
DSCR
20% down · 8.5% · 30yr
- Down + closing
- —
- Monthly P&I
- —
- Monthly cashflow
- —
- DSCR
- —
- Eligible?
- —
No personal income docs; deal must DSCR.
Hard money
10% down · 12.0% · 12mo
- Down + closing
- —
- Monthly P&I
- —
- Monthly cashflow
- —
- DSCR
- —
- Eligible?
- —
Short-term bridge; refi at stabilization.
Rent comps 40 comps
| Address | Beds | Baths | Sqft | Rent | $/sqft | DOM | Units | Dist |
|---|---|---|---|---|---|---|---|---|
| 1642 16th St SE #3 Washington, DC | 2.0 | 1.0 | 870 | $2,000 | $2.30 | 20d | 1 | 0.07mi |
| 1609 17th St SE #202 Washington, DC | 2.0 | 1.0 | 718 | $1,950 | $2.72 | 15d | 1 | 0.14mi |
| 1609 17th St SE #202 Washington, DC | 2.0 | 1.0 | 718 | $1,950 | $2.72 | 24d | 1 | 0.14mi |
| 1601 17th St SE Washington, DC | 1.0 | 1.0 | 720 | $1,650 | $2.29 | 24d | 1 | 0.15mi |
| 1622 17th St SE Unit 2001 Washington, DC | 2.0 | 1.0 | 535 | $1,850 | $3.46 | 24d | 1 | 0.15mi |
| 1721 Minnesota Ave SE Washington, DC | 3.0 | 1.0 | 680 | $1,450 | $2.13 | 24d | 1 | 0.16mi |
| 1516 Marion Barry Ave SE Unit 301 Washington, DC | 3.0 | 2.0 | 1100 | $1,795 | $1.63 | 8d | 1 | 0.17mi |
| 1720 R St SE Washington, DC | 3.0 | 1.0 | 750 | $2,500 | $3.33 | 24d | 1 | 0.17mi |
| 1621 17th Pl SE Apt 3 Washington, DC | 1.0 | 1.0 | 720 | $1,300 | $1.81 | 24d | 1 | 0.18mi |
| 1600 Marion Barry Ave SE Unit Basement -B01 Washington, DC | 1.0 | 1.0 | 550 | $1,550 | $2.82 | 24d | 1 | 0.19mi |
| 1629 Fairlawn Ave SE Unit 3 Washington, DC | 2.0 | 1.0 | 850 | $2,500 | $2.94 | 24d | 1 | 0.20mi |
| 1629 Fairlawn Ave SE Apt 2 Washington, DC | 2.0 | 1.0 | 850 | $2,800 | $3.29 | 12d | 1 | 0.20mi |
| 1632 Fairlawn Ave SE Washington, DC | 2.0 | 1.0 | 800 | $2,400 | $3.00 | 12d | 1 | 0.20mi |
| 1721 T St SE Washington, DC | 1.0–2.0 | 1.0 | 785 | $1,980 | $2.52 | 22d | 6 | 0.20mi |
| 1737 T St SE Washington, DC | 2.0 | 1.0 | 800 | $2,500 | $3.12 | 4d | 1 | 0.23mi |
| 1618 18th St SE Unit 1 Washington, DC | 2.0 | 1.0 | 800 | $1,850 | $2.31 | 24d | 1 | 0.24mi |
| 1526 V St SE Unit 2 Washington, DC | 2.0 | 1.0 | 800 | $1,700 | $2.12 | 24d | 1 | 0.30mi |
| 1847 Marion Barry Ave SE Washington, DC | 1.0–2.0 | 1.0 | 725 | $1,525 | $2.10 | 24d | 1 | 0.36mi |
| 1925 Minnesota Ave SE Washington, DC | 1.0 | 1.0 | 600 | $1,400 | $2.33 | 24d | 1 | 0.38mi |
| 1953 19th Pl SE Apt 301 Washington, DC | 3.0 | 1.0 | 980 | $5,301 | $5.41 | 24d | 1 | 0.40mi |
| 1953 19th Pl SE Apt 104 Washington, DC | 3.0 | 1.0 | 980 | $2,800 | $2.86 | 5d | 1 | 0.40mi |
| 1928 Naylor Rd SE Unit 102 Washington, DC | 2.0 | 2.0 | 750 | $1,482 | $1.98 | 2d | 1 | 0.43mi |
| 1928 Naylor Rd SE Unit 503 Washington, DC | 2.0 | 2.0 | 750 | $1,595 | $2.13 | 15d | 1 | 0.43mi |
| 1955 Fairlawn Ave SE Unit 2A Washington, DC | 2.0 | 2.0 | 1000 | $2,499 | $2.50 | 24d | 1 | 0.46mi |
| 1907 Marion Barry Ave SE Washington, DC | 2.0 | 1.0 | 900 | $1,495 | $1.66 | 24d | 1 | 0.47mi |
| 1907 Good Hope Ct SE #309 Washington, DC | 2.0 | 1.0 | 670 | $1,595 | $2.38 | 24d | 1 | 0.47mi |
| 1907 Good Hope Ct SE #7 Washington, DC | 1.0 | 1.0 | 578 | $1,500 | $2.60 | 24d | 1 | 0.47mi |
| 2215 Minnesota Ave SE Unit 3 Washington, DC | 3.0 | 1.0 | 750 | $2,500 | $3.33 | 24d | 1 | 0.51mi |
| 1425-1429 Cedar St SE Washington, DC | 1.0 | 1.0 | 644 | $1,419 | $2.20 | 2d | 5 | 0.53mi |
| 1619 Butler St SE Unit 3 Washington, DC | 2.0 | 1.0 | 700 | $1,700 | $2.43 | 24d | 1 | 0.54mi |
| 2341 Green St SE Washington, DC | 2.0 | 1.0 | 741 | $1,225 | $1.65 | 24d | 1 | 0.56mi |
| 2228 Martin Luther King Jr Ave SE Washington, DC | 1.0 | 1.0 | 606 | $1,790 | $2.95 | 3d | 5 | 0.57mi |
| 2300 Good Hope Rd SE Washington, DC | 2.0 | 1.0–2.0 | 1020 | $1,913 | $1.88 | 24d | 6 | 0.57mi |
| 1300 Morris Rd SE Washington, DC | 2.0 | 1.0 | 650 | $1,499 | $2.31 | 24d | 1 | 0.59mi |
| 1302 Morris Rd SE Washington, DC | 3.0 | 1.0 | 750 | $2,400 | $3.20 | 24d | 1 | 0.60mi |
| 2440 S St SE Unit 4 Washington, DC | 3.0 | 1.0 | 800 | $2,450 | $3.06 | 8d | 1 | 0.64mi |
| 2323 Pennsylvania Ave SE Washington, DC | 1.0 | 1.0 | 666 | $1,781 | $2.67 | 3d | 10 | 0.66mi |
| 924 15th St SE Washington, DC | 2.0 | 2.0 | 1100 | $3,450 | $3.14 | 24d | 1 | 0.67mi |
| 1300 Dexter Ter SE Washington, DC | 2.0 | 1.5 | 1100 | $2,600 | $2.36 | 24d | 1 | 0.68mi |
| 2515 R St SE Washington, DC | 1.0–2.0 | 1.0 | 812 | $1,755 | $2.16 | 5d | 2 | 0.70mi |
Listing history 22 events
-
2026-06-18days on market $100,000 Active 102 DOM
-
2026-06-17days on market $100,000 Active 101 DOM
-
2026-06-16days on market $100,000 Active 100 DOM
-
2026-06-15days on market $100,000 Active 99 DOM
-
2026-06-13days on market $100,000 Active 97 DOM
-
2026-06-09days on market $100,000 Active 93 DOM
-
2026-06-08days on market $100,000 Active 92 DOM
-
2026-06-07days on market $100,000 Active 91 DOM
-
2026-06-04remarks 611-char remark
-
2026-06-04statusdays on market $100,000 Active 88 DOM
-
2026-05-04price $100,000
-
2026-03-02$299,900 Active
-
2026-03-02historical
-
2026-02-22price $329,900
-
2026-02-22status Active
-
2026-01-29historical
-
2025-11-26price $150,000
-
2025-01-03status Active
-
2024-12-31historical
-
2024-11-07price $329,900
-
2024-09-11$375,000 Active
-
2022-06-15soldstatus $300,000
ⓘ Source: listings_history table (triggers on properties + properties_extension) + one-shot
backfill from property_details.listing_events for pre-trigger history.
Climate risk First Street
- Flood 1/10 Low FEMA zone X (unshaded) · 0% chance over 30 yrs
- Wildfire 1/10 Low
- Heat 8/10 Severe 7 d/yr ≥104°F today · 15 d/yr by 30 yrs out
- Wind 4/10 Moderate 20% chance of damaging wind over 30 yrs
- Air quality 4/10 Moderate 4 unhealthy d/yr today · 5 by 30 yrs out
Nearby sold comps map
Loading sold comps map…
Walkable amenities ~0.75 mi
Loading nearby amenities…
Taxation est. · year 1
- Rental income
- $23,646
- − Mortgage interest
- −$5,602
- − Property taxes
- −$1,500
- − Insurance
- −$500
- − Repairs & maintenance
- −$1,892
- − Management
- −$1,892
- − Depreciation
- −$2,909
- Taxable income
- $9,352
- Est. tax owed @ 24.0%
- −$2,245
- After-tax cash flow
- $8,143/yr
For passive investors: Depreciation is non-cash, so a rental often shows a tax loss while cash-flowing — sheltering income. Rental losses are passive: they offset passive income freely, and up to $25,000/yr can offset ordinary (W-2) income if you actively participate and your MAGI is under $100k (phasing out to $0 by $150k); unused losses carry forward. On sale, claimed depreciation is recaptured at up to 25%, and gains may owe capital-gains tax (a 1031 exchange can defer both). Figures are a year-1 estimate at your 24.0% rate — not tax advice; consult a CPA.
Schools (NCES district)
- District
- District Of Columbia Public Schools
- NCES district ID
- 1100030
- Math proficiency
- 33% ▲ 3.00%
- Reading proficiency
- 40% ▲ 5.00%
- Median HH income
- $67,671
- Composite
- 35.84/100
- National rank
- #9606
- State rank
- #8 of 32 in DC
Livability — Washington
- Score
- 73/100
- State rank
- #1
- US rank
- #5327
Category grades
Schools grade is shown separately in the Schools card above.
Census & demographics
- Census place
- Washington, DC
- County
- District of Columbia · 671,873 people
- City population
- 671,873
- Metro
- Washington-Arlington-Alexandria, DC-VA-MD-WV
- Population (ZIP)
- 53,005
- Household income
- $54,032
- Rent vs Own
- Severe rent burden
- 5148.0
Population outlook (District of Columbia County) Hauer SSP2
- Today (2025)
- 821,926 people
- By 2030
- 899,517 · +9.4%
- By 2040
- 1,061,162 · +29.1%
- By 2050
- 1,231,493 · +49.8%
- By 2075
- 1,603,312 · +95.1%
- By 2100
- 1,847,141 · +124.7%
Race, ethnicity, and origin ACS 2023
- Neighborhood character
- Predominantly Black (90%)
- Race & ethnicity
- Black 90% Two or more races 3% Hispanic / Latino 3% White 3%
- Common ancestry
- Lithuanian 1%
- Foreign-born
- 3% · Canada
- Languages at home
- 95% English-only · Spanish 2% French/Haitian/Cajun 1%
Political lean MEDSL · District of Columbia
- 2024 margin
- Solid D (+86.1) · D 91.2% · R 5.1% · Other 3.8%
- 2008→2024 swing
- +0.1pp no change · 2008: 85.9pp · 2024: 86.1pp
- All cycles
- 2024: D+86.1 2020: D+86.8 2016: D+88.7 2012: D+84.2 2008: D+85.9
Not yet ingested
- Civics
- —
Market trends
- HPI YoY
- ▼ -415.44%
- Current HPI
- 306.5068
- Rent YoY
- ▲ 3.86%
- Metro
- Washington-Arlington-Alexandria, DC-VA-MD-WV
- State GDP YoY
- ▲ 1.33%
- F500 in state
- 6
Industry mix (Fortune 500 HQ in DC)
| Industry | F500 HQs | Revenue |
|---|---|---|
| Financial Services | 1 | $153B |
|
||
| Life Sciences / Industrials | 1 | $25B |
|
||
| Industrial Machinery | 1 | $8B |
|
||
Price history
-66.7% since first listed12 events — show timeline
- 2026-05-04 Price Changed $100,000 BRIGHT MLS
- 2026-03-02 Listing Removed — BRIGHT MLS
- 2026-03-02 Listed $299,900 BRIGHT MLS
- 2026-02-22 Price Changed $329,900 BRIGHT MLS
- 2026-02-22 Relisted — BRIGHT MLS
- 2026-01-29 Listing Removed — BRIGHT MLS
- 2025-11-26 Price Changed $150,000 BRIGHT MLS
- 2025-01-03 Relisted — BRIGHT MLS
- 2024-12-31 Listing Removed — BRIGHT MLS
- 2024-11-07 Price Changed $329,900 BRIGHT MLS
- 2024-09-11 Listed $375,000 BRIGHT MLS
- 2022-06-15 Sold (Public Records) $300,000 Public Records
Property tax history
+14.2%/yrLatest (2025): $14,841 · +2.2% YoY. Source: county tax records.
Cash-flow waterfall
monthlySold comps — $/sqft
last 12 mo · ≤1 miLoading sold comps…