22600 Normandie Ave #47 · West Carson, CA
Flood risk 5/10 · Moderate
- FEMA flood zone
- X (unshaded)
- Chance of flooding over 30 yrs
- 0.49%
- Est. flood insurance / yr
- $507 – $1,088
Fire risk 1/10 · Minimal
- Est. fire insurance / yr
- $659 – $1,223
Heat risk 3/10 · Minor
- Hot days now (above 87°F)
- 7 days/yr
- Hot days in 30 yrs
- 22 days/yr
Wind risk 1/10 · Minimal
- Chance of severe wind over 30 yrs
- —
Air-quality risk 5/10 · Moderate
- Unhealthy air days now
- 7 days/yr
- Unhealthy air days in 30 yrs
- 7 days/yr
Risk factors via First Street. Map © Google.
Why this score? — see what drove the B- grade
The composite is a weighted blend of 9 inputs, each scored 0–100. Each bar is that input's sub-score; the figure is the points it added to the 100-point composite (weight × sub-score).
- Cash flow +28.9/30.0
- DSCR +10.0/10.0
- 1% rule +8.1/10.0
- ARV discount +7.5/15.0
- Condition / age +4.0/5.0
- Schools +3.6/10.0
- Livability +3.2/5.0
- Rent growth +2.5/5.0
- Appreciation +0.0/10.0
$240,000
🖨 Deal sheet (PDF) 📄 Offer letter ✓ Due diligence
Listing remarks MLS
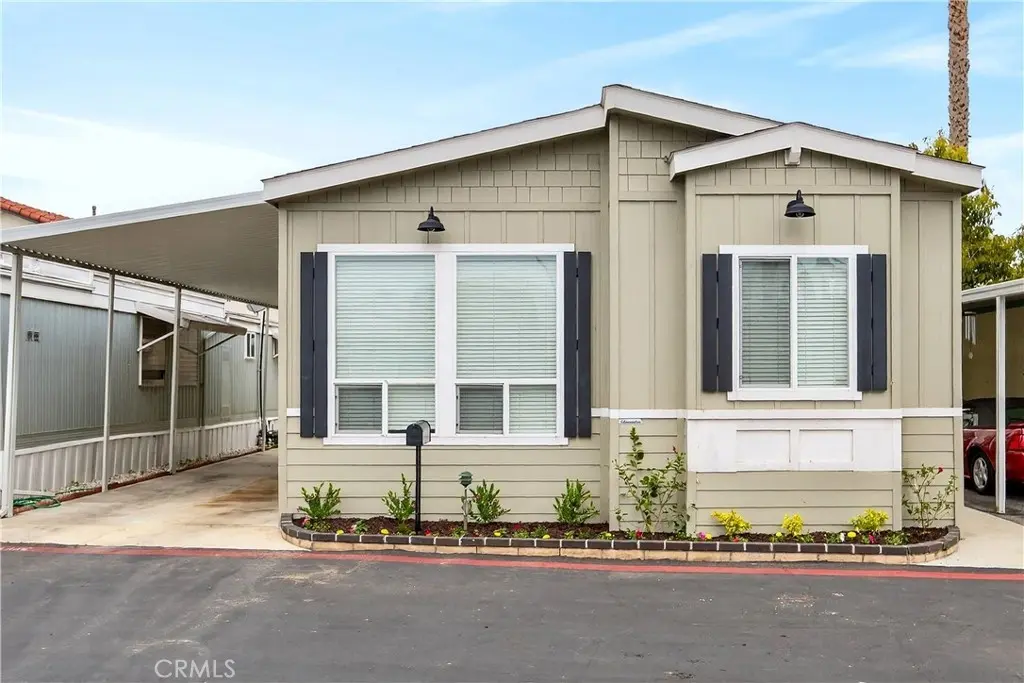
Skip the renovations and move straight into this 2022 Silvercrest Bradford. This 2 Bed, 2 Bath home offers modern construction and move-in-ready convenience, featuring stainless steel appliances, a functional kitchen island, and a dedicated laundry room. Plus, with approximately 3 years of home warranty remaining, you can move in with peace of mind. The home is quietly tucked away toward the end of an all-age park, offering more privacy and a small patio area. Residents also enjoy the community pool, clubhouse, and billiards room. It’s a peaceful and very affordable way to live in the South Bay!
Key facts
- Clubhouse
- Community pool
- Billiards room
Tags
Neighborhood map
What this means for you Summary
Snapshot
- This is a 2-bed/2.0-bath manufactured listed at $240k. Condition is rated good.
Deal economics
- At list price, monthly cash flow is $817 ($10k/yr) — positive.
- The deal already cash-flows at list — no discount required.
- Meets the 1% rule at list price ($3k rent vs $240k).
- Recommended offer: $226k (6.0% below list) — sets the bar for market timing.
- Cap rate 10.4% vs local median 2.9% in West Carson — top-decile yield for the area; either an underpriced asset or a hidden risk that comps aren't pricing in. Stress-test before assuming the spread holds.
Location & tenants
- Location reads 64/100 on livability (#408 in CA) — a middle-class / working-renter tenant base. Strengths: commute A+, employment A+; Watch: crime D+, amenities F, cost of living F.
- Los Angeles Unified (urban): math 29% / reading 54% proficiency, ranked #223 of 517 in CA (top 43%) — families likely to look elsewhere, expect single-tenant / working-renter base with shorter leases; 67% free/reduced lunch — lower-income household profile, screen leases tightly.
- Zoned schools: Meyler Street Elementary (628 students, 92% FRL); Stephen M. White Middle (1,384 students, 81% FRL); Nathaniel Narbonne Senior High (math 28% / reading 56%, grade F, #472 of 1,170 statewide, top 42%, 1,731 students, 84% FRL) — zoned schools average 85% FRL vs 67% district-wide (18 pts higher); higher-poverty schools than district average — tighter screening recommended.
- Market conditions: 58 active listings in the ZIP; 40 comparable units currently listed for rent nearby; rentals at typical pace (median 26d on market — plan ~3-4 weeks tenant-placement turnaround); 40% of comp listings sitting > 30 days — soft ceiling on asking rent; solid renter incomes; 19,697 units permitted in Los Angeles County in 2024 (9,426 in 5+ unit buildings).
- This rent runs 40% of the median local income ($94k/yr) — at the standard rent-burdened threshold; future hikes will face affordability resistance.
Forward outlook
- Local home prices are declining (-3.0%/yr); year-one equity from $2k of loan paydown is wiped out by about $7k of value loss. Plan a longer hold.
- Los Angeles County population projected at +9% by 2050 — modest demand growth; plan on rents tracking national, not racing it.
- At projected returns (-3.0% appreciation + 3.0% rent growth), your $67k cash investment doubles in ~9 years — after that, you're playing with house money.
Negotiation context
- It's been on market 76 days — a 6% lower offer ($226k) is reasonable based on typical stale-listing flexibility.
- 3 sale attempts since 4y ago with the ask held roughly flat each time — persistent listings suggest the price (not the market) is what's stuck; bring a comps-based counter.
Risks & watch-outs
- Climate carrying-cost: moderate flood risk — expect insurance premiums to compound above CPI over the hold.
Questions for the listing agent
- It's been on market 76 days. Have you received any prior offers? Is the seller open to a 6% concession, seller financing, or rate buy-down credit?
- Why hasn't it sold? Are there any deal-killer items the seller is aware of (foundation, flood, title, zoning, code violations)?
- Is there a deadline driving the sale (1031 exchange, divorce, estate, relocation)? That informs how much negotiation room exists.
- Crime grade is D in this area — have there been break-ins, vandalism, or insurance claims at this property in the last 3 years? What carrier currently insures it and at what premium?
- What's the average days-on-market for RENTAL listings here right now (not sales)? A rising rental-DOM trend means longer vacancies and softer asking-rent achievability than the comps imply.
- What's the recent tenant-quality profile in this submarket — average credit score on applications, eviction rate, late-payment / NSF rate, and stable-employment percentage? A property-management company in the area should have these aggregated.
- How much new for-sale + rental construction is in the pipeline within 1–3 miles? Heavy new supply typically softens prices + rents 12–24 months out; constrained supply supports both.
Investment metrics
- 1% rule
- 1.31% ✓
- Cap rate
- 10.38%
- Cash-on-cash
- 14.60%
- DSCR
- 1.65
- GRM
- 6.4
CMA / ARV
- ARV (median comp)
- $153,122
- List price
- $240,000
- Delta
- 56.74%
- Verdict
- OVERPRICED
- Comps
- 6 within 1.0 mi
Show comp detail 2 sales within ~0.75 mi
| Address | Dist | Beds/Ba | Sqft | Sold | Price | $/sf | Match |
|---|---|---|---|---|---|---|---|
| 22600 Normandie Ave #50 | 0.00mi | 2/2.0 | 1,120 (-3%) | 1mo | $243,000 | $217 | 95 |
| 22516 Normandie Ave Unit 27A | 0.12mi | 2/2.0 | 1,000 (-13%) | 11mo | $145,000 | $145 | 63 |
Match score weights: distance 35% · size 25% · config 20% · recency 20%. Top-matched comps best support the ARV.
Projected returns pro-forma
-3.0% appreciation · 3.0% rent growth · sell at horizon
- IRR
- 5.1%
- Equity multiple
- 1.20×
- Total profit
- $13,219
- Equity at exit
- $35,785
- IRR
- 14.5%
- Equity multiple
- 2.17×
- Total profit
- $78,742
- Equity at exit
- $20,751
Cash invested: $67,200 (down + closing). Projections, not guarantees.
Landlord ↔ Tenant lean methodology
- Overall (STATE)
- 18 Strongly Tenant-Friendly
- State California
- 18 Strongly Tenant-Friendly · D+13
- County
- — inherits STATE
- City
- — inherits STATE
ZIP-level market 90502
- Active inventory
- 58
- Price-to-rent
- 6.4×
Monthly cashflow live
- Estimated rent
- $3,134 high interval (Pro) →
- Mortgage (P&I)
- −$1,259
- Tax est. 1.5%
- −$300 /mo · $3,600/yr
- Insurance
- −$100
- HOA
- −$0
- Vacancy / Maint / Mgmt
- −$658
- Net cashflow
- $817
Break-even live
Sensitivity live
| Price | -10% $983 | -5% $900 | +0% $817 | +5% $734 | +10% $652 |
|---|---|---|---|---|---|
| Rent | -10% $570 | -5% $694 | +0% $817 | +5% $941 | +10% $1,065 |
| Rate | -1.0pp $938 | -0.5pp $878 | base $817 | +0.5pp $755 | +1.0pp $692 |
UW: 25.0% down · 7.5% · 30yr · 1.5% tax · 5.0% vac · 8.0% maint · 8.0% mgmt
Financing live
Cash to close
- Down payment
- $60,000
- Closing costs
- $7,200
- Reserves months
- —
- Total cash needed
- —
Loan-product check · same deal, 3 products live
Conventional
25% down · 7.5% · 30yr
- Down + closing
- —
- Monthly P&I
- —
- Monthly cashflow
- —
- DSCR
- —
- Eligible?
- —
Personal DTI + credit; lowest rate.
DSCR
20% down · 8.5% · 30yr
- Down + closing
- —
- Monthly P&I
- —
- Monthly cashflow
- —
- DSCR
- —
- Eligible?
- —
No personal income docs; deal must DSCR.
Hard money
10% down · 12.0% · 12mo
- Down + closing
- —
- Monthly P&I
- —
- Monthly cashflow
- —
- DSCR
- —
- Eligible?
- —
Short-term bridge; refi at stabilization.
Rent comps 40 comps
| Address | Beds | Baths | Sqft | Rent | $/sqft | DOM | Units | Dist |
|---|---|---|---|---|---|---|---|---|
| 22919 Mariposa Ave Torrance, CA | 2.0–3.0 | 2.5–4.0 | 1480 | $3,400 | $2.30 | 45d | 2 | 0.23mi |
| 22433 S Vermont Ave Torrance, CA | 1.0 | 1.0 | 732 | $3,121 | $4.26 | 0d | 8 | 0.25mi |
| 1332 W 225th St Unit 1 Torrance, CA | 2.0 | 1.0 | 900 | $2,095 | $2.33 | 45d | 1 | 0.28mi |
| 1311 Sepulveda Blvd Torrance, CA | 2.0–3.0 | 2.0 | 1201 | $3,400 | $2.83 | 0d | 1 | 0.45mi |
| 22317 Harbor Ridge Ln Torrance, CA | 3.0 | 1.5 | 1472 | $3,250 | $2.21 | 5d | 1 | 0.46mi |
| 1533 Plaza del Amo Unit 4 Torrance, CA | 2.0 | 1.0 | 978 | $2,550 | $2.61 | 0d | 1 | 0.52mi |
| 817 W 232nd St Unit G Torrance, CA | 2.0 | 1.5 | 900 | $3,250 | $3.61 | 20d | 1 | 0.54mi |
| 22633 Figueroa St Carson, CA | 2.0 | 1.0 | 816 | $3,000 | $3.68 | 26d | 1 | 0.56mi |
| 22619 Figueroa St Carson, CA | 2.0 | 2.0 | 800 | $3,300 | $4.12 | 45d | 1 | 0.56mi |
| 1570 W 226th St Torrance, CA | 3.0 | 2.0 | 1200 | $3,750 | $3.12 | 23d | 1 | 0.59mi |
| 1567 W 228th St Torrance, CA | 2.0 | 2.0 | 990 | $3,200 | $3.23 | 45d | 1 | 0.59mi |
| 22423 Harvard Blvd Torrance, CA | 3.0 | 1.0 | 1150 | $3,750 | $3.26 | 6d | 1 | 0.62mi |
| 1612 226th St Unit B Torrance, CA | 2.0 | 1.0 | 850 | $2,650 | $3.12 | 45d | 1 | 0.63mi |
| 23318 Sesame St Unit H Torrance, CA | 2.0 | 2.0 | 852 | $2,595 | $3.05 | 23d | 1 | 0.72mi |
| 806 Coriander Dr Unit H Torrance, CA | 2.0 | 2.0 | 829 | $2,500 | $3.02 | 26d | 1 | 0.73mi |
| 21612 Berendo Ave Torrance, CA | 2.0 | 1.0 | 754 | $2,495 | $3.31 | 45d | 1 | 0.78mi |
| 800 W Carson St Torrance, CA | 2.0–3.0 | 1.0–2.0 | 887 | $1,830 | $2.06 | 3d | 5 | 0.81mi |
| 1442 W Carson St Unit 1430-4 Torrance, CA | 2.0 | 1.0 | 800 | $2,295 | $2.87 | 26d | 1 | 0.81mi |
| 21818 Figueroa St Carson, CA | 1.0 | 1.0 | 750 | $2,449 | $3.27 | 9d | 3 | 0.85mi |
| 1565 W 218th St Torrance, CA | 2.0 | 1.0 | 728 | $2,700 | $3.71 | 45d | 1 | 0.87mi |
| 317 W 220th St Unit 112A Carson, CA | 2.0 | 1.5 | 800 | $2,395 | $2.99 | 45d | 1 | 0.93mi |
| 21329 Jaffrey Ave Torrance, CA | 3.0 | 2.0 | 1233 | $4,300 | $3.49 | 45d | 1 | 0.94mi |
| 21329 Jaffrey Ave Torrance, CA | 3.0 | 2.0 | 1233 | $4,300 | $3.49 | 3d | 1 | 0.94mi |
| 21329 Jaffrey Ave Torrance, CA | 3.0 | 2.0 | 1233 | $4,300 | $3.49 | 5d | 1 | 0.94mi |
| 21323 Conradi Ave Torrance, CA | 2.0 | 2.0 | 981 | $3,500 | $3.57 | 45d | 1 | 1.05mi |
| 2308 Cabrillo Ave Apt 8 Torrance, CA | 2.0 | 2.0 | 950 | $2,200 | $2.32 | 9d | 1 | 1.07mi |
| 2023 Border Ave Torrance, CA | 3.0 | 2.0 | 1224 | $4,500 | $3.68 | 20d | 1 | 1.09mi |
| 1642 W 215th St Torrance, CA | 3.0 | 1.0 | 1008 | $3,300 | $3.27 | 26d | 1 | 1.09mi |
| 23818 S Figueroa St Unit 7042A Carson, CA | 1.0 | 1.0 | 750 | $2,940 | $3.92 | 45d | 1 | 1.11mi |
| 24223 Ambassador Pl Harbor City, CA | 3.0 | 2.0 | 1208 | $3,800 | $3.15 | 6d | 1 | 1.12mi |
| 1541 W 213th St Torrance, CA | 2.0 | 2.0 | 1000 | $2,900 | $2.90 | 45d | 1 | 1.15mi |
| 1541 W 213th St Unit 1/2 Torrance, CA | 3.0 | 2.0 | 1200 | $3,400 | $2.83 | 45d | 1 | 1.15mi |
| 1903 Cabrillo Ave Unit C Torrance, CA | 2.0 | 1.0 | 700 | $2,700 | $3.86 | 45d | 1 | 1.20mi |
| 1833 Cabrillo Ave Torrance, CA | 2.0 | 2.5 | 1200 | $3,650 | $3.04 | 45d | 1 | 1.20mi |
| 2757 Andreo Ave Torrance, CA | 2.0 | 2.0 | 1100 | $3,295 | $3.00 | 45d | 1 | 1.22mi |
| 2757 Andreo Ave Unit 6 Torrance, CA | 2.0 | 2.0 | 1100 | $2,933 | $2.67 | 4d | 1 | 1.22mi |
| 2757 Andreo Ave Unit 5 Torrance, CA | 2.0 | 1.5 | 1100 | $2,993 | $2.72 | 13d | 1 | 1.23mi |
| 2757 Andreo Ave Unit 5 Torrance, CA | 2.0 | 2.0 | 1100 | $2,933 | $2.67 | 23d | 1 | 1.23mi |
| 2757 Andreo Ave Unit 3 Torrance, CA | 2.0 | 2.0 | 1100 | $2,933 | $2.67 | 12d | 1 | 1.23mi |
| 2757 Andreo Ave Unit 3 Torrance, CA | 2.0 | 1.5 | 1100 | $2,933 | $2.67 | 5d | 1 | 1.23mi |
Listing history 18 events
-
2026-06-21days on market $240,000 Active 76 DOM
-
2026-06-18days on market $240,000 Active 73 DOM
-
2026-06-17days on market $240,000 Active 72 DOM
-
2026-06-16days on market $240,000 Active 71 DOM
-
2026-06-15days on market $240,000 Active 70 DOM
-
2026-06-13days on market $240,000 Active 68 DOM
-
2026-06-09days on market $240,000 Active 64 DOM
-
2026-06-08days on market $240,000 Active 63 DOM
-
2026-06-07days on market $240,000 Active 62 DOM
-
2026-06-04days on market $240,000 Active 59 DOM
-
2026-06-03days on market $240,000 Active 58 DOM
-
2026-06-02days on market $240,000 Active 57 DOM
-
2026-06-01days on market $240,000 Active 56 DOM
-
2026-05-31days on market $240,000 Active 55 DOM
-
2026-04-06$240,000 Active 608-char remark
Show marketing remark (608 chars)
Skip the renovations and move straight into this 2022 Silvercrest Bradford. This 2 Bed, 2 Bath home offers modern construction and move-in-ready convenience, featuring stainless steel appliances, a functional kitchen island, and a dedicated laundry room. Plus, with approximately 3 years of home warranty remaining, you can move in with peace of mind. The home is quietly tucked away toward the end of an all-age park, offering more privacy and a small patio area. Residents also enjoy the community pool, clubhouse, and billiards room. It’s a peaceful and very affordable way to live in the South Bay!
-
2023-02-14historical
-
2023-02-08status Active
-
2022-07-12$279,900 Active
ⓘ Source: listings_history table (triggers on properties + properties_extension) + one-shot
backfill from property_details.listing_events for pre-trigger history.
Climate risk First Street
- Flood 5/10 Major FEMA zone X (unshaded) · 49% chance over 30 yrs
- Wildfire 1/10 Low
- Heat 3/10 Moderate 7 d/yr ≥87°F today · 22 d/yr by 30 yrs out
- Wind 1/10 Low
- Air quality 5/10 Major 7 unhealthy d/yr today · 7 by 30 yrs out
Nearby sold comps map
Loading sold comps map…
Walkable amenities ~0.75 mi
Loading nearby amenities…
Taxation est. · year 1
- Rental income
- $37,610
- − Mortgage interest
- −$13,444
- − Property taxes
- −$3,600
- − Insurance
- −$1,200
- − Repairs & maintenance
- −$3,009
- − Management
- −$3,009
- − Depreciation
- −$6,982
- Taxable income
- $6,367
- Est. tax owed @ 24.0%
- −$1,528
- After-tax cash flow
- $8,281/yr
For passive investors: Depreciation is non-cash, so a rental often shows a tax loss while cash-flowing — sheltering income. Rental losses are passive: they offset passive income freely, and up to $25,000/yr can offset ordinary (W-2) income if you actively participate and your MAGI is under $100k (phasing out to $0 by $150k); unused losses carry forward. On sale, claimed depreciation is recaptured at up to 25%, and gains may owe capital-gains tax (a 1031 exchange can defer both). Figures are a year-1 estimate at your 24.0% rate — not tax advice; consult a CPA.
Condition & rehab AI · 12 photos
This 2022 Silvercrest Bradford is a move-in-ready manufactured home with modern features and a good condition score. It offers a good investment opportunity with potential for value enhancement through minor updates.
Value-add opportunities
- Both Painting the exterior and interior walls — Fresh paint can enhance curb appeal and interior aesthetics
- Both Landscaping improvements — Enhanced landscaping can increase curb appeal and property value
- Resale Upgrading the kitchen appliances — Modern appliances can attract more buyers
- Resale Upgrading the bathroom fixtures — Upgraded fixtures can increase the home's appeal to potential buyers
Renovation cost estimate screening
Value-add ROI direction
- Both Painting the exterior and interior walls — Fresh paint can enhance curb appeal and interior aesthetics ↑
- Both Landscaping improvements — Enhanced landscaping can increase curb appeal and property value ↑
- Resale Upgrading the kitchen appliances — Modern appliances can attract more buyers ↑
- Resale Upgrading the bathroom fixtures — Upgraded fixtures can increase the home's appeal to potential buyers ↑
ⓘ Cost ranges are severity-bucket heuristics (US national rule-of-thumb). Get contractor quotes + a written scope before underwriting a rehab budget.
Schools (NCES district)
- District
- Los Angeles Unified
- NCES district ID
- 0622710
- Math proficiency
- 29% ▼ -4.00%
- Reading proficiency
- 54% ▲ 10.00%
- Median HH income
- $50,403
- Composite
- 35.67/100
- National rank
- #4875
- State rank
- #223 of 517 in CA
Livability — West Carson
- Score
- 64/100
- State rank
- #408
- US rank
- #13927
Category grades
Schools grade is shown separately in the Schools card above.
Census & demographics
- Census place
- West Carson, CA
- County
- Los Angeles County · 9,444,647 people
- City population
- 18,467
- Metro
- Los Angeles-Long Beach-Anaheim, CA
- Population (ZIP)
- 18,467
- Household income
- $94,291
- Rent vs Own
- Severe rent burden
- 593.0
Population outlook (Los Angeles County) Hauer SSP2
- Today (2025)
- 10,940,515 people
- By 2030
- 11,256,481 · +2.9%
- By 2040
- 11,729,929 · +7.2%
- By 2050
- 11,948,407 · +9.2%
- By 2075
- 11,818,114 · +8.0%
- By 2100
- 10,842,928 · -0.9%
Race, ethnicity, and origin ACS 2023
- Neighborhood character
- Highly diverse neighborhood (Simpson 0.71)
- Race & ethnicity
- Asian 37% Hispanic / Latino 36% White 14% Two or more races 14% Black 8%
- Hispanic origin (detail)
- Mexican 29%
- Common ancestry
- Romanian 1% Russian 1% Lithuanian 1%
- Foreign-born
- 38% · Canada, South Korea, China
- Languages at home
- 42% English-only · Spanish 29% Tagalog/Filipino 12% Korean 6%
Political lean MEDSL · Los Angeles
- 2024 margin
- Solid D (+32.9) · D 64.8% · R 31.9% · Other 3.3%
- 2008→2024 swing
- -7.4pp toward R · 2008: 40.4pp · 2024: 32.9pp
- All cycles
- 2024: D+32.9 2020: D+44.2 2016: D+48.0 2012: D+40.0 2008: D+40.4
Not yet ingested
- Civics
- —
Market trends
- HPI YoY
- ▼ -647.11%
- Current HPI
- 417.1507
- Rent YoY
- —
- Metro
- Los Angeles-Long Beach-Anaheim, CA
- State GDP YoY
- ▲ 3.21%
- F500 in state
- 116
Industry mix (Fortune 500 HQ in CA)
| Industry | F500 HQs | Revenue |
|---|---|---|
| Technology | 27 | $1,492B |
|
||
| Financial Services | 3 | $174B |
|
||
| Retail | 3 | $44B |
|
||
| Insurance | 3 | $26B |
|
||
| Media / Entertainment | 2 | $115B |
|
||
| Pharmaceuticals / Biotech | 2 | $62B |
|
||
Price history
-14.3% since first listed4 events — show timeline
- 2026-04-06 Listed $240,000 CRMLS
- 2023-02-14 Listing Removed — CRMLS
- 2023-02-08 Relisted — CRMLS
- 2022-07-12 Listed $279,900 CRMLS
Cash-flow waterfall
monthlySold comps — $/sqft
last 12 mo · ≤1 miLoading sold comps…