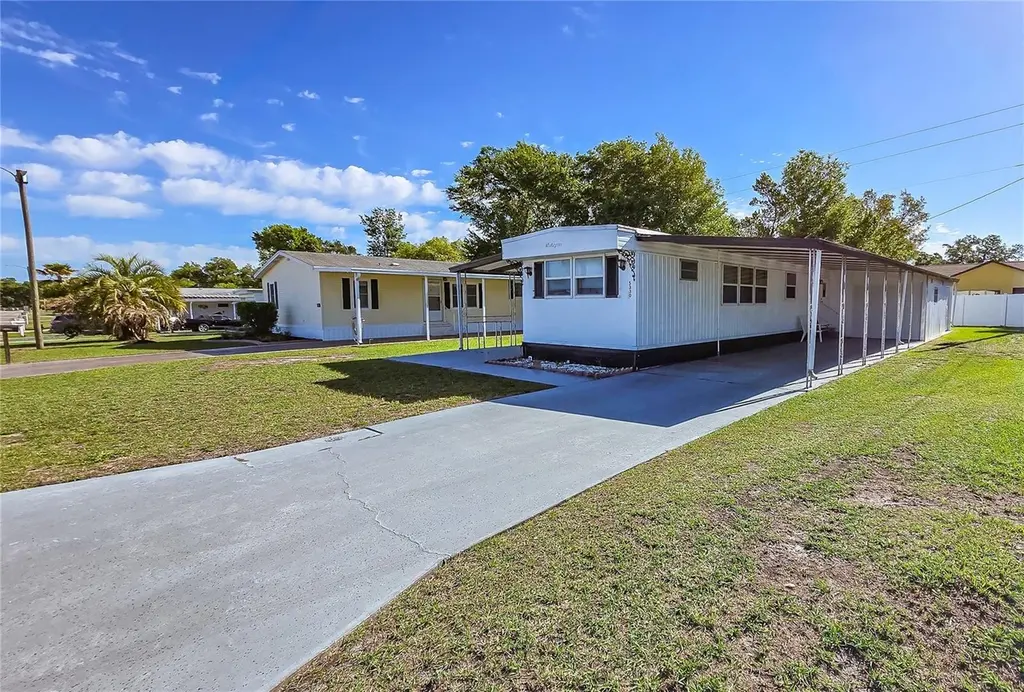
5330 Betmar Dr · Zephyrhills West, FL
Flood risk 1/10 · Minimal
- FEMA flood zone
- X (unshaded)
- Chance of flooding over 30 yrs
- 0.0%
- Est. flood insurance / yr
- $507 – $1,088
Fire risk 4/10 · Minor
- Est. fire insurance / yr
- $947 – $1,759
Heat risk 9/10 · Severe
- Hot days now (above 108°F)
- 7 days/yr
- Hot days in 30 yrs
- 24 days/yr
Wind risk 9/10 · Severe
- Chance of severe wind over 30 yrs
- 99.0%
Air-quality risk 2/10 · Minimal
- Unhealthy air days now
- 1 days/yr
- Unhealthy air days in 30 yrs
- 2 days/yr
Risk factors via First Street. Map © Google.
Why this score? — see what drove the D+ grade
The composite is a weighted blend of 9 inputs, each scored 0–100. Each bar is that input's sub-score; the figure is the points it added to the 100-point composite (weight × sub-score).
- Cash flow +22.4/30.0
- DSCR +7.2/10.0
- 1% rule +6.4/10.0
- Schools +4.3/10.0
- Livability +3.1/5.0
- Condition / age +2.5/5.0
- Rent growth +1.6/5.0
- ARV discount +0.0/15.0
- Appreciation +0.0/10.0
$110,000
🖨 Deal sheet 📄 Offer letter ✓ Due diligence
Listing remarks
Welcome to Betmar Acres, a vibrant 55+ community where you own the land—no lot rent! This well-maintained and sound home offers peace of mind with recent updates, including a 2022 A/C system, a durable membrane roof, and double-pane windows for energy efficiency. A long carport provides ample parking and leads to a spacious garage with dual doors, allowing easy access—perfect for your golf cart and additional storage. Spacious back yard with a vinyl fence across the back, and would be easy to fence off the two sides. Inside, you’ll find a thoughtfully designed split-bedroom floor plan. The front bedroom includes a convenient half bath, ideal for guests. The home features a
Key facts
- Recent updates
- Membrane roof
- Spacious garage
Tags
Property features AI
Finance
- Other: Furnished; Living area reported as 848 square feet; Building area reported as 1,960 square feet; Lot size approximately 0.13 acres (about 520 sq meters); Directions: east on SR 54, left on Betmar Dr, left on 8th, right on Betmar Dr; home on the right
- Financial info: Lease restrictions apply; Total annual fees: $448; Total monthly fees: $37.33
- HOA & community: Has HOA (annual fee $448 / $37.33 monthly); Association fee includes common area taxes and security; Association recreation-owned amenities; Clubhouse; Deed restrictions; Dog park; Golf carts allowed; Pool; Sidewalks; Tennis courts; Street lights; Senior community; Pets allowed
Exterior
- Parking: Driveway; Garage with garage door opener (1 garage space); Attached garage; Carport (2 spaces); Golf cart garage
- Security: Community security included with association
- Utilities: Public water; Septic tank; Electricity available; Phone available; Water connected
- Home design: Residential mobile home (single wide); One story; Faces west
- Construction: Metal siding; Membrane roof; Crawlspace foundation; Built as completed condition
- Exterior features: Covered patio; Patio; Awnings; Rain gutters; Vinyl fencing; Paved public-maintained road
Interior
- Kitchen: Microwave; Range; Refrigerator; Electric water heater
- Bedrooms: 2 bedrooms
- Flooring: Carpet
- Bathrooms: 1 full bath; 1 half bath
- Heating & cooling: Central heating; Central air conditioning
- Interior features: Ceiling fans; Split bedroom floor plan; Double-pane windows
- Laundry & utility: Washer and dryer included; Laundry located in garage
Neighborhood map
What this means for you Summary
Snapshot
- This is a 2-bed/2.0-bath manufactured listed at $110k.
Deal economics
- At list price, monthly cash flow is $183 ($2k/yr) — positive.
- The deal already cash-flows at list — no discount required.
- Meets the 1% rule at list price ($1k rent vs $110k).
- Recommended offer: $103k (6.0% below list) — sets the bar for market timing.
Location & tenants
- Location reads 61/100 on livability (#772 in FL) — a middle-class / working-renter tenant base. Strengths: cost of living A+, housing A+; Watch: schools D-, amenities F, commute F.
- Pasco (suburban): math 50% / reading 52% proficiency, ranked #32 of 73 in FL (top 44%) — acceptable for families but not a draw, mixed tenant base, ~2y average lease.
- Market conditions: Rents falling (-3.6%/yr); 294 active listings in the ZIP; 18 comparable units currently listed for rent nearby; rentals at typical pace (median 24d on market — plan ~3-4 weeks tenant-placement turnaround); 6,765 units permitted in Pasco County in 2024 (1,250 in 5+ unit buildings).
- This rent runs 31% of the median local income ($49k/yr) — at the standard rent-burdened threshold; future hikes will face affordability resistance.
Forward outlook
- Local home prices are declining (-3.0%/yr); year-one equity from $761 of loan paydown is wiped out by about $3k of value loss. Plan a longer hold.
- Pasco County population projected at +29% by 2050 — long-run rental-demand tailwind backs the buy-and-hold thesis.
Negotiation context
- It's been on market 66 days — a 6% lower offer ($103k) is reasonable based on typical stale-listing flexibility.
- Current owner paid $31k; list at $110k implies a 255% gain — meaningful room to come down on a strong offer.
Risks & watch-outs
- Climate carrying-cost: severe wind risk, 99% chance of damaging wind over 30y; extreme-heat days projected 7→24/yr by 2055 (HVAC capex compounding) — expect insurance premiums to compound above CPI over the hold.
Questions for the listing agent
- It's been on market 66 days. Have you received any prior offers? Is the seller open to a 6% concession, seller financing, or rate buy-down credit?
- Built in 1969 — when were the roof, HVAC, electrical panel, plumbing, and water heater last replaced?
- What does the HOA fee cover, when was the last increase, and are there any pending special assessments or reserve-fund shortfalls?
- Why hasn't it sold? Are there any deal-killer items the seller is aware of (foundation, flood, title, zoning, code violations)?
- Is there a deadline driving the sale (1031 exchange, divorce, estate, relocation)? That informs how much negotiation room exists.
- Schools are D-rated, which usually means shorter tenancies and higher turnover. Who's the typical renter profile here, and what's been the actual vacancy rate?
- The area grade is low — what's the realistic commute time and amenity access for the typical tenant pool here? Any planned neighborhood developments (good or bad) we should know about?
- What's the average days-on-market for RENTAL listings here right now (not sales)? A rising rental-DOM trend means longer vacancies and softer asking-rent achievability than the comps imply.
- What's the recent tenant-quality profile in this submarket — average credit score on applications, eviction rate, late-payment / NSF rate, and stable-employment percentage? A property-management company in the area should have these aggregated.
- How much new for-sale + rental construction is in the pipeline within 1–3 miles? Heavy new supply typically softens prices + rents 12–24 months out; constrained supply supports both.
Investment metrics
- 1% rule
- 1.14% ✓
- Cap rate
- 8.29%
- Cash-on-cash
- 7.14%
- DSCR
- 1.32
- GRM
- 7.3
CMA / ARV
- ARV (on-the-fly)
- $79,968
- Comps found
- 12
Show comp detail 12 sales within ~0.75 mi
| Address | Dist | Beds/Ba | Sqft | Sold | Price | $/sf | Match |
|---|---|---|---|---|---|---|---|
| 5241 Bolton Dr | 0.09mi | 2/1.0 | 672 (0%) | 6mo | $80,000 | $119 | 86 |
| 37113 Lois Ave | 0.30mi | 2/1.0 | 672 (0%) | 3mo | $75,000 | $112 | 80 |
| 37137 Lois Ave | 0.27mi | 2/1.5 | 684 (+2%) | 4mo | $66,000 | $96 | 80 |
| 37302 Carol Ave | 0.08mi | 1/1.0 (-1) | 684 (+2%) | 7mo | $55,000 | $80 | 79 |
| 37112 Sandra Ave | 0.29mi | 2/1.5 | 664 (-1%) | 8mo | $70,000 | $105 | 76 |
| 5400 Amanda St | 0.36mi | 2/1.0 | 672 (0%) | 8mo | $105,000 | $156 | 72 |
| 37031 Karen Ave | 0.39mi | 2/1.5 | 720 (+7%) | 1mo | $92,000 | $128 | 67 |
| 37020 Lois Ave | 0.39mi | 2/1.0 | 624 (-7%) | 2mo | $73,000 | $117 | 64 |
| 5251 Flint St | 0.16mi | 2/1.0 | 600 (-11%) | 8mo | $125,000 | $208 | 64 |
| 37042 Lois Ave | 0.36mi | 2/2.0 | 748 (+11%) | 8mo | $95,000 | $127 | 58 |
| 5318 Mary St | 0.26mi | 2/1.5 | 768 (+14%) | 11mo | $119,000 | $155 | 52 |
| 4927 Coral St | 0.67mi | 2/1.5 | 720 (+7%) | 12mo | $66,000 | $92 | 45 |
Match score weights: distance 35% · size 25% · config 20% · recency 20%. Top-matched comps best support the ARV.
Projected returns pro-forma
-3.0% appreciation · 0.0% rent growth · sell at horizon
- IRR
- -8.9%
- Equity multiple
- 0.68×
- Total profit
- $-9,772
- Equity at exit
- $16,401
- IRR
- -4.3%
- Equity multiple
- 0.76×
- Total profit
- $-7,476
- Equity at exit
- $9,511
Cash invested: $30,800 (down + closing). Projections, not guarantees.
Landlord ↔ Tenant lean methodology
- Overall (STATE)
- 87 Strongly Landlord-Friendly
- State Florida
- 87 Strongly Landlord-Friendly · R+3
- County
- — inherits STATE
- City
- — inherits STATE
ZIP-level market 33542
- Home prices YoY
- -20.6%
- Rents YoY
- -3.6%
- Active inventory
- 294
- Price-to-rent
- 7.3×
Monthly cashflow live
- Estimated rent
- $1,254 high interval (Pro) →
- Mortgage (P&I)
- −$577
- Tax from tax record
- −$147 /mo · $1,768/yr
- Insurance
- −$46
- HOA
- −$37
- Vacancy / Maint / Mgmt
- −$263
- Net cashflow
- $183
Break-even live
UW: 25.0% down · 7.5% · 30yr · 1.5% tax · 5.0% vac · 8.0% maint · 8.0% mgmt
Financing live
Cash to close
- Down payment
- $27,500
- Closing costs
- $3,300
- Reserves months
- —
- Total cash needed
- —
Loan-product check · same deal, 3 products live
Conventional
25% down · 7.5% · 30yr
- Down + closing
- —
- Monthly P&I
- —
- Monthly cashflow
- —
- DSCR
- —
- Eligible?
- —
Personal DTI + credit; lowest rate.
DSCR
20% down · 8.5% · 30yr
- Down + closing
- —
- Monthly P&I
- —
- Monthly cashflow
- —
- DSCR
- —
- Eligible?
- —
No personal income docs; deal must DSCR.
Hard money
10% down · 12.0% · 12mo
- Down + closing
- —
- Monthly P&I
- —
- Monthly cashflow
- —
- DSCR
- —
- Eligible?
- —
Short-term bridge; refi at stabilization.
Rent comps 18 comps
| Address | Beds | Baths | Sqft | Rent | $/sqft | DOM | Units | Dist |
|---|---|---|---|---|---|---|---|---|
| 5168 Crooked Ln Zephyrhills, FL | 2.0 | 1.0 | 600 | $1,645 | $2.74 | 21d | 1 | 0.43mi |
| 5611 1st St Zephyrhills, FL | 1.0 | 1.0 | 600 | $1,095 | $1.82 | 16d | 1 | 0.66mi |
| 4833 Royal Palm Dr Zephyrhills, FL | 2.0 | 1.0 | 672 | $1,090 | $1.62 | 24d | 1 | 0.76mi |
| 38044 6th Ave Unit 38044 Zephyrhills, FL | 1.0 | 1.0 | 494 | $950 | $1.92 | 24d | 1 | 0.76mi |
| 38010 14th Ave Apt 3 Zephyrhills, FL | 1.0 | 1.0 | 537 | $1,195 | $2.23 | 24d | 1 | 0.80mi |
| 6302 Abbott Station Dr Zephyrhills, FL | 3.0 | 1.0–2.5 | 855 | $1,732 | $2.02 | 1d | 142 | 0.97mi |
| 37925 Date Palm Dr Zephyrhills, FL | 3.0 | 1.5 | 720 | $1,300 | $1.81 | 24d | 1 | 0.98mi |
| 5150 6th St Zephyrhills, FL | 1.0 | 1.0 | 600 | $925 | $1.54 | 24d | 1 | 1.03mi |
| 5426 8th St #1 Zephyrhills, FL | 1.0 | 1.0 | 432 | $1,150 | $2.66 | 24d | 1 | 1.11mi |
| 5208 7th St Zephyrhills, FL | 1.0 | 1.0 | 550 | $950 | $1.73 | 4d | 1 | 1.14mi |
| 5214 7th St Zephyrhills, FL | 1.0 | 1.0 | 550 | $1,100 | $2.00 | 16d | 1 | 1.15mi |
| 5214 7th St Zephyrhills, FL | 1.0 | 1.0 | 550 | $950 | $1.73 | 4d | 1 | 1.15mi |
| 5206 7th St Zephyrhills, FL | 1.0 | 1.0 | 550 | $950 | $1.73 | 4d | 1 | 1.15mi |
| 6052 10th St Zephyrhills, FL | 2.0 | 1.0 | 644 | $1,200 | $1.86 | 24d | 1 | 1.30mi |
| 4412 Plum St Zephyrhills, FL | 1.0 | 1.0 | 624 | $1,100 | $1.76 | 24d | 1 | 1.35mi |
| 4410 Plum St Zephyrhills, FL | 1.0 | 1.0 | 624 | $1,100 | $1.76 | 24d | 1 | 1.35mi |
| 4352 6th St Zephyrhills, FL | 1.0 | 1.0 | 494 | $1,100 | $2.23 | 24d | 1 | 1.46mi |
| 5217 17th St Zephyrhills, FL | 1.0 | 1.0 | 540 | $1,050 | $1.94 | 24d | 1 | 1.48mi |
HOA detail
- Monthly dues
- $37 · $444/yr
Listing history 15 events
-
2026-06-18days on market $110,000 Active 66 DOM
-
2026-06-17days on market $110,000 Active 65 DOM
-
2026-06-16days on market $110,000 Active 64 DOM
-
2026-06-15days on market $110,000 Active 63 DOM
-
2026-06-13days on market $110,000 Active 61 DOM
-
2026-06-09days on market $110,000 Active 57 DOM
-
2026-06-08days on market $110,000 Active 56 DOM
-
2026-06-07days on market $110,000 Active 55 DOM
-
2026-06-04days on market $110,000 Active 52 DOM
-
2026-06-03days on market $110,000 Active 51 DOM
-
2026-06-02days on market $110,000 Active 50 DOM
-
2026-06-01days on market $110,000 Active 49 DOM
-
2026-05-31days on market $110,000 Active 48 DOM
-
2026-04-13$110,000 Active
-
1996-01-30soldstatus $31,000
ⓘ Source: listings_history table (triggers on properties + properties_extension) + one-shot
backfill from property_details.listing_events for pre-trigger history.
Tax reassessment forecast FL · Resets to sale price
- Current annual tax
- $1,768 · $147/mo
- Projected year-2 tax
- $1,768 · $147/mo
- Expected delta
- $0/yr ($0/mo · 0.0%)
ⓘ Screening estimate from a state-policy table — verify with the county assessor before closing.
Climate risk First Street
- Flood 1/10 Low FEMA zone X (unshaded) · 0% chance over 30 yrs
- Wildfire 4/10 Moderate
- Heat 9/10 Extreme 7 d/yr ≥108°F today · 24 d/yr by 30 yrs out
- Wind 9/10 Extreme 99% chance of damaging wind over 30 yrs
- Air quality 2/10 Low 1 unhealthy d/yr today · 2 by 30 yrs out
Nearby sold comps map
Loading sold comps map…
Walkable amenities ~0.75 mi
Loading nearby amenities…
Taxation est. · year 1
- Rental income
- $15,044
- − Mortgage interest
- −$6,162
- − Property taxes
- −$1,768
- − Insurance
- −$550
- − Repairs & maintenance
- −$1,204
- − Management
- −$1,204
- − HOA
- −$444
- − Depreciation
- −$3,200
- Taxable income
- $513
- Est. tax owed @ 24.0%
- −$123
- After-tax cash flow
- $2,077/yr
For passive investors: Depreciation is non-cash, so a rental often shows a tax loss while cash-flowing — sheltering income. Rental losses are passive: they offset passive income freely, and up to $25,000/yr can offset ordinary (W-2) income if you actively participate and your MAGI is under $100k (phasing out to $0 by $150k); unused losses carry forward. On sale, claimed depreciation is recaptured at up to 25%, and gains may owe capital-gains tax (a 1031 exchange can defer both). Figures are a year-1 estimate at your 24.0% rate — not tax advice; consult a CPA.
Schools (NCES district)
- District
- Pasco
- NCES district ID
- 1201530
- Math proficiency
- 50% ▼ -10.00%
- Reading proficiency
- 52% ▼ -5.00%
- Median HH income
- $45,039
- Composite
- 43.14/100
- National rank
- #3074
- State rank
- #32 of 73 in FL
Livability — Zephyrhills West
- Score
- 61/100
- State rank
- #772
- US rank
- #17403
Category grades
Schools grade is shown separately in the Schools card above.
Census & demographics
- Census place
- Zephyrhills West, FL
- County
- Pasco County · 524,098 people
- Metro
- Tampa-St. Petersburg-Clearwater, FL
- Population (ZIP)
- 23,612
- Household income
- $49,316
- Rent vs Own
- Severe rent burden
- 831.0
Population outlook (Pasco County) Hauer SSP2
- Today (2025)
- 570,045 people
- By 2030
- 605,844 · +6.3%
- By 2040
- 674,806 · +18.4%
- By 2050
- 736,022 · +29.1%
- By 2075
- 862,900 · +51.4%
- By 2100
- 906,364 · +59.0%
Race, ethnicity, and origin ACS 2023
- Neighborhood character
- Predominantly White (76%)
- Race & ethnicity
- White 76% Hispanic / Latino 17% Two or more races 8% Black 4% Asian 1%
- Hispanic origin (detail)
- Mexican 2% Puerto Rican 10%
- Common ancestry
- Lithuanian 3% Romanian 2% Iranian 2%
- Foreign-born
- 5% · Canada, Jamaica
- Languages at home
- 86% English-only · Spanish 12% Other Indo-European 1% Russian/Polish/Slavic 1%
Political lean MEDSL · Pasco
- 2024 margin
- Strong R (+25.2) · D 36.9% · R 62.1% · Other 1.0%
- 2008→2024 swing
- -21.6pp toward R · 2008: -3.6pp · 2024: -25.2pp
- All cycles
- 2024: R+25.2 2020: R+20.1 2016: R+21.6 2012: R+6.7 2008: R+3.6
Not yet ingested
- Civics
- —
Market trends
- HPI YoY
- ▼ -81.25%
- Current HPI
- 313.3993
- Rent YoY
- ▼ -3.56%
- Metro
- Tampa-St. Petersburg-Clearwater, FL
- State GDP YoY
- ▲ 3.28%
- F500 in state
- 36
Industry mix (Fortune 500 HQ in FL)
| Industry | F500 HQs | Revenue |
|---|---|---|
| Industrial Technology | 2 | $29B |
|
||
| Insurance | 2 | $17B |
|
||
| Retail | 1 | $60B |
|
||
| Technology Distribution | 1 | $58B |
|
||
| Homebuilding | 1 | $35B |
|
||
| Technology Manufacturing | 1 | $35B |
|
||
Price history
+254.8% since first listed2 events — show timeline
- 2026-04-13 Listed $110,000 Stellar MLS as Distributed by MLS Grid
- 1996-01-30 Sold (Public Records) $31,000 Public Records
Property tax history
+6.5%/yrLatest (2025): $1,768 · +4.9% YoY. Source: county tax records.
Cash-flow waterfall
monthlySold comps — $/sqft
last 12 mo · ≤1 miLoading sold comps…