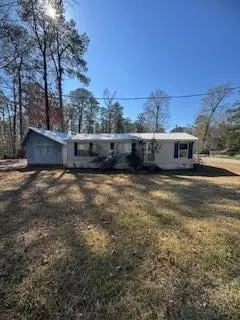
151 Daffodil Dr · Milam, TX
Flood risk 1/10 · Minimal
- FEMA flood zone
- —
- Chance of flooding over 30 yrs
- 0.0%
- Est. flood insurance / yr
- —
Fire risk 4/10 · Minor
- Est. fire insurance / yr
- $1,222 – $2,270
Heat risk 8/10 · Major
- Hot days now (above 110°F)
- 7 days/yr
- Hot days in 30 yrs
- 23 days/yr
Wind risk 8/10 · Major
- Chance of severe wind over 30 yrs
- 92.0%
Air-quality risk 1/10 · Minimal
- Unhealthy air days now
- 0 days/yr
- Unhealthy air days in 30 yrs
- 0 days/yr
Risk factors via First Street. Map © Google.
Why this score? — see what drove the C- grade
The composite is a weighted blend of 9 inputs, each scored 0–100. Each bar is that input's sub-score; the figure is the points it added to the 100-point composite (weight × sub-score).
- Cash flow +23.0/30.0
- ARV discount +7.5/15.0
- DSCR +7.4/10.0
- 1% rule +5.6/10.0
- Schools +3.2/10.0
- Livability +3.0/5.0
- Rent growth +2.5/5.0
- Condition / age +2.5/5.0
- Appreciation +0.0/10.0
$75,000
🖨 Deal sheet 📄 Offer letter ✓ Due diligence
Listing remarks
3B / 2B Double-Wide Mobile Home Near Lowe's Creek – Ideal for Lake Lovers. Located just 6.8 miles from the new SRA Park, this 3-bedroom, 2-bath double-wide mobile home is a hidden gem that needs a little TLC to shine. Some areas of the home have already been remodeled, and extra flooring will be left with the property for your convenience. Whether you're looking for a peaceful retreat, a home to make your own, or a camp to enjoy the nearby lake, this property is the perfect canvas for you. The home includes all appliances, so you can move in right away. Outside, you'll find a carport and a separate building that could be transformed into the ultimate man cave or workshop. This is an o
Key facts
- Some areas remodeled
- Carport
- 7,710 sq ft lot
Tags
Property features AI
Exterior
- Parking: Attached parking
- Home design: Residential mobile home; Located in Lowes Creek Village
- Construction: Vinyl siding
- Exterior features: Metal roof
Interior
- Flooring: Carpet; Vinyl; Wood
- Bathrooms: 2 full bathrooms
- Heating & cooling: Central air conditioning; Electric heating
- Interior features: Carpet flooring; Vinyl flooring; Wood flooring
Neighborhood map
What this means for you Summary
Snapshot
- This is a 3-bed/2.0-bath manufactured listed at $75k.
Deal economics
- At list price, monthly cash flow is $133 ($2k/yr) — positive.
- The deal already cash-flows at list — no discount required.
- Meets the 1% rule at list price ($796 rent vs $75k).
- Recommended offer: $73k (3.0% below list) — sets the bar for market timing.
- Cap rate 8.4% vs local median 1.9% in Milam — top-decile yield for the area; either an underpriced asset or a hidden risk that comps aren't pricing in. Stress-test before assuming the spread holds.
Location & tenants
- Location reads 59/100 on livability (#1,169 in TX) — a working-class tenant base; expect higher turnover. Strengths: cost of living A+, crime A, housing A-; Watch: schools F, amenities F, commute F.
- Hemphill ISD (rural): math 37% / reading 41% proficiency, ranked #466 of 826 in TX (top 56%) — families likely to look elsewhere, expect single-tenant / working-renter base with shorter leases.
- Market conditions: 235 active listings in the ZIP.
Forward outlook
- Local home prices are declining (-3.0%/yr); year-one equity from $519 of loan paydown is wiped out by about $2k of value loss. Plan a longer hold.
- Sabine County population projected at -23% by 2050 — secular population decline; favor cash flow + early exit over multi-decade hold.
Negotiation context
- It's been on market 52 days — a 3% lower offer ($73k) is reasonable based on typical stale-listing flexibility.
Risks & watch-outs
- Climate carrying-cost: severe wind risk, 92% chance of damaging wind over 30y; extreme-heat days projected 7→23/yr by 2055 (HVAC capex compounding) — expect insurance premiums to compound above CPI over the hold.
Questions for the listing agent
- It's been on market 52 days. Have you received any prior offers? Is the seller open to a 3% concession, seller financing, or rate buy-down credit?
- Is there a deadline driving the sale (1031 exchange, divorce, estate, relocation)? That informs how much negotiation room exists.
- Schools are F-rated, which usually means shorter tenancies and higher turnover. Who's the typical renter profile here, and what's been the actual vacancy rate?
- What's the average days-on-market for RENTAL listings here right now (not sales)? A rising rental-DOM trend means longer vacancies and softer asking-rent achievability than the comps imply.
- What's the recent tenant-quality profile in this submarket — average credit score on applications, eviction rate, late-payment / NSF rate, and stable-employment percentage? A property-management company in the area should have these aggregated.
- How much new for-sale + rental construction is in the pipeline within 1–3 miles? Heavy new supply typically softens prices + rents 12–24 months out; constrained supply supports both.
Investment metrics
- 1% rule
- 1.06% ✓
- Cap rate
- 8.43%
- Cash-on-cash
- 7.63%
- DSCR
- 1.34
- GRM
- 7.9
CMA / ARV
No comps found within radius.
Projected returns pro-forma
-3.0% appreciation · 3.0% rent growth · sell at horizon
- IRR
- -4.7%
- Equity multiple
- 0.83×
- Total profit
- $-3,654
- Equity at exit
- $11,183
- IRR
- 5.0%
- Equity multiple
- 1.37×
- Total profit
- $7,758
- Equity at exit
- $6,485
Cash invested: $21,000 (down + closing). Projections, not guarantees.
Landlord ↔ Tenant lean methodology
- Overall (STATE)
- 87 Strongly Landlord-Friendly
- State Texas
- 87 Strongly Landlord-Friendly · R+5
- County
- — inherits STATE
- City
- — inherits STATE
ZIP-level market 75948
- Home prices YoY
- -17.7%
- Active inventory
- 235
- Price-to-rent
- 7.9×
Monthly cashflow live
- Estimated rent
- $796 medium interval (Pro) →
- Mortgage (P&I)
- −$393
- Tax from tax record
- −$71 /mo · $851/yr
- Insurance
- −$31
- HOA
- −$0
- Vacancy / Maint / Mgmt
- −$167
- Net cashflow
- $133
Break-even live
UW: 25.0% down · 7.5% · 30yr · 1.5% tax · 5.0% vac · 8.0% maint · 8.0% mgmt
Financing live
Cash to close
- Down payment
- $18,750
- Closing costs
- $2,250
- Reserves months
- —
- Total cash needed
- —
Loan-product check · same deal, 3 products live
Conventional
25% down · 7.5% · 30yr
- Down + closing
- —
- Monthly P&I
- —
- Monthly cashflow
- —
- DSCR
- —
- Eligible?
- —
Personal DTI + credit; lowest rate.
DSCR
20% down · 8.5% · 30yr
- Down + closing
- —
- Monthly P&I
- —
- Monthly cashflow
- —
- DSCR
- —
- Eligible?
- —
No personal income docs; deal must DSCR.
Hard money
10% down · 12.0% · 12mo
- Down + closing
- —
- Monthly P&I
- —
- Monthly cashflow
- —
- DSCR
- —
- Eligible?
- —
Short-term bridge; refi at stabilization.
Listing history 17 events
-
2026-06-18days on market $75,000 Active 52 DOM
-
2026-06-17days on market $75,000 Active 51 DOM
-
2026-06-16days on market $75,000 Active 50 DOM
-
2026-06-15days on market $75,000 Active 49 DOM
-
2026-06-13days on market $75,000 Active 47 DOM
-
2026-06-12days on market $75,000 Active 46 DOM
-
2026-06-10days on market $75,000 Active 43 DOM
-
2026-06-08days on market $75,000 Active 42 DOM
-
2026-06-08days on market $75,000 Active 41 DOM
-
2026-06-07days on market $75,000 Active 40 DOM
-
2026-06-03days on market $75,000 Active 37 DOM
-
2026-06-02days on market $75,000 Active 36 DOM
-
2026-06-01days on market $75,000 Active 35 DOM
-
2026-05-31days on market $75,000 Active 34 DOM
-
2026-05-14price $75,000 835-char remark
-
2026-01-29$79,000 Active 835-char remark
-
2018-03-09soldstatus
ⓘ Source: listings_history table (triggers on properties + properties_extension) + one-shot
backfill from property_details.listing_events for pre-trigger history.
Tax reassessment forecast TX · Resets to sale price
- Current annual tax
- $851 · $71/mo
- Projected year-2 tax
- $1,372 · $114/mo
- Expected delta
- +$521/yr (+$43/mo · 61.2%)
ⓘ Screening estimate from a state-policy table — verify with the county assessor before closing.
Climate risk First Street
- Flood 1/10 Low 0% chance over 30 yrs
- Wildfire 4/10 Moderate
- Heat 8/10 Severe 7 d/yr ≥110°F today · 23 d/yr by 30 yrs out
- Wind 8/10 Severe 92% chance of damaging wind over 30 yrs
- Air quality 1/10 Low 0 unhealthy d/yr today · 0 by 30 yrs out
Nearby sold comps map
Loading sold comps map…
Walkable amenities ~0.75 mi
Loading nearby amenities…
Taxation est. · year 1
- Rental income
- $9,554
- − Mortgage interest
- −$4,201
- − Property taxes
- −$851
- − Insurance
- −$375
- − Repairs & maintenance
- −$764
- − Management
- −$764
- − Depreciation
- −$2,182
- Taxable income
- $416
- Est. tax owed @ 24.0%
- −$100
- After-tax cash flow
- $1,502/yr
For passive investors: Depreciation is non-cash, so a rental often shows a tax loss while cash-flowing — sheltering income. Rental losses are passive: they offset passive income freely, and up to $25,000/yr can offset ordinary (W-2) income if you actively participate and your MAGI is under $100k (phasing out to $0 by $150k); unused losses carry forward. On sale, claimed depreciation is recaptured at up to 25%, and gains may owe capital-gains tax (a 1031 exchange can defer both). Figures are a year-1 estimate at your 24.0% rate — not tax advice; consult a CPA.
Schools (NCES district)
- District
- Hemphill ISD
- NCES district ID
- 4822890
- Math proficiency
- 37% ▼ -1.00%
- Reading proficiency
- 41% ▲ 4.00%
- Median HH income
- $33,330
- Composite
- 32.06/100
- National rank
- #5821
- State rank
- #466 of 826 in TX
Livability — Milam
- Score
- 59/100
- State rank
- #1169
- US rank
- #20453
Category grades
Schools grade is shown separately in the Schools card above.
Census & demographics
- Population (ZIP)
- 5,218
Population outlook (Sabine County) Hauer SSP2
- Today (2025)
- 9,354 people
- By 2030
- 8,806 · -5.9%
- By 2040
- 7,871 · -15.9%
- By 2050
- 7,224 · -22.8%
- By 2075
- 6,351 · -32.1%
- By 2100
- 5,465 · -41.6%
Race, ethnicity, and origin ACS 2023
- Neighborhood character
- Predominantly White (78%)
- Race & ethnicity
- White 78% Hispanic / Latino 7% Black 6% Two or more races 6% Asian 3% Native American 2%
- Hispanic origin (detail)
- Mexican 5%
- Common ancestry
- Lithuanian 5% Italian 2% Serbian 1%
- Foreign-born
- 2% · Canada
- Languages at home
- 96% English-only · Vietnamese 2% Spanish 1%
Political lean MEDSL · Sabine
- 2024 margin
- Solid R (+78.5) · D 10.6% · R 89.1%
- 2008→2024 swing
- -23.7pp toward R · 2008: -54.8pp · 2024: -78.5pp
- All cycles
- 2024: R+78.5 2020: R+75.0 2016: R+72.8 2012: R+63.9 2008: R+54.8
Not yet ingested
- Civics
- —
Market trends
- HPI YoY
- ▼ -34.26%
- Current HPI
- 159.0093
- Rent YoY
- —
- Metro
- —
- State GDP YoY
- ▲ 3.95%
- F500 in state
- 110
Industry mix (Fortune 500 HQ in TX)
| Industry | F500 HQs | Revenue |
|---|---|---|
| Energy | 16 | $1,198B |
|
||
| Technology | 5 | $198B |
|
||
| Engineering / Construction | 4 | $72B |
|
||
| Energy Services | 3 | $60B |
|
||
| Utilities | 3 | $41B |
|
||
| Healthcare | 2 | $330B |
|
||
Price history
-5.1% since first listed3 events — show timeline
- 2026-05-14 Price Changed $75,000 Deep East Texas MLS
- 2026-01-29 Listed $79,000 Deep East Texas MLS
- 2018-03-09 Sold (Public Records) — Public Records
Property tax history
+7.8%/yrLatest (2025): $851 · +4.8% YoY. Source: county tax records.
Cash-flow waterfall
monthlySold comps — $/sqft
last 12 mo · ≤1 miLoading sold comps…