409 S Gilmor St · Baltimore, MD
Flood risk 1/10 · Minimal
- FEMA flood zone
- X (unshaded)
- Chance of flooding over 30 yrs
- 0.0%
- Est. flood insurance / yr
- $473 – $860
Fire risk 1/10 · Minimal
- Est. fire insurance / yr
- $755 – $1,403
Heat risk 7/10 · Major
- Hot days now (above 103°F)
- 7 days/yr
- Hot days in 30 yrs
- 15 days/yr
Wind risk 6/10 · Moderate
- Chance of severe wind over 30 yrs
- 27.0%
Air-quality risk 4/10 · Minor
- Unhealthy air days now
- 6 days/yr
- Unhealthy air days in 30 yrs
- 7 days/yr
Risk factors via First Street. Map © Google.
Why this score? — see what drove the B grade
The composite is a weighted blend of 9 inputs, each scored 0–100. Each bar is that input's sub-score; the figure is the points it added to the 100-point composite (weight × sub-score).
- Cash flow +30.0/30.0
- ARV discount +11.9/15.0
- 1% rule +10.0/10.0
- DSCR +10.0/10.0
- Rent growth +4.4/5.0
- Livability +3.8/5.0
- Condition / age +2.5/5.0
- Schools +1.0/10.0
- Appreciation +0.0/10.0
$78,000
🖨 Deal sheet 📄 Offer letter ✓ Due diligence
Listing remarks MLS
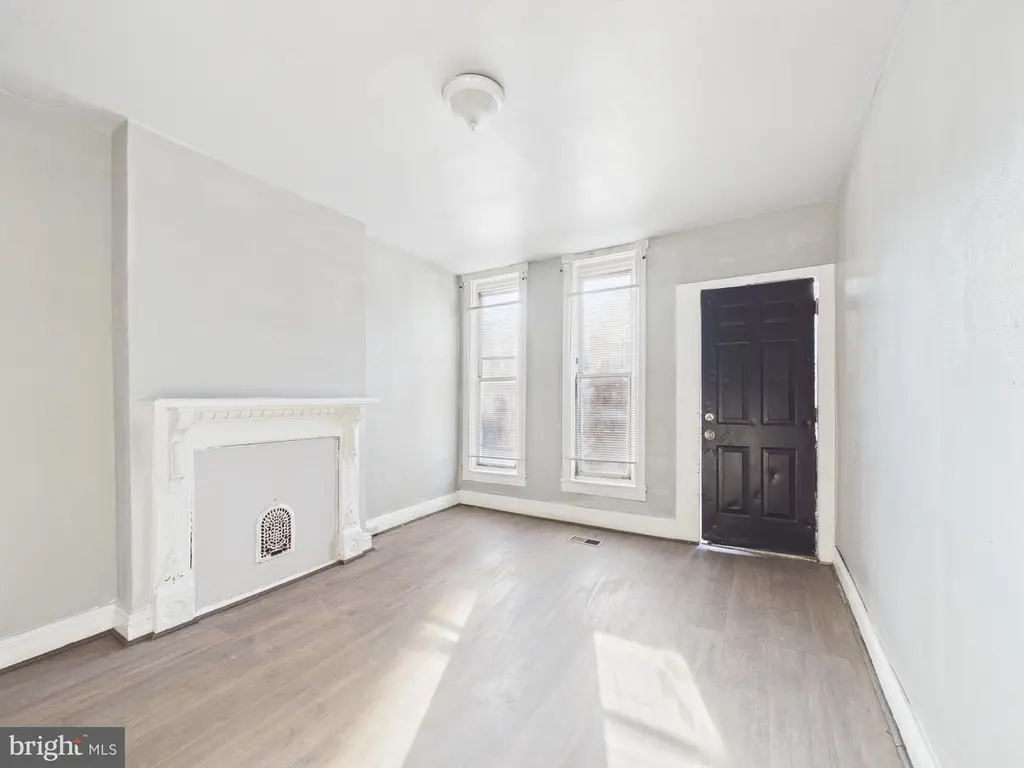
Great portfolio add or value-play in West/Southwest Baltimore! 3BR brick rowhome with luxury vinyl plank flooring, separate living room + dining area, and solid layout for a rental hold or renovate-to-resale strategy. Surrounding blocks show continued reinvestment and redevelopment momentum—Hollins Market’s revitalization, the growing UM BioPark / 4MLK life-science hub, and broader city/state-supported neighborhood initiatives add to the long-term upside. Convenient access to Downtown, UMB area, major commuter routes and transit. Buy, stabilize, and let the area grow around you. Sold strictly as-is—schedule your showing today.
Key facts
- Dining area
- Separate living room
- Transit
Tags
Neighborhood map
What this means for you Summary
Snapshot
- This is a 3-bed/1.0-bath townhouse listed at $78k.
Deal economics
- At list price, monthly cash flow is $858 ($10k/yr) — positive.
- The deal already cash-flows at list — no discount required.
- Meets the 1% rule at list price ($2k rent vs $78k).
- Recommended offer: $71k (9.0% below list) — sets the bar for market timing.
- Cap rate 19.5% vs local median 6.0% in Baltimore — top-decile yield for the area; either an underpriced asset or a hidden risk that comps aren't pricing in. Stress-test before assuming the spread holds.
Location & tenants
- Location reads 76/100 on livability (#90 in MD, #3,396 nationally) — a middle-class / working-renter tenant base. Strengths: amenities A+, commute A+, housing A+; Watch: schools D, crime F.
- Baltimore City Public Schools (urban): math 7% / reading 16% proficiency, ranked #24 of 24 in MD (top 100%) — low school quality limits family demand, transient renter base, plan for 1-2y turnover; 79% free/reduced lunch — lower-income household profile, screen leases tightly.
- Market conditions: Rents rising fast (+7.5%/yr); 422 active listings in the ZIP; 40 comparable units currently listed for rent nearby; rentals at typical pace (median 24d on market — plan ~3-4 weeks tenant-placement turnaround); 1,273 units permitted in Baltimore city in 2024 (1,104 in 5+ unit buildings).
- At $1,754/mo this rent would consume 46% of the median local household income ($46k/yr) (locally 1755% of renters already pay >50% of income on rent) — very limited rent-growth headroom before tenants either downsize or default.
Forward outlook
- Local home prices are declining (-3.0%/yr); year-one equity from $539 of loan paydown is wiped out by about $2k of value loss. Plan a longer hold.
- Baltimore County population projected to shrink 4% by 2050 — rents likely to lag national; underwrite the cash flow, not the appreciation.
- At projected returns (-3.0% appreciation + 7.5% rent growth), your $22k cash investment doubles in ~3 years — after that, you're playing with house money.
Negotiation context
- It's been on market 107 days — a 9% lower offer ($71k) is reasonable based on typical stale-listing flexibility.
- 2 sale attempts; this cycle's ask is 6991% above the opening price — seller raised mid-cycle; expect resistance to lowballs.
- Current owner paid $10k; list at $78k implies a 680% gain — meaningful room to come down on a strong offer.
Risks & watch-outs
- Watch-outs: built in 1920 — expect roof / HVAC / electrical / plumbing capex.
- Climate carrying-cost: major wind risk, 27% chance of damaging wind over 30y; extreme-heat days projected 7→15/yr by 2055 (HVAC capex compounding) — expect insurance premiums to compound above CPI over the hold.
Questions for the listing agent
- It's been on market 107 days. Have you received any prior offers? Is the seller open to a 9% concession, seller financing, or rate buy-down credit?
- Built in 1920 — when were the roof, HVAC, electrical panel, plumbing, and water heater last replaced?
- Why hasn't it sold? Are there any deal-killer items the seller is aware of (foundation, flood, title, zoning, code violations)?
- Is there a deadline driving the sale (1031 exchange, divorce, estate, relocation)? That informs how much negotiation room exists.
- Schools are D-rated, which usually means shorter tenancies and higher turnover. Who's the typical renter profile here, and what's been the actual vacancy rate?
- Crime grade is F in this area — have there been break-ins, vandalism, or insurance claims at this property in the last 3 years? What carrier currently insures it and at what premium?
- What's the average days-on-market for RENTAL listings here right now (not sales)? A rising rental-DOM trend means longer vacancies and softer asking-rent achievability than the comps imply.
- What's the recent tenant-quality profile in this submarket — average credit score on applications, eviction rate, late-payment / NSF rate, and stable-employment percentage? A property-management company in the area should have these aggregated.
- How much new for-sale + rental construction is in the pipeline within 1–3 miles? Heavy new supply typically softens prices + rents 12–24 months out; constrained supply supports both.
Investment metrics
- 1% rule
- 2.25% ✓
- Cap rate
- 19.50%
- Cash-on-cash
- 47.16%
- DSCR
- 3.10
- GRM
- 3.7
CMA / ARV
- ARV (median comp)
- $86,398
- List price
- $78,000
- Delta
- -9.72%
- Verdict
- FAIR
- Comps
- 20 within 1.0 mi
Show comp detail 12 sales within ~0.75 mi
| Address | Dist | Beds/Ba | Sqft | Sold | Price | $/sf | Match |
|---|---|---|---|---|---|---|---|
| 1404 Lemmon St | 0.24mi | 3/2.0 | 1,100 (0%) | 1mo | $189,000 | $172 | 84 |
| 1244 Carroll St | 0.46mi | 3/1.5 | 1,140 (+4%) | 0mo | $213,900 | $188 | 70 |
| 2402 Wilkens Ave | 0.67mi | 2/1.0 (-1) | 1,092 (-1%) | 0mo | $45,000 | $41 | 62 |
| 1226 W Pratt St | 0.31mi | 2/1.5 (-1) | 1,000 (-9%) | 2mo | $80,000 | $80 | 62 |
| 915 Washington Blvd | 0.55mi | 2/1.5 (-1) | 1,142 (+4%) | 2mo | $197,500 | $173 | 59 |
| 1110 W Lombard St | 0.43mi | 3/2.5 | 1,206 (+10%) | 1mo | $180,000 | $149 | 57 |
| 1145 W Cross St | 0.57mi | 2/1.5 (-1) | 1,172 (+6%) | 2mo | $121,900 | $104 | 54 |
| 2130 Eagle St | 0.46mi | 4/2.0 (+1) | 1,000 (-9%) | 2mo | $78,110 | $78 | 52 |
| 528 S Bentalou St | 0.58mi | 4/3.0 (+1) | 1,032 (-6%) | 0mo | $190,000 | $184 | 49 |
| 121 Parkin St | 0.66mi | 3/2.0 | 1,208 (+10%) | 0mo | $175,000 | $145 | 49 |
| 835 1/2 W Lombard St | 0.73mi | 3/1.0 | 1,242 (+13%) | 1mo | $255,000 | $205 | 43 |
| 509 Otterbein St | 0.74mi | 2/2.0 (-1) | 1,215 (+10%) | 2mo | $232,500 | $191 | 38 |
Match score weights: distance 35% · size 25% · config 20% · recency 20%. Top-matched comps best support the ARV.
Projected returns pro-forma
-3.0% appreciation · 7.51% rent growth · sell at horizon
- IRR
- 49.5%
- Equity multiple
- 3.31×
- Total profit
- $50,370
- Equity at exit
- $11,630
- IRR
- 56.9%
- Equity multiple
- 7.95×
- Total profit
- $151,825
- Equity at exit
- $6,744
Cash invested: $21,840 (down + closing). Projections, not guarantees.
Landlord ↔ Tenant lean methodology
- Overall (CITY)
- 12 Strongly Tenant-Friendly
- State Maryland
- 27 Tenant-Leaning · D+14
- County
- — inherits STATE
- City Baltimore
- 12 Strongly Tenant-Friendly · D+58
ZIP-level market 21223
- Rents YoY
- 7.5%
- Active inventory
- 422
- Price-to-rent
- 3.7×
Monthly cashflow live
- Estimated rent
- $1,754 high interval (Pro) →
- Mortgage (P&I)
- −$409
- Tax from tax record
- −$86 /mo · $1,033/yr
- Insurance
- −$32
- HOA
- −$0
- Vacancy / Maint / Mgmt
- −$368
- Net cashflow
- $858
Break-even live
UW: 25.0% down · 7.5% · 30yr · 1.5% tax · 5.0% vac · 8.0% maint · 8.0% mgmt
Financing live
Cash to close
- Down payment
- $19,500
- Closing costs
- $2,340
- Reserves months
- —
- Total cash needed
- —
Loan-product check · same deal, 3 products live
Conventional
25% down · 7.5% · 30yr
- Down + closing
- —
- Monthly P&I
- —
- Monthly cashflow
- —
- DSCR
- —
- Eligible?
- —
Personal DTI + credit; lowest rate.
DSCR
20% down · 8.5% · 30yr
- Down + closing
- —
- Monthly P&I
- —
- Monthly cashflow
- —
- DSCR
- —
- Eligible?
- —
No personal income docs; deal must DSCR.
Hard money
10% down · 12.0% · 12mo
- Down + closing
- —
- Monthly P&I
- —
- Monthly cashflow
- —
- DSCR
- —
- Eligible?
- —
Short-term bridge; refi at stabilization.
Rent comps 40 comps
| Address | Beds | Baths | Sqft | Rent | $/sqft | DOM | Units | Dist |
|---|---|---|---|---|---|---|---|---|
| 305 S Calhoun St Baltimore, MD | 2.0 | 1.0 | 1000 | $1,300 | $1.30 | 21d | 1 | 0.18mi |
| 1262 Glyndon Ave Baltimore, MD | 2.0 | 3.0 | 1258 | $1,850 | $1.47 | 23d | 1 | 0.30mi |
| 1324 W Lombard St Unit 1 Baltimore, MD | 2.0 | 2.0 | 1100 | $1,500 | $1.36 | 23d | 1 | 0.31mi |
| 1324 W Lombard St Unit 2 Baltimore, MD | 2.0 | 1.5 | 1100 | $1,450 | $1.32 | 43d | 1 | 0.31mi |
| 1303 James St Baltimore, MD | 2.0 | 1.5 | 1160 | $1,350 | $1.16 | 23d | 1 | 0.32mi |
| 514 S Payson St Unit 2 Baltimore, MD | 3.0 | 2.0 | 1264 | $1,750 | $1.38 | 43d | 1 | 0.33mi |
| 1101 S Carey St Baltimore, MD | 2.0 | 2.0 | 1400 | $1,200 | $0.86 | 21d | 1 | 0.33mi |
| 1635 Frederick Ave Baltimore, MD | 3.0 | 2.0 | 1224 | $1,850 | $1.51 | 43d | 1 | 0.34mi |
| 1315 Hollins St Unit 2 Baltimore, MD | 3.0 | 2.0 | 1096 | $1,950 | $1.78 | 12d | 1 | 0.35mi |
| 1315 Hollins St Unit 2 Baltimore, MD | 3.0 | 2.0 | 1096 | $1,860 | $1.70 | 4d | 1 | 0.35mi |
| 1601 Frederick Ave Unit 3 Baltimore, MD | 2.0 | 1.0 | 1050 | $1,050 | $1.00 | 4d | 1 | 0.35mi |
| 104 S Carrollton Ave Baltimore, MD | 3.0 | 4.0 | 1232 | $2,400 | $1.95 | 4d | 1 | 0.36mi |
| 1127 S Carey St Baltimore, MD | 3.0 | 2.5 | 1340 | $1,900 | $1.42 | 4d | 1 | 0.37mi |
| 1215 James St Baltimore, MD | 2.0 | 1.0 | 960 | $1,500 | $1.56 | 43d | 1 | 0.37mi |
| 1253 Sargeant St Baltimore, MD | 2.0 | 1.5 | 1200 | $1,695 | $1.41 | 23d | 1 | 0.38mi |
| 1259 Washington Blvd Baltimore, MD | 3.0 | 3.0 | 1232 | $2,999 | $2.43 | 4d | 1 | 0.41mi |
| 10 S Carey St Baltimore, MD | 2.0 | 1.0 | 1140 | $1,550 | $1.36 | 23d | 1 | 0.41mi |
| 1115 W Lombard St Baltimore, MD | 3.0 | 1.0 | 1468 | $2,100 | $1.43 | 43d | 1 | 0.41mi |
| 1243 Washington Blvd Baltimore, MD | 3.0 | 2.0 | 1148 | $1,950 | $1.70 | 43d | 1 | 0.41mi |
| 1111 W Lombard St Baltimore, MD | 3.0 | 1.0 | 1200 | $1,295 | $1.08 | 4d | 1 | 0.42mi |
| 1142 Sargeant St Baltimore, MD | 3.0 | 2.0 | 1080 | $1,601 | $1.48 | 2d | 1 | 0.43mi |
| 1432 Carroll St Baltimore, MD | 2.0 | 1.5 | 912 | $1,900 | $2.08 | 43d | 1 | 0.44mi |
| 1160 Washington Blvd Baltimore, MD | 2.0 | 1.0 | 960 | $1,575 | $1.64 | 23d | 1 | 0.45mi |
| 1127 Sargeant St Baltimore, MD | 2.0 | 1.5 | 1080 | $1,275 | $1.18 | 23d | 1 | 0.45mi |
| 1163 Washington Blvd Baltimore, MD | 2.0 | 2.5 | 1012 | $1,700 | $1.68 | 12d | 1 | 0.46mi |
| 1912 W Baltimore St Unit 2 Baltimore, MD | 2.0 | 1.5 | 1200 | $2,100 | $1.75 | 23d | 1 | 0.47mi |
| 1918 W Baltimore St Baltimore, MD | 2.0–3.0 | 1.0–2.0 | 857 | $1,434 | $1.67 | 43d | 1 | 0.47mi |
| 1125 Washington Blvd Baltimore, MD | 4.0 | 2.5 | 1200 | $2,750 | $2.29 | 17d | 1 | 0.48mi |
| 307 S Smallwood St Baltimore, MD | 2.0 | 2.5 | 1400 | $1,350 | $0.96 | 43d | 1 | 0.49mi |
| 1839 W Fayette St Baltimore, MD | 3.0 | 1.5 | 1426 | $1,675 | $1.17 | 23d | 1 | 0.50mi |
| 923 McHenry St Baltimore, MD | 3.0 | 1.0 | 1008 | $1,625 | $1.61 | 43d | 1 | 0.52mi |
| 1205 Cleveland St Baltimore, MD | 2.0 | 2.0 | 1232 | $1,900 | $1.54 | 43d | 1 | 0.54mi |
| 1000 Hollins St Unit 1000 Hollins Baltimore, MD | 3.0 | 2.5 | 1472 | $2,600 | $1.77 | 44d | 1 | 0.55mi |
| 913 W Lombard St Baltimore, MD | 3.0 | 1.0 | 1452 | $1,600 | $1.10 | 23d | 1 | 0.56mi |
| 1519 Penrose Ave Baltimore, MD | 3.0 | 2.0 | 1200 | $1,875 | $1.56 | 43d | 1 | 0.57mi |
| 847 McHenry St Baltimore, MD | 2.0 | 2.0 | 952 | $1,795 | $1.89 | 4d | 1 | 0.57mi |
| 1132 Nanticoke St Baltimore, MD | 2.0 | 2.5 | 1500 | $1,875 | $1.25 | 23d | 1 | 0.60mi |
| 853 Reinhart St Baltimore, MD | 2.0 | 2.5 | 780 | $1,800 | $2.31 | 43d | 1 | 0.61mi |
| 2225 W Baltimore St Baltimore, MD | 3.0 | 2.5 | 1200 | $1,600 | $1.33 | 23d | 1 | 0.64mi |
| 508 Wyeth St Baltimore, MD | 3.0 | 3.0 | 1234 | $1,850 | $1.50 | 43d | 1 | 0.66mi |
Listing history 17 events
-
2026-06-18days on market $78,000 Active 107 DOM
-
2026-06-17days on market $78,000 Active 106 DOM
-
2026-06-16days on market $78,000 Active 105 DOM
-
2026-06-15days on market $78,000 Active 104 DOM
-
2026-06-13days on market $78,000 Active 102 DOM
-
2026-06-09days on market $78,000 Active 98 DOM
-
2026-06-08days on market $78,000 Active 97 DOM
-
2026-06-07days on market $78,000 Active 96 DOM
-
2026-06-04days on market $78,000 Active 93 DOM
-
2026-06-03days on market $78,000 Active 92 DOM
-
2026-06-02days on market $78,000 Active 91 DOM
-
2026-06-01days on market $78,000 Active 90 DOM
-
2026-05-31days on market $78,000 Active 89 DOM
-
2026-04-29historical $1,100
-
2026-04-23$1,100
-
2026-03-03$78,000 Active 652-char remark
Show marketing remark (652 chars)
Great portfolio add or value-play in West/Southwest Baltimore! 3BR brick rowhome with luxury vinyl plank flooring, separate living room + dining area, and solid layout for a rental hold or renovate-to-resale strategy. Surrounding blocks show continued reinvestment and redevelopment momentum—Hollins Market’s revitalization, the growing UM BioPark / 4MLK life-science hub, and broader city/state-supported neighborhood initiatives add to the long-term upside. Convenient access to Downtown, UMB area, major commuter routes and transit. Buy, stabilize, and let the area grow around you. Sold strictly as-is—schedule your showing today.
-
1998-01-23soldstatus $10,000
ⓘ Source: listings_history table (triggers on properties + properties_extension) + one-shot
backfill from property_details.listing_events for pre-trigger history.
Tax reassessment forecast MD · Partial reset (capped growth)
- Current annual tax
- $1,033 · $86/mo
- Projected year-2 tax
- $1,033 · $86/mo
- Expected delta
- $0/yr ($0/mo · 0.0%)
ⓘ Screening estimate from a state-policy table — verify with the county assessor before closing.
Climate risk First Street
- Flood 1/10 Low FEMA zone X (unshaded) · 0% chance over 30 yrs
- Wildfire 1/10 Low
- Heat 7/10 Severe 7 d/yr ≥103°F today · 15 d/yr by 30 yrs out
- Wind 6/10 Major 27% chance of damaging wind over 30 yrs
- Air quality 4/10 Moderate 6 unhealthy d/yr today · 7 by 30 yrs out
Nearby sold comps map
Loading sold comps map…
Walkable amenities ~0.75 mi
Loading nearby amenities…
Taxation est. · year 1
- Rental income
- $21,053
- − Mortgage interest
- −$4,369
- − Property taxes
- −$1,033
- − Insurance
- −$390
- − Repairs & maintenance
- −$1,684
- − Management
- −$1,684
- − Depreciation
- −$2,269
- Taxable income
- $9,623
- Est. tax owed @ 24.0%
- −$2,309
- After-tax cash flow
- $7,990/yr
For passive investors: Depreciation is non-cash, so a rental often shows a tax loss while cash-flowing — sheltering income. Rental losses are passive: they offset passive income freely, and up to $25,000/yr can offset ordinary (W-2) income if you actively participate and your MAGI is under $100k (phasing out to $0 by $150k); unused losses carry forward. On sale, claimed depreciation is recaptured at up to 25%, and gains may owe capital-gains tax (a 1031 exchange can defer both). Figures are a year-1 estimate at your 24.0% rate — not tax advice; consult a CPA.
Schools (NCES district)
- District
- Baltimore City Public Schools
- NCES district ID
- 2400090
- Math proficiency
- 7% ▼ -9.00%
- Reading proficiency
- 16% ▼ -5.00%
- Median HH income
- $42,108
- Composite
- 10.08/100
- National rank
- #9805
- State rank
- #24 of 24 in MD
Livability — Baltimore
- Score
- 76/100
- State rank
- #90
- US rank
- #3396
Category grades
Schools grade is shown separately in the Schools card above.
Census & demographics
- Census place
- Baltimore, MD
- County
- Baltimore City · 558,601 people
- City population
- 588,727
- Metro
- Baltimore-Columbia-Towson, MD
- Population (ZIP)
- 19,572
- Household income
- $45,840
- Rent vs Own
- Severe rent burden
- 1755.0
Population outlook (Baltimore County) Hauer SSP2
- Today (2025)
- 624,249 people
- By 2030
- 621,541 · -0.4%
- By 2040
- 609,756 · -2.3%
- By 2050
- 597,249 · -4.3%
- By 2075
- 552,236 · -11.5%
- By 2100
- 513,934 · -17.7%
Race, ethnicity, and origin ACS 2023
- Neighborhood character
- Predominantly Black (72%)
- Race & ethnicity
- Black 72% White 16% Hispanic / Latino 7% Two or more races 6% Asian 1%
- Hispanic origin (detail)
- Mexican 3% Puerto Rican 1%
- Common ancestry
- Romanian 1%
- Foreign-born
- 8% · Canada
- Languages at home
- 90% English-only · Spanish 6% French/Haitian/Cajun 2% Other Indo-European 1%
Political lean MEDSL · Baltimore
- 2024 margin
- Solid D (+73.0) · D 85.2% · R 12.2% · Other 2.6%
- 2008→2024 swing
- -2.5pp toward R · 2008: 75.5pp · 2024: 73.0pp
- All cycles
- 2024: D+73.0 2020: D+76.6 2016: D+74.6 2012: D+76.4 2008: D+75.5
Not yet ingested
- Civics
- —
Market trends
- HPI YoY
- ▼ -97.99%
- Current HPI
- 140.5836
- Rent YoY
- ▲ 7.51%
- Metro
- Baltimore-Columbia-Towson, MD
- State GDP YoY
- ▲ 2.97%
- F500 in state
- 12
Industry mix (Fortune 500 HQ in MD)
| Industry | F500 HQs | Revenue |
|---|---|---|
| Aerospace / Defense | 1 | $71B |
|
||
| Utilities | 1 | $25B |
|
||
| Hotels | 1 | $24B |
|
||
| Consumer Goods | 1 | $7B |
|
||
| Real Estate | 1 | $6B |
|
||
| Chemicals | 1 | $2B |
|
||
Price history
-89.0% since first listed4 events — show timeline
- 2026-04-29 Rental Removed $1,100 SHOWMOJO
- 2026-04-23 Listed for Rent $1,100 SHOWMOJO
- 2026-03-03 Listed $78,000 BRIGHT MLS
- 1998-01-23 Sold (Public Records) $10,000 Public Records
Property tax history
+1.1%/yrLatest (2025): $1,033 · +2.3% YoY. Source: county tax records.
Cash-flow waterfall
monthlySold comps — $/sqft
last 12 mo · ≤1 miLoading sold comps…