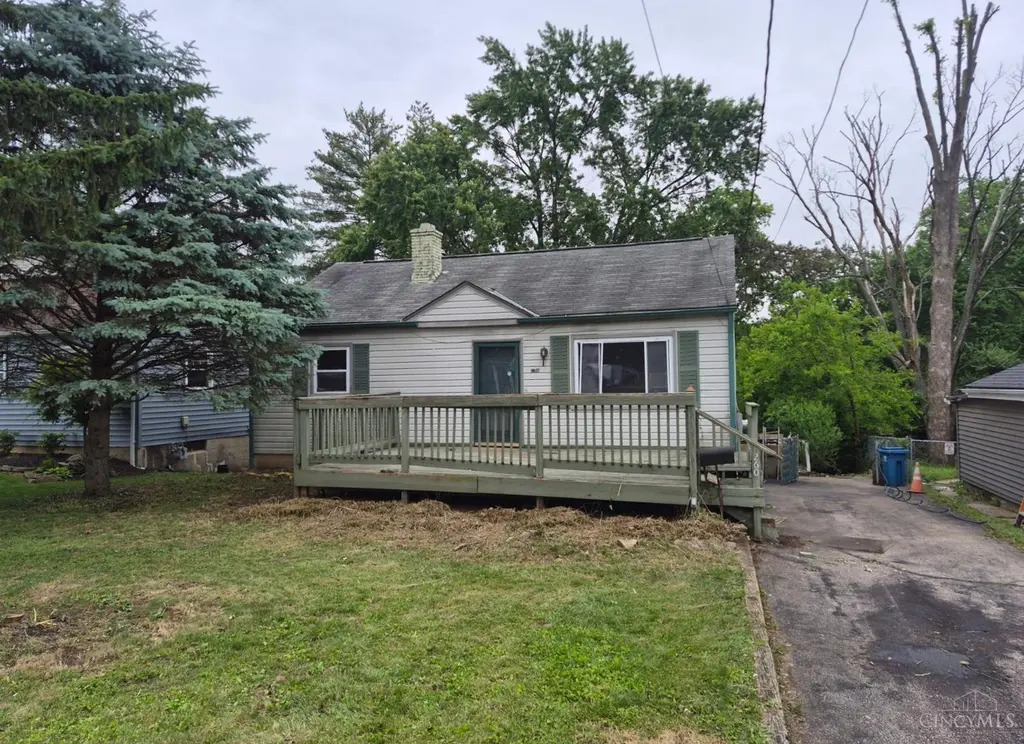
7260 Osceola Dr · Madeira, OH
Flood risk 1/10 · Minimal
- FEMA flood zone
- X (unshaded)
- Chance of flooding over 30 yrs
- 0.0%
- Est. flood insurance / yr
- $473 – $860
Fire risk 3/10 · Minor
- Est. fire insurance / yr
- $713 – $1,323
Heat risk 4/10 · Minor
- Hot days now (above 102°F)
- 7 days/yr
- Hot days in 30 yrs
- 19 days/yr
Wind risk 2/10 · Minimal
- Chance of severe wind over 30 yrs
- 1.0%
Air-quality risk 4/10 · Minor
- Unhealthy air days now
- 4 days/yr
- Unhealthy air days in 30 yrs
- 5 days/yr
Risk factors via First Street. Map © Google.
Why this score? — see what drove the D+ grade
The composite is a weighted blend of 9 inputs, each scored 0–100. Each bar is that input's sub-score; the figure is the points it added to the 100-point composite (weight × sub-score).
- ARV discount +15.0/15.0
- Cash flow +10.5/30.0
- Schools +7.6/10.0
- Livability +4.3/5.0
- 1% rule +3.4/10.0
- DSCR +3.0/10.0
- Rent growth +2.5/5.0
- Condition / age +2.5/5.0
- Appreciation +0.0/10.0
$239,000
🖨 Deal sheet 📄 Offer letter ✓ Due diligence
Listing remarks MLS
Best Buy In Madeira! Handyman Special With Newer Siding And Roof. Fenced Yd W/Storage Area. A Must See For The 1st Time Buyer Or Turnaround Investor. A Little Elbow Grease A Big Payback.
Key facts
- Working furnace
- Quality build
- 7,013 sq ft lot
Tags
Property features AI
Finance
- Other: Zoned residential; Lease not considered
- HOA & community: No HOA
Exterior
- Parking: Driveway
- Utilities: Public water; Public sewer; Natural gas
- Home design: Cape Cod style; Single family home; One level
- Construction: Aluminum siding; Shingle roof; Poured foundation
- Exterior features: In-ground pool; Vinyl windows
Interior
- Kitchen: Kitchen approximately 10 x 12
- Bedrooms: 3 bedrooms total; Primary bedroom on level 1 (11 x 14); Bedroom 2 on level 2 (10 x 12); Bedroom 3 on level 2 (12 x 12)
- Bathrooms: 2 full bathrooms; Full bathroom on level 1; Full bathroom in basement; Primary bathroom described as 'Other'
- Heating & cooling: Gas heating; Central air conditioning; Gas water heating
- Interior features: Full basement; 3 total rooms
Neighborhood map
What this means for you Summary
Snapshot
- This is a 3-bed/1.0-bath single-family listed at $239k.
Deal economics
- At list price, monthly cash flow is $-122 ($-1k/yr) — negative.
- To cash-flow at today's rent, offer at most $217k (9.0% below list).
- To meet the 1% rule (rent ≥ 1% of price), the offer needs to be $202k (15.6% below list).
- Recommended offer: $202k (15.6% below list) — sets the bar for 1% rule.
- Cap rate 5.7% vs local median 3.0% in Madeira — top-decile yield for the area; either an underpriced asset or a hidden risk that comps aren't pricing in. Stress-test before assuming the spread holds.
Location & tenants
- Location reads 86/100 on livability (#36 in OH, #347 nationally) — a professional / high-income tenant draw. Strengths: schools A+, crime A+, employment A+; Watch: amenities C-, commute D+.
- Madeira City (suburban): math 82% / reading 90% proficiency, ranked #13 of 656 in OH (top 2%) — strong family-tenant draw, lease renewals of 3-5y typical; only 6% free/reduced lunch — higher-income household profile.
- Market conditions: 37 active listings in the ZIP; 3 comparable units currently listed for rent nearby; rentals leasing fast (median 2d on market — plan ~1-2 weeks tenant-placement turnaround); high-income renter base; 801 units permitted in Hamilton County in 2024 (190 in 5+ unit buildings).
- This rent is only 14% of the median local income ($170k/yr) — well below the 30% rent-burden line; pricing power to push rent on renewal without tenant pushback.
Forward outlook
- Local home prices are declining (-3.0%/yr); year-one equity from $2k of loan paydown is wiped out by about $7k of value loss. Plan a longer hold.
Negotiation context
- Only 10 days on market — expect competitive offers; lowballing is unlikely to land.
- 2 sale attempts since 29y ago; this cycle's ask has dropped $36k (13%) from the opening price — seller is motivated, your offer sets the floor, not the list.
- Current owner paid $66k; list at $239k implies a 265% gain — meaningful room to come down on a strong offer.
Risks & watch-outs
- Watch-outs: built in 1946 — expect roof / HVAC / electrical / plumbing capex.
Questions for the listing agent
- What do current leases actually rent for vs. the listed asking? Can we see a recent rent roll and the last 12 months of T-12 income?
- Built in 1946 — when were the roof, HVAC, electrical panel, plumbing, and water heater last replaced?
- Is there a deadline driving the sale (1031 exchange, divorce, estate, relocation)? That informs how much negotiation room exists.
- Schools are A-rated — typically a magnet for longer-tenancy family renters. What's the average tenant stay here, and is there a school-zone premium baked into asking?
- The area grade is low — what's the realistic commute time and amenity access for the typical tenant pool here? Any planned neighborhood developments (good or bad) we should know about?
- What's the average days-on-market for RENTAL listings here right now (not sales)? A rising rental-DOM trend means longer vacancies and softer asking-rent achievability than the comps imply.
- What's the recent tenant-quality profile in this submarket — average credit score on applications, eviction rate, late-payment / NSF rate, and stable-employment percentage? A property-management company in the area should have these aggregated.
- How much new for-sale + rental construction is in the pipeline within 1–3 miles? Heavy new supply typically softens prices + rents 12–24 months out; constrained supply supports both.
Investment metrics
- 1% rule
- 0.84% ✗
- Cap rate
- 5.68%
- Cash-on-cash
- -2.19%
- DSCR
- 0.90
- GRM
- 9.9
CMA / ARV
- ARV (on-the-fly)
- $390,616
- Comps found
- 12
Show comp detail 12 sales within ~0.75 mi
| Address | Dist | Beds/Ba | Sqft | Sold | Price | $/sf | Match |
|---|---|---|---|---|---|---|---|
| 7265 Rita Ln | 0.17mi | 2/1.0 (-1) | 1,269 (+2%) | 6mo | $308,500 | $243 | 78 |
| 7287 Rita Ln | 0.25mi | 3/2.0 | 1,258 (+1%) | 8mo | $350,000 | $278 | 75 |
| 7237 Osceola Dr | 0.11mi | 3/1.5 | 1,382 (+11%) | 2mo | $345,000 | $250 | 72 |
| 7293 Jethve Ln | 0.37mi | 2/1.5 (-1) | 1,232 (-1%) | 10mo | $390,000 | $317 | 66 |
| 8246 Camargo Rd | 0.41mi | 2/1.0 (-1) | 1,200 (-4%) | 13mo | $292,000 | $243 | 59 |
| 7231 Osceola Dr | 0.14mi | 2/1.5 (-1) | 1,124 (-10%) | 14mo | $359,900 | $320 | 59 |
| 7244 Jethve Ln | 0.32mi | 3/1.5 | 1,123 (-10%) | 10mo | $400,000 | $356 | 58 |
| 7806 Locust Ln | 0.49mi | 4/2.0 (+1) | 1,258 (+1%) | 10mo | $386,000 | $307 | 58 |
| 7251 Miami Ave | 0.53mi | 3/2.0 | 1,192 (-4%) | 9mo | $500,000 | $419 | 57 |
| 7305 Thomas Dr | 0.32mi | 3/1.0 | 1,348 (+8%) | 17mo | $315,000 | $234 | 57 |
| 7821 Greenbriar Ln | 0.56mi | 3/1.0 | 1,149 (-8%) | 6mo | $375,000 | $326 | 56 |
| 7141 Wallace Ave | 0.71mi | 4/2.0 (+1) | 1,258 (+1%) | 10mo | $395,000 | $314 | 48 |
Match score weights: distance 35% · size 25% · config 20% · recency 20%. Top-matched comps best support the ARV.
Projected returns pro-forma
-3.0% appreciation · 3.0% rent growth · sell at horizon
- IRR
- -19.9%
- Equity multiple
- 0.31×
- Total profit
- $-46,426
- Equity at exit
- $35,636
- IRR
- -12.7%
- Equity multiple
- 0.25×
- Total profit
- $-50,144
- Equity at exit
- $20,664
Cash invested: $66,920 (down + closing). Projections, not guarantees.
Landlord ↔ Tenant lean methodology
- Overall (STATE)
- 73 Landlord-Friendly
- State Ohio
- 73 Landlord-Friendly · R+6
- County
- — inherits STATE
- City
- — inherits STATE
ZIP-level market 45243
- Active inventory
- 37
- Price-to-rent
- 9.9×
Monthly cashflow live
- Estimated rent
- $2,018 medium interval (Pro) →
- Mortgage (P&I)
- −$1,253
- Tax from tax record
- −$363 /mo · $4,358/yr
- Insurance
- −$100
- HOA
- −$0
- Vacancy / Maint / Mgmt
- −$424
- Net cashflow
- $-122
Break-even live
UW: 25.0% down · 7.5% · 30yr · 1.5% tax · 5.0% vac · 8.0% maint · 8.0% mgmt
Financing live
Cash to close
- Down payment
- $59,750
- Closing costs
- $7,170
- Reserves months
- —
- Total cash needed
- —
Loan-product check · same deal, 3 products live
Conventional
25% down · 7.5% · 30yr
- Down + closing
- —
- Monthly P&I
- —
- Monthly cashflow
- —
- DSCR
- —
- Eligible?
- —
Personal DTI + credit; lowest rate.
DSCR
20% down · 8.5% · 30yr
- Down + closing
- —
- Monthly P&I
- —
- Monthly cashflow
- —
- DSCR
- —
- Eligible?
- —
No personal income docs; deal must DSCR.
Hard money
10% down · 12.0% · 12mo
- Down + closing
- —
- Monthly P&I
- —
- Monthly cashflow
- —
- DSCR
- —
- Eligible?
- —
Short-term bridge; refi at stabilization.
Rent comps 3 comps
| Address | Beds | Baths | Sqft | Rent | $/sqft | DOM | Units | Dist |
|---|---|---|---|---|---|---|---|---|
| 7228 Osceola Dr Cincinnati, OH | 3.0 | 1.0 | 1300 | $1,800 | $1.38 | 43d | 1 | 0.17mi |
| 7214 Osceola Dr Cincinnati, OH | 3.0 | 1.0 | 1202 | $2,100 | $1.75 | 2d | 1 | 0.23mi |
| 5701 Kugler Mill Rd Cincinnati, OH | 2.0–3.0 | 2.0–2.5 | 1630 | $3,724 | $2.28 | 1d | 30 | 1.43mi |
Listing history 10 events
-
2026-06-15days on market $239,000 Active 10 DOM
-
2026-06-13days on market $239,000 Active 8 DOM
-
2026-06-13pricedays on market $239,000 Active 7 DOM
-
2026-06-09days on market $249,000 Active 4 DOM
-
2026-06-08days on market $249,000 Active 3 DOM
-
2026-06-07pricedays on market $249,000 Active 2 DOM
-
2026-05-22$275,000 Active
-
1998-04-20soldstatus $65,500
-
1998-04-16soldstatus $65,500 186-char remark
Show marketing remark (186 chars)
Best Buy In Madeira! Handyman Special With Newer Siding And Roof. Fenced Yd W/Storage Area. A Must See For The 1st Time Buyer Or Turnaround Investor. A Little Elbow Grease A Big Payback.
-
1997-11-29$67,450 186-char remark
Show marketing remark (186 chars)
Best Buy In Madeira! Handyman Special With Newer Siding And Roof. Fenced Yd W/Storage Area. A Must See For The 1st Time Buyer Or Turnaround Investor. A Little Elbow Grease A Big Payback.
ⓘ Source: listings_history table (triggers on properties + properties_extension) + one-shot
backfill from property_details.listing_events for pre-trigger history.
Tax reassessment forecast OH · Partial reset (capped growth)
- Current annual tax
- $4,358 · $363/mo
- Projected year-2 tax
- $4,358 · $363/mo
- Expected delta
- $0/yr ($0/mo · 0.0%)
ⓘ Screening estimate from a state-policy table — verify with the county assessor before closing.
Climate risk First Street
- Flood 1/10 Low FEMA zone X (unshaded) · 0% chance over 30 yrs
- Wildfire 3/10 Moderate
- Heat 4/10 Moderate 7 d/yr ≥102°F today · 19 d/yr by 30 yrs out
- Wind 2/10 Low 100% chance of damaging wind over 30 yrs
- Air quality 4/10 Moderate 4 unhealthy d/yr today · 5 by 30 yrs out
Nearby sold comps map
Loading sold comps map…
Walkable amenities ~0.75 mi
Loading nearby amenities…
Taxation est. · year 1
- Rental income
- $24,215
- − Mortgage interest
- −$13,388
- − Property taxes
- −$4,358
- − Insurance
- −$1,195
- − Repairs & maintenance
- −$1,937
- − Management
- −$1,937
- − Depreciation
- −$6,953
- Taxable loss
- −$5,553
- Est. tax savings @ 24.0%
- +$1,333
- After-tax cash flow
- $-131/yr
For passive investors: Depreciation is non-cash, so a rental often shows a tax loss while cash-flowing — sheltering income. Rental losses are passive: they offset passive income freely, and up to $25,000/yr can offset ordinary (W-2) income if you actively participate and your MAGI is under $100k (phasing out to $0 by $150k); unused losses carry forward. On sale, claimed depreciation is recaptured at up to 25%, and gains may owe capital-gains tax (a 1031 exchange can defer both). Figures are a year-1 estimate at your 24.0% rate — not tax advice; consult a CPA.
Schools (NCES district)
- District
- Madeira City
- NCES district ID
- 3904428
- Math proficiency
- 82% ▼ -10.00%
- Reading proficiency
- 90% ▼ -4.00%
- Median HH income
- $87,380
- Composite
- 76.18/100
- National rank
- #112
- State rank
- #13 of 656 in OH
Livability — Madeira
- Score
- 86/100
- State rank
- #36
- US rank
- #347
Category grades
Schools grade is shown separately in the Schools card above.
Census & demographics
- Census place
- Madeira, OH
- County
- Hamilton · 838,887 people
- Metro
- Cincinnati, OH-KY-IN
- Population (ZIP)
- 15,958
- Household income
- $170,006
- Rent vs Own
- Severe rent burden
- 16.3
Population outlook (Hamilton County) Hauer SSP2
- Today (2025)
- 826,054 people
- By 2030
- 830,947 · +0.6%
- By 2040
- 832,319 · +0.8%
- By 2050
- 822,428 · -0.4%
- By 2075
- 788,688 · -4.5%
- By 2100
- 710,674 · -14.0%
Race, ethnicity, and origin ACS 2023
- Neighborhood character
- Predominantly White (85%)
- Race & ethnicity
- White 85% Asian 5% Two or more races 4% Black 4% Hispanic / Latino 3%
- Common ancestry
- Slovak 3% Iranian 2% Italian 2%
- Foreign-born
- 9% · Canada, China
- Languages at home
- 90% English-only · Other Indo-European 3% Spanish 2% Other Asian/Pacific 1%
Political lean MEDSL · Hamilton
- 2024 margin
- D (+14.9) · D 57.0% · R 42.1%
- 2008→2024 swing
- +7.9pp toward D · 2008: 7.0pp · 2024: 14.9pp
- All cycles
- 2024: D+14.9 2020: D+15.9 2016: D+9.5 2012: D+4.9 2008: D+7.0
Not yet ingested
- Civics
- —
Market trends
- HPI YoY
- ▼ -373.87%
- Current HPI
- 228.6611
- Rent YoY
- —
- Metro
- —
- State GDP YoY
- ▲ 1.98%
- F500 in state
- 48
Industry mix (Fortune 500 HQ in OH)
| Industry | F500 HQs | Revenue |
|---|---|---|
| Insurance | 3 | $145B |
|
||
| Industrial Machinery | 3 | $49B |
|
||
| Financial Services | 3 | $24B |
|
||
| Consumer Goods | 2 | $93B |
|
||
| Aerospace / Defense | 2 | $47B |
|
||
| Utilities | 2 | $33B |
|
||
Price history
+307.7% since first listed4 events — show timeline
- 2026-05-22 Listed $275,000 Cincy MLS
- 1998-04-20 Sold (Public Records) $65,500 Public Records
- 1998-04-16 Sold (MLS) $65,500 Cincy MLS
- 1997-11-29 Listed $67,450 Cincy MLS
Property tax history
+6.2%/yrLatest (2025): $4,358 · +2.4% YoY. Source: county tax records.
Cash-flow waterfall
monthlySold comps — $/sqft
last 12 mo · ≤1 miLoading sold comps…