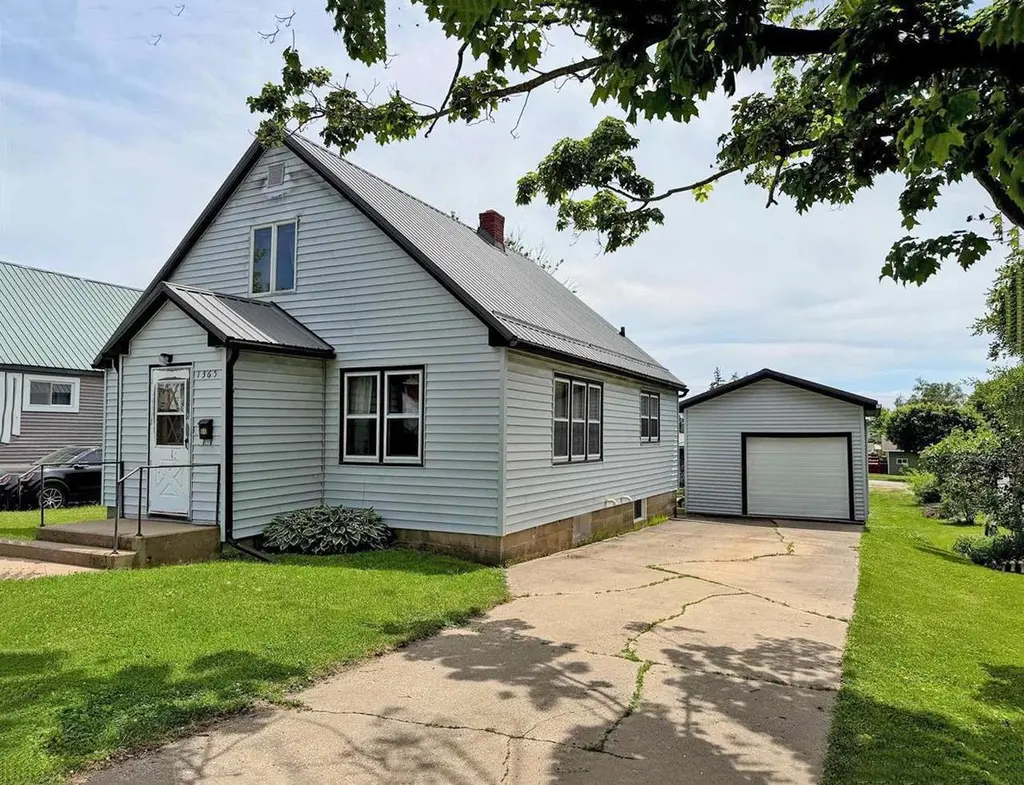
1365 11th St · Fennimore, WI
Flood risk 1/10 · Minimal
- FEMA flood zone
- X (unshaded)
- Chance of flooding over 30 yrs
- 0.0%
- Est. flood insurance / yr
- $473 – $860
Fire risk 1/10 · Minimal
- Est. fire insurance / yr
- $636 – $1,182
Heat risk 2/10 · Minimal
- Hot days now (above 99°F)
- 7 days/yr
- Hot days in 30 yrs
- 15 days/yr
Wind risk 2/10 · Minimal
- Chance of severe wind over 30 yrs
- —
Air-quality risk 1/10 · Minimal
- Unhealthy air days now
- 0 days/yr
- Unhealthy air days in 30 yrs
- 0 days/yr
Risk factors via First Street. Map © Google.
Why this score? — see what drove the D grade
The composite is a weighted blend of 9 inputs, each scored 0–100. Each bar is that input's sub-score; the figure is the points it added to the 100-point composite (weight × sub-score).
- Cash flow +10.4/30.0
- Appreciation +7.2/10.0
- ARV discount +5.6/15.0
- Livability +4.0/5.0
- Schools +3.6/10.0
- DSCR +3.0/10.0
- 1% rule +2.6/10.0
- Rent growth +2.5/5.0
- Condition / age +2.5/5.0
$135,000
🖨 Deal sheet (PDF) 📄 Offer letter ✓ Due diligence
Listing remarks
Charming 3-bedroom, 1-bath home located in the heart of Fennimore! This property features a brand-new metal roof, low-maintenance vinyl siding, a detached 1-car garage, and a full basement offering plenty of storage space. The home is equipped with a whole-house smoke alarm and carbon monoxide detection system for added peace of mind. Conveniently situated near downtown Fennimore, churches, shopping, restaurants, and other local amenities, you'll enjoy the convenience of small-town living with everything close by.
Key facts
- Metal roof
- Full basement
- Vinyl siding
Tags
Property features AI
Finance
- Other: Stove, refrigerator, washer, dryer and microwave included; Personal property excluded
Exterior
- Parking: Detached 1-car garage; One garage parking space
- Utilities: Municipal water; Municipal sewer; Natural gas
- Home design: 1.5-story single-family home; Estimated finished above-grade living area about 1,080
- Construction: Vinyl siding
- Exterior features: Vinyl exterior; Lot size approximately 0.17 acre; Zoned G-1
Interior
- Kitchen: Range/Oven; Refrigerator; Dishwasher; Microwave
- Bedrooms: Master bedroom (Main level) — approx. 11 x 11; Bedroom 2 (Main level) — approx. 8 x 11; Bedroom 3 (Upper level) — approx. 13 x 11
- Bathrooms: One full bathroom (includes master bath)
- Heating & cooling: Forced air heating (natural gas)
- Interior features: Full basement; Foyer
- Laundry & utility: Washer; Dryer
Neighborhood map
What this means for you Summary
Snapshot
- This is a 3-bed/1.0-bath single-family listed at $135k.
Deal economics
- At list price, monthly cash flow is $-72 ($-866/yr) — negative.
- To cash-flow at today's rent, offer at most $122k (9.4% below list).
- To meet the 1% rule (rent ≥ 1% of price), the offer needs to be $102k (24.5% below list).
- Recommended offer: $102k (24.5% below list) — sets the bar for 1% rule.
Location & tenants
- Location reads 80/100 on livability (#61 in WI, #1,676 nationally) — a professional / high-income tenant draw. Strengths: crime A+, cost of living A+, housing A+; Watch: amenities F, commute F.
- Fennimore Community School District (rural): math 41% / reading 42% proficiency, ranked #139 of 342 in WI (top 41%) — families likely to look elsewhere, expect single-tenant / working-renter base with shorter leases.
- Zoned schools: Fennimore Elementary (math 47% / reading 37%, grade F, #433 of 1,041 statewide, top 46%, 384 students, 41% FRL); Fennimore Middle (math 42% / reading 47%, grade D, #94 of 383 statewide, top 28%, 195 students, 40% FRL); Fennimore High (math 34% / reading 44%, grade F, #99 of 483 statewide, top 24%, 231 students, 32% FRL).
- Market conditions: 9 active listings in the ZIP; 120 units permitted in Grant County in 2024 (0 in 5+ unit buildings).
Forward outlook
- In year one you build about $7k of equity ($933 loan paydown + $6k appreciation (4.4% local appreciation)).
- Grant County population projected at +10% by 2050 — modest demand growth; plan on rents tracking national, not racing it.
- At projected returns (4.4% appreciation + 3.0% rent growth), your $38k cash investment doubles in ~6 years — after that, you're playing with house money.
- By year 6, paydown + projected appreciation supports a ~$37k cash-out refi (75% LTV) — recoverable capital for the next deal without selling this one.
Negotiation context
- Only 1 days on market — expect competitive offers; lowballing is unlikely to land.
Risks & watch-outs
- Watch-outs: built in 1947 — expect roof / HVAC / electrical / plumbing capex.
Questions for the listing agent
- What do current leases actually rent for vs. the listed asking? Can we see a recent rent roll and the last 12 months of T-12 income?
- Built in 1947 — when were the roof, HVAC, electrical panel, plumbing, and water heater last replaced?
- Is there a deadline driving the sale (1031 exchange, divorce, estate, relocation)? That informs how much negotiation room exists.
- Schools are B-rated — typically a magnet for longer-tenancy family renters. What's the average tenant stay here, and is there a school-zone premium baked into asking?
- The area grade is low — what's the realistic commute time and amenity access for the typical tenant pool here? Any planned neighborhood developments (good or bad) we should know about?
- What's the average days-on-market for RENTAL listings here right now (not sales)? A rising rental-DOM trend means longer vacancies and softer asking-rent achievability than the comps imply.
- What's the recent tenant-quality profile in this submarket — average credit score on applications, eviction rate, late-payment / NSF rate, and stable-employment percentage? A property-management company in the area should have these aggregated.
- How much new for-sale + rental construction is in the pipeline within 1–3 miles? Heavy new supply typically softens prices + rents 12–24 months out; constrained supply supports both.
Investment metrics
- 1% rule
- 0.76% ✗
- Cap rate
- 5.65%
- Cash-on-cash
- -2.29%
- DSCR
- 0.90
- GRM
- 11.0
CMA / ARV
- ARV (on-the-fly)
- $129,600
- Comps found
- 7
Show comp detail 7 sales within ~0.75 mi
| Address | Dist | Beds/Ba | Sqft | Sold | Price | $/sf | Match |
|---|---|---|---|---|---|---|---|
| 1155 11th St | 0.12mi | 2/1.0 (-1) | 1,060 (-2%) | 11mo | $114,900 | $108 | 77 |
| 1260 Jefferson St | 0.16mi | 3/1.0 | 1,231 (+14%) | 1mo | $138,000 | $112 | 69 |
| 1630 Lincoln Ave | 0.31mi | 3/1.5 | 1,088 (+1%) | 21mo | $147,000 | $135 | 65 |
| 1465 13th St | 0.13mi | 3/1.0 | 939 (-13%) | 9mo | $135,000 | $144 | 65 |
| 1430 8th St | 0.20mi | 2/1.0 (-1) | 1,140 (+6%) | 19mo | $117,000 | $103 | 60 |
| 1580 Monroe St | 0.26mi | 2/1.0 (-1) | 1,000 (-7%) | 23mo | $120,000 | $120 | 51 |
| 1620 Monroe St | 0.29mi | 3/2.5 | 1,216 (+13%) | 21mo | $215,000 | $177 | 42 |
Match score weights: distance 35% · size 25% · config 20% · recency 20%. Top-matched comps best support the ARV.
Projected returns pro-forma
4.43% appreciation · 3.0% rent growth · sell at horizon
- IRR
- 9.4%
- Equity multiple
- 1.59×
- Total profit
- $22,163
- Equity at exit
- $71,889
- IRR
- 11.2%
- Equity multiple
- 2.94×
- Total profit
- $73,154
- Equity at exit
- $120,413
Cash invested: $37,800 (down + closing). Projections, not guarantees.
Landlord ↔ Tenant lean methodology
- Overall (STATE)
- 73 Landlord-Friendly
- State Wisconsin
- 73 Landlord-Friendly · R+2
- County
- — inherits STATE
- City
- — inherits STATE
ZIP-level market 53809
- Home prices YoY
- 2.2%
- Active inventory
- 9
- Price-to-rent
- 11.0×
Monthly cashflow live
- Estimated rent
- $1,019 medium interval (Pro) →
- Mortgage (P&I)
- −$708
- Tax from tax record
- −$113 /mo · $1,360/yr
- Insurance
- −$56
- HOA
- −$0
- Vacancy / Maint / Mgmt
- −$214
- Net cashflow
- $-72
Break-even live
Sensitivity live
| Price | -10% $4 | -5% $-34 | +0% $-72 | +5% $-110 | +10% $-149 |
|---|---|---|---|---|---|
| Rent | -10% $-153 | -5% $-112 | +0% $-72 | +5% $-32 | +10% $8 |
| Rate | -1.0pp $-4 | -0.5pp $-38 | base $-72 | +0.5pp $-107 | +1.0pp $-143 |
UW: 25.0% down · 7.5% · 30yr · 1.5% tax · 5.0% vac · 8.0% maint · 8.0% mgmt
Financing live
Cash to close
- Down payment
- $33,750
- Closing costs
- $4,050
- Reserves months
- —
- Total cash needed
- —
Loan-product check · same deal, 3 products live
Conventional
25% down · 7.5% · 30yr
- Down + closing
- —
- Monthly P&I
- —
- Monthly cashflow
- —
- DSCR
- —
- Eligible?
- —
Personal DTI + credit; lowest rate.
DSCR
20% down · 8.5% · 30yr
- Down + closing
- —
- Monthly P&I
- —
- Monthly cashflow
- —
- DSCR
- —
- Eligible?
- —
No personal income docs; deal must DSCR.
Hard money
10% down · 12.0% · 12mo
- Down + closing
- —
- Monthly P&I
- —
- Monthly cashflow
- —
- DSCR
- —
- Eligible?
- —
Short-term bridge; refi at stabilization.
Listing history 2 events
-
2026-05-31remarks 519-char remark
-
2026-05-31$135,000 Pending 1 DOM
ⓘ Source: listings_history table (triggers on properties + properties_extension) + one-shot
backfill from property_details.listing_events for pre-trigger history.
Tax reassessment forecast WI · Partial reset (capped growth)
- Current annual tax
- $1,360 · $113/mo
- Projected year-2 tax
- $1,929 · $161/mo
- Expected delta
- +$569/yr (+$47/mo · 41.8%)
ⓘ Screening estimate from a state-policy table — verify with the county assessor before closing.
Climate risk First Street
- Flood 1/10 Low FEMA zone X (unshaded) · 0% chance over 30 yrs
- Wildfire 1/10 Low
- Heat 2/10 Low 7 d/yr ≥99°F today · 15 d/yr by 30 yrs out
- Wind 2/10 Low
- Air quality 1/10 Low 0 unhealthy d/yr today · 0 by 30 yrs out
Nearby sold comps map
Loading sold comps map…
Walkable amenities ~0.75 mi
Loading nearby amenities…
Taxation est. · year 1
- Rental income
- $12,233
- − Mortgage interest
- −$7,562
- − Property taxes
- −$1,360
- − Insurance
- −$675
- − Repairs & maintenance
- −$979
- − Management
- −$979
- − Depreciation
- −$3,927
- Taxable loss
- −$3,248
- Est. tax savings @ 24.0%
- +$780
- After-tax cash flow
- $-86/yr
For passive investors: Depreciation is non-cash, so a rental often shows a tax loss while cash-flowing — sheltering income. Rental losses are passive: they offset passive income freely, and up to $25,000/yr can offset ordinary (W-2) income if you actively participate and your MAGI is under $100k (phasing out to $0 by $150k); unused losses carry forward. On sale, claimed depreciation is recaptured at up to 25%, and gains may owe capital-gains tax (a 1031 exchange can defer both). Figures are a year-1 estimate at your 24.0% rate — not tax advice; consult a CPA.
Schools (NCES district)
- District
- Fennimore Community School District
- NCES district ID
- 5504590
- Math proficiency
- 41% ▼ -11.00%
- Reading proficiency
- 42% ▼ -14.00%
- Median HH income
- $48,898
- Composite
- 35.64/100
- National rank
- #4883
- State rank
- #139 of 342 in WI
Livability — Fennimore
- Score
- 80/100
- State rank
- #61
- US rank
- #1676
Category grades
Schools grade is shown separately in the Schools card above.
Census & demographics
- Census place
- Fennimore, WI
- Population (ZIP)
- 4,701
Population outlook (Grant County) Hauer SSP2
- Today (2025)
- 53,982 people
- By 2030
- 55,104 · +2.1%
- By 2040
- 57,353 · +6.2%
- By 2050
- 59,315 · +9.9%
- By 2075
- 65,496 · +21.3%
- By 2100
- 66,508 · +23.2%
Race, ethnicity, and origin ACS 2023
- Neighborhood character
- Predominantly White (98%)
- Race & ethnicity
- White 98% Two or more races 2%
- Common ancestry
- Portuguese 9% Polish 3% Romanian 2%
- Foreign-born
- 1% · Canada
- Languages at home
- 94% English-only · German/W. Germanic 5% Spanish 1%
Political lean MEDSL · Grant
- 2024 margin
- R (+18.2) · D 40.2% · R 58.4% · Other 1.3%
- 2008→2024 swing
- -42.0pp toward R · 2008: 23.9pp · 2024: -18.2pp
- All cycles
- 2024: R+18.2 2020: R+12.3 2016: R+9.6 2012: D+13.7 2008: D+23.9
Not yet ingested
- Civics
- —
Market trends
- HPI YoY
- ▲ 4.43%
- Current HPI
- 204.5404
- Rent YoY
- —
- Metro
- —
- State GDP YoY
- ▲ 2.10%
- F500 in state
- 20
Industry mix (Fortune 500 HQ in WI)
| Industry | F500 HQs | Revenue |
|---|---|---|
| Industrial Machinery | 4 | $23B |
|
||
| Industrial Technology | 2 | $36B |
|
||
| Insurance | 1 | $36B |
|
||
| Professional Services | 1 | $19B |
|
||
| Utilities | 1 | $9B |
|
||
| Consumer Goods | 1 | $3B |
|
||
Price history
2 events — show timeline
- 2026-05-31 Pending — SCWMLS
- 2026-05-29 Listed $135,000 SCWMLS
Property tax history
+1.4%/yrLatest (2025): $1,360 · -1.6% YoY. Source: county tax records.
Cash-flow waterfall
monthlySold comps — $/sqft
last 12 mo · ≤1 miLoading sold comps…