None · Swansboro, NC
Flood risk 4/10 · Minor
- FEMA flood zone
- X (unshaded)
- Chance of flooding over 30 yrs
- 0.2%
- Est. flood insurance / yr
- $507 – $1,088
Fire risk 6/10 · Moderate
- Est. fire insurance / yr
- $906 – $1,684
Heat risk 9/10 · Severe
- Hot days now (above 105°F)
- 7 days/yr
- Hot days in 30 yrs
- 20 days/yr
Wind risk 8/10 · Major
- Chance of severe wind over 30 yrs
- 99.0%
Air-quality risk 2/10 · Minimal
- Unhealthy air days now
- 0 days/yr
- Unhealthy air days in 30 yrs
- 2 days/yr
Risk factors via First Street. Map © Google.
Why this score? — see what drove the C grade
The composite is a weighted blend of 9 inputs, each scored 0–100. Each bar is that input's sub-score; the figure is the points it added to the 100-point composite (weight × sub-score).
- Cash flow +18.3/30.0
- ARV discount +14.8/15.0
- DSCR +5.8/10.0
- Schools +3.9/10.0
- Livability +3.9/5.0
- 1% rule +3.7/10.0
- Rent growth +3.2/5.0
- Condition / age +2.5/5.0
- Appreciation +0.0/10.0
$192,250
🖨 Deal sheet 📄 Offer letter ✓ Due diligence
Listing remarks
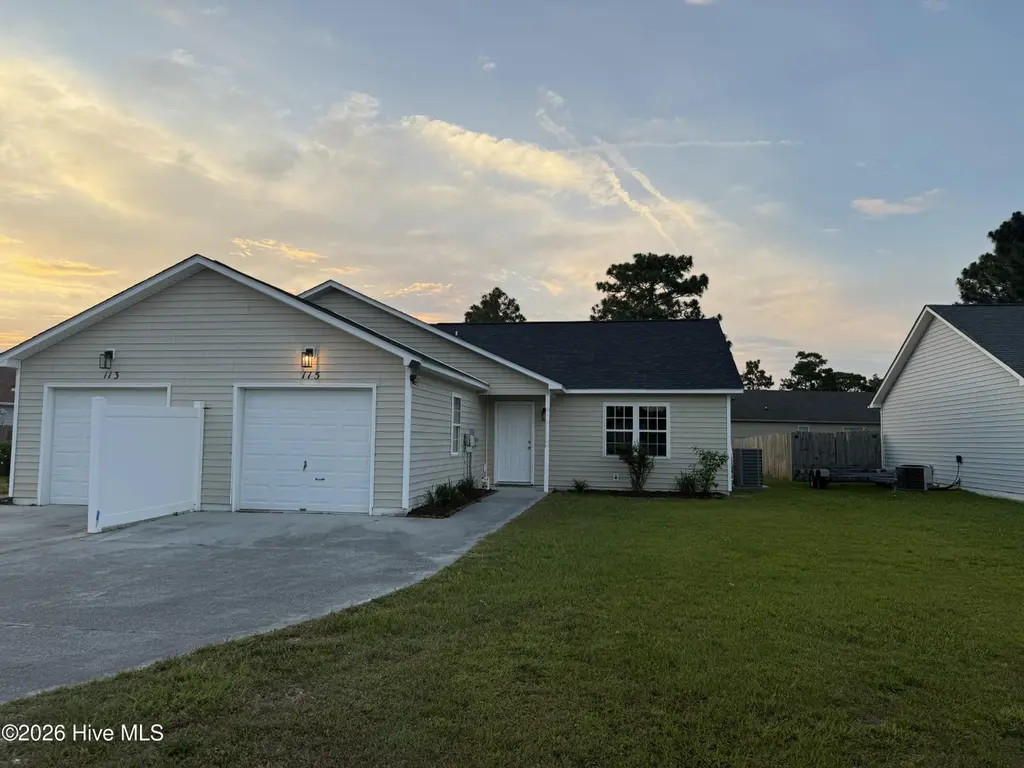
Welcome home to this beautifully maintained 2-bedroom, 2-bathroom duplex perfectly situated just minutes from the gates of Camp Lejeune and a short drive from the stunning beaches of Emerald Isle. Inside, you will find a bright, open-concept layout featuring new paint and appliances, a modern kitchen with granite countertops that flows effortlessly into a spacious living area, alongside a private primary suite with its own en-suite bathroom. Ideal for first-time buyers, downsizers, or investors seeking a low-maintenance property, this move-in-ready gem combines coastal convenience with everyday comfort. Schedule your private tour today, as this incredible opportunity will not last long! Inv
Key facts
- En-suite bathroom
- Modern kitchen
- Granite countertops
Tags
Property features AI
Finance
- Other: Zoning: R-10; Lot dimensions approximately 42 x 134 (0.13 acres); Paved road access; Subdivision: Foxtrace Point
Exterior
- Parking: 2 total parking spaces; Attached front-facing 2-car garage on paved driveway
- Security: Smoke detector(s)
- Utilities: Public water; Water available
- Home design: Duplex; Single-story, entry level 1; Single Family Residence
- Construction: Built with vinyl siding and frame construction; Slab foundation
- Exterior features: Patio; Back yard fencing; Shingle roof; Has a view
Interior
- Kitchen: Electric oven; Electric cooktop; Refrigerator; Dishwasher; Microwave
- Bedrooms: Total of 6 rooms (includes bedrooms and living spaces)
- Bathrooms: 2 full bathrooms
- Interior features: Unfurnished; Smoke detector(s); No basement
- Laundry & utility: Washer hookup; Electric water heater
Heating & cooling
- Heating & cooling: Electric heating; Heat pump; Central air; Ceiling fan(s)
Neighborhood map
What this means for you Summary
Snapshot
- This is a 2-bed/2.0-bath single-family listed at $192k.
Deal economics
- At list price, monthly cash flow is $177 ($2k/yr) — positive.
- The deal already cash-flows at list — no discount required.
- To meet the 1% rule (rent ≥ 1% of price), the offer needs to be $168k (12.9% below list).
- Recommended offer: $168k (12.9% below list) — sets the bar for 1% rule.
- Cap rate 7.4% vs local median 3.5% in Swansboro — top-decile yield for the area; either an underpriced asset or a hidden risk that comps aren't pricing in. Stress-test before assuming the spread holds.
Location & tenants
- Location reads 77/100 on livability (#32 in NC, #3,124 nationally) — a middle-class / working-renter tenant base. Strengths: housing A+, health & safety A+, crime A; Watch: amenities F, commute F.
- Onslow County Schools (other): math 42% / reading 49% proficiency, ranked #84 of 178 in NC (top 47%) — families likely to look elsewhere, expect single-tenant / working-renter base with shorter leases.
- Zoned schools: Sand Ridge Elementary (math 57% / reading 54%, grade C, #293 of 1,410 statewide, top 21%, 581 students, 58% FRL); Swansboro Middle (math 52% / reading 55%, grade C+, #87 of 475 statewide, top 19%, 967 students, 43% FRL); Swansboro High (math 77% / reading 68%, grade B+, #104 of 535 statewide, top 19%, 1,115 students, 38% FRL).
- Zoned-school proficiency averages 60% at this address vs 46% district-wide (+15 pts) — the actual schools serving this property are materially stronger than the Onslow County Schools average implies; a family-tenant draw the district grade alone would hide.
- Market conditions: Rents rising (+2.6%/yr); 322 active listings in the ZIP; 5 comparable units currently listed for rent nearby; rentals at typical pace (median 21d on market — plan ~3-4 weeks tenant-placement turnaround); 1,246 units permitted in Onslow County in 2024 (0 in 5+ unit buildings).
- This rent runs 30% of the median local income ($67k/yr) — at the standard rent-burdened threshold; future hikes will face affordability resistance.
Forward outlook
- Local home prices are declining (-3.0%/yr); year-one equity from $1k of loan paydown is wiped out by about $6k of value loss. Plan a longer hold.
Negotiation context
- Only 6 days on market — expect competitive offers; lowballing is unlikely to land.
- 6 sale attempts since 22y ago with the ask held roughly flat each time — persistent listings suggest the price (not the market) is what's stuck; bring a comps-based counter.
Risks & watch-outs
- Climate carrying-cost: severe wind risk, 99% chance of damaging wind over 30y; major wildfire risk; extreme-heat days projected 7→20/yr by 2055 (HVAC capex compounding) — expect insurance premiums to compound above CPI over the hold.
Questions for the listing agent
- Is there a deadline driving the sale (1031 exchange, divorce, estate, relocation)? That informs how much negotiation room exists.
- What's the average days-on-market for RENTAL listings here right now (not sales)? A rising rental-DOM trend means longer vacancies and softer asking-rent achievability than the comps imply.
- What's the recent tenant-quality profile in this submarket — average credit score on applications, eviction rate, late-payment / NSF rate, and stable-employment percentage? A property-management company in the area should have these aggregated.
- How much new for-sale + rental construction is in the pipeline within 1–3 miles? Heavy new supply typically softens prices + rents 12–24 months out; constrained supply supports both.
Investment metrics
- 1% rule
- 0.87% ✗
- Cap rate
- 7.40%
- Cash-on-cash
- 3.95%
- DSCR
- 1.18
- GRM
- 9.6
CMA / ARV
- ARV (on-the-fly)
- $229,376
- Comps found
- 12
Show comp detail 12 sales within ~0.75 mi
| Address | Dist | Beds/Ba | Sqft | Sold | Price | $/sf | Match |
|---|---|---|---|---|---|---|---|
| 405 Hooks Ln | 0.35mi | 3/2.0 (+1) | 1,052 (+3%) | 2mo | $236,500 | $225 | 72 |
| 183 Parnell Rd | 0.41mi | 3/2.0 (+1) | 1,040 (+2%) | 2mo | $269,500 | $259 | 72 |
| 412 Foxtrace Ln | 0.24mi | 3/2.0 (+1) | 1,085 (+6%) | 3mo | $238,400 | $220 | 72 |
| 142 Parnell Rd | 0.40mi | 3/2.0 (+1) | 1,050 (+2%) | 2mo | $235,000 | $224 | 71 |
| 81 Crown Point Rd | 0.41mi | 3/1.5 (+1) | 1,000 (-2%) | 4mo | $212,000 | $212 | 67 |
| 104 Crown Point Rd | 0.37mi | 3/2.0 (+1) | 1,089 (+6%) | 2mo | $207,500 | $191 | 66 |
| 166 Glenwood Dr | 0.55mi | 2/1.0 | 1,009 (-2%) | 4mo | $210,000 | $208 | 65 |
| 502 Waldorf Ct | 0.25mi | 3/2.0 (+1) | 1,139 (+11%) | 3mo | $253,000 | $222 | 62 |
| 127 Glenwood Dr | 0.61mi | 3/2.0 (+1) | 1,051 (+3%) | 1mo | $250,000 | $238 | 62 |
| 203 Inman Ct | 0.32mi | 3/2.0 (+1) | 1,138 (+11%) | 3mo | $243,000 | $214 | 59 |
| 105 Marina Leigh Dr | 0.68mi | 3/2.0 (+1) | 1,089 (+6%) | 3mo | $249,000 | $229 | 50 |
| 201 Michel Ct | 0.75mi | 3/2.0 (+1) | 1,103 (+8%) | 0mo | $247,000 | $224 | 47 |
Match score weights: distance 35% · size 25% · config 20% · recency 20%. Top-matched comps best support the ARV.
Projected returns pro-forma
-3.0% appreciation · 2.61% rent growth · sell at horizon
- IRR
- -10.6%
- Equity multiple
- 0.62×
- Total profit
- $-20,606
- Equity at exit
- $28,665
- IRR
- -1.8%
- Equity multiple
- 0.88×
- Total profit
- $-6,427
- Equity at exit
- $16,622
Cash invested: $53,830 (down + closing). Projections, not guarantees.
Landlord ↔ Tenant lean methodology
- Overall (STATE)
- 85 Strongly Landlord-Friendly
- State North Carolina
- 85 Strongly Landlord-Friendly · R+3
- County
- — inherits STATE
- City
- — inherits STATE
ZIP-level market 28539
- Home prices YoY
- -23.9%
- Rents YoY
- 2.6%
- Active inventory
- 322
- Price-to-rent
- 9.6×
Monthly cashflow live
- Estimated rent
- $1,675 high interval (Pro) →
- Mortgage (P&I)
- −$1,008
- Tax from tax record
- −$58 /mo · $693/yr
- Insurance
- −$80
- HOA
- −$0
- Vacancy / Maint / Mgmt
- −$352
- Net cashflow
- $177
Break-even live
UW: 25.0% down · 7.5% · 30yr · 1.5% tax · 5.0% vac · 8.0% maint · 8.0% mgmt
Financing live
Cash to close
- Down payment
- $48,062
- Closing costs
- $5,768
- Reserves months
- —
- Total cash needed
- —
Loan-product check · same deal, 3 products live
Conventional
25% down · 7.5% · 30yr
- Down + closing
- —
- Monthly P&I
- —
- Monthly cashflow
- —
- DSCR
- —
- Eligible?
- —
Personal DTI + credit; lowest rate.
DSCR
20% down · 8.5% · 30yr
- Down + closing
- —
- Monthly P&I
- —
- Monthly cashflow
- —
- DSCR
- —
- Eligible?
- —
No personal income docs; deal must DSCR.
Hard money
10% down · 12.0% · 12mo
- Down + closing
- —
- Monthly P&I
- —
- Monthly cashflow
- —
- DSCR
- —
- Eligible?
- —
Short-term bridge; refi at stabilization.
Rent comps 5 comps
| Address | Beds | Baths | Sqft | Rent | $/sqft | DOM | Units | Dist |
|---|---|---|---|---|---|---|---|---|
| 400 Dayrell Dr Hubert, NC | 3.0 | 2.0 | 1267 | $1,800 | $1.42 | 20d | 1 | 0.22mi |
| 212 W Volant St Hubert, NC | 3.0 | 2.0 | 1223 | $1,750 | $1.43 | 20d | 1 | 0.33mi |
| 136 Byrum Run Hubert, NC | 3.0 | 2.0 | 1164 | $1,800 | $1.55 | 20d | 1 | 1.32mi |
| 104 Parrot Landing Dr Hubert, NC | 2.0 | 2.5 | 1300 | $1,650 | $1.27 | 20d | 1 | 1.35mi |
| 104 Parrot Landing Dr Unit 104 Hubert, NC | 2.0 | 2.5 | 1300 | $1,650 | $1.27 | 20d | 1 | 1.35mi |
Listing history 7 events
-
2026-06-19days on market $192,250 Active 6 DOM
-
2026-06-18days on market $192,250 Active 5 DOM
-
2026-06-17days on market $192,250 Active 4 DOM
-
2026-06-16days on market $192,250 Active 3 DOM
-
2026-06-15days on market $192,250 Active 2 DOM
-
2026-06-14remarks 699-char remark
-
2026-06-14$192,250 Active 1 DOM
ⓘ Source: listings_history table (triggers on properties + properties_extension) + one-shot
backfill from property_details.listing_events for pre-trigger history.
Tax reassessment forecast NC · Resets to sale price
- Current annual tax
- $693 · $58/mo
- Projected year-2 tax
- $1,576 · $131/mo
- Expected delta
- +$883/yr (+$74/mo · 127.4%)
ⓘ Screening estimate from a state-policy table — verify with the county assessor before closing.
Climate risk First Street
- Flood 4/10 Moderate FEMA zone X (unshaded) · 20% chance over 30 yrs
- Wildfire 6/10 Major
- Heat 9/10 Extreme 7 d/yr ≥105°F today · 20 d/yr by 30 yrs out
- Wind 8/10 Severe 99% chance of damaging wind over 30 yrs
- Air quality 2/10 Low 0 unhealthy d/yr today · 2 by 30 yrs out
Nearby sold comps map
Loading sold comps map…
Walkable amenities ~0.75 mi
Loading nearby amenities…
Taxation est. · year 1
- Rental income
- $20,101
- − Mortgage interest
- −$10,769
- − Property taxes
- −$693
- − Insurance
- −$961
- − Repairs & maintenance
- −$1,608
- − Management
- −$1,608
- − Depreciation
- −$5,593
- Taxable loss
- −$1,132
- Est. tax savings @ 24.0%
- +$272
- After-tax cash flow
- $2,398/yr
For passive investors: Depreciation is non-cash, so a rental often shows a tax loss while cash-flowing — sheltering income. Rental losses are passive: they offset passive income freely, and up to $25,000/yr can offset ordinary (W-2) income if you actively participate and your MAGI is under $100k (phasing out to $0 by $150k); unused losses carry forward. On sale, claimed depreciation is recaptured at up to 25%, and gains may owe capital-gains tax (a 1031 exchange can defer both). Figures are a year-1 estimate at your 24.0% rate — not tax advice; consult a CPA.
Schools (NCES district)
- District
- Onslow County Schools
- NCES district ID
- 3703450
- Math proficiency
- 42% ▲ 6.00%
- Reading proficiency
- 49% ▲ 5.00%
- Median HH income
- $46,076
- Composite
- 38.66/100
- National rank
- #4148
- State rank
- #84 of 178 in NC
Livability — Swansboro
- Score
- 77/100
- State rank
- #32
- US rank
- #3124
Category grades
Schools grade is shown separately in the Schools card above.
Census & demographics
- County
- Onslow County · 164,453 people
- Metro
- Jacksonville, NC
- Population (ZIP)
- 18,351
- Household income
- $66,976
- Rent vs Own
- Severe rent burden
- 602.0
Population outlook (Onslow County) Hauer SSP2
- Today (2025)
- 189,789 people
- By 2030
- 194,463 · +2.5%
- By 2040
- 193,629 · +2.0%
- By 2050
- 193,248 · +1.8%
- By 2075
- 196,995 · +3.8%
- By 2100
- 201,513 · +6.2%
Race, ethnicity, and origin ACS 2023
- Neighborhood character
- Predominantly White (82%)
- Race & ethnicity
- White 82% Two or more races 7% Hispanic / Latino 6% Black 6% Asian 1%
- Hispanic origin (detail)
- Mexican 3% Puerto Rican 2%
- Common ancestry
- Slovak 3% Romanian 3% Lithuanian 2%
- Foreign-born
- 3% · Canada
- Languages at home
- 93% English-only · Spanish 3% Other Asian/Pacific 1% Other Indo-European 1%
Political lean MEDSL · Onslow
- 2024 margin
- Solid R (+35.9) · D 31.5% · R 67.5% · Other 1.0%
- 2008→2024 swing
- -14.5pp toward R · 2008: -21.5pp · 2024: -35.9pp
- All cycles
- 2024: R+35.9 2020: R+30.2 2016: R+34.6 2012: R+27.0 2008: R+21.5
Not yet ingested
- Civics
- —
Market trends
- HPI YoY
- ▼ -58.68%
- Current HPI
- 186.871
- Rent YoY
- ▲ 2.61%
- Metro
- Jacksonville, NC
- State GDP YoY
- ▲ 3.28%
- F500 in state
- 26
Industry mix (Fortune 500 HQ in NC)
| Industry | F500 HQs | Revenue |
|---|---|---|
| Financial Services | 2 | $213B |
|
||
| Retail | 2 | $95B |
|
||
| Industrial Conglomerate | 1 | $38B |
|
||
| Metals / Steel | 1 | $35B |
|
||
| Utilities | 1 | $30B |
|
||
| Industrial Machinery | 1 | $19B |
|
||
Price history
+174.6% since first listed15 events — show timeline
- 2026-06-13 Listed $192,250 Hive MLS
- 2026-04-17 Sold (Public Records) $251,167 Public Records
- 2021-05-12 Sold (Public Records) $209,000 Public Records
- 2017-02-08 Listing Removed — Hive MLS
- 2016-12-19 Listed $78,000 Hive MLS
- 2016-08-24 Listing Removed — Hive MLS
- 2016-04-14 Listed $90,000 Hive MLS
- 2008-08-01 Sold (Public Records) $90,000 Public Records
- 2007-02-01 Sold (Public Records) $85,000 Public Records
- 2004-11-13 Listing Removed — Hive MLS
- 2004-11-13 Listing Removed — Hive MLS
- 2004-11-13 Listing Removed — Hive MLS
- 2004-03-13 Listed $70,000 Hive MLS
- 2004-03-13 Listed $70,000 Hive MLS
- 2004-03-13 Listed $70,000 Hive MLS
Property tax history
+1.2%/yrLatest (2025): $693 · +0.0% YoY. Source: county tax records.
Cash-flow waterfall
monthlySold comps — $/sqft
last 12 mo · ≤1 miLoading sold comps…