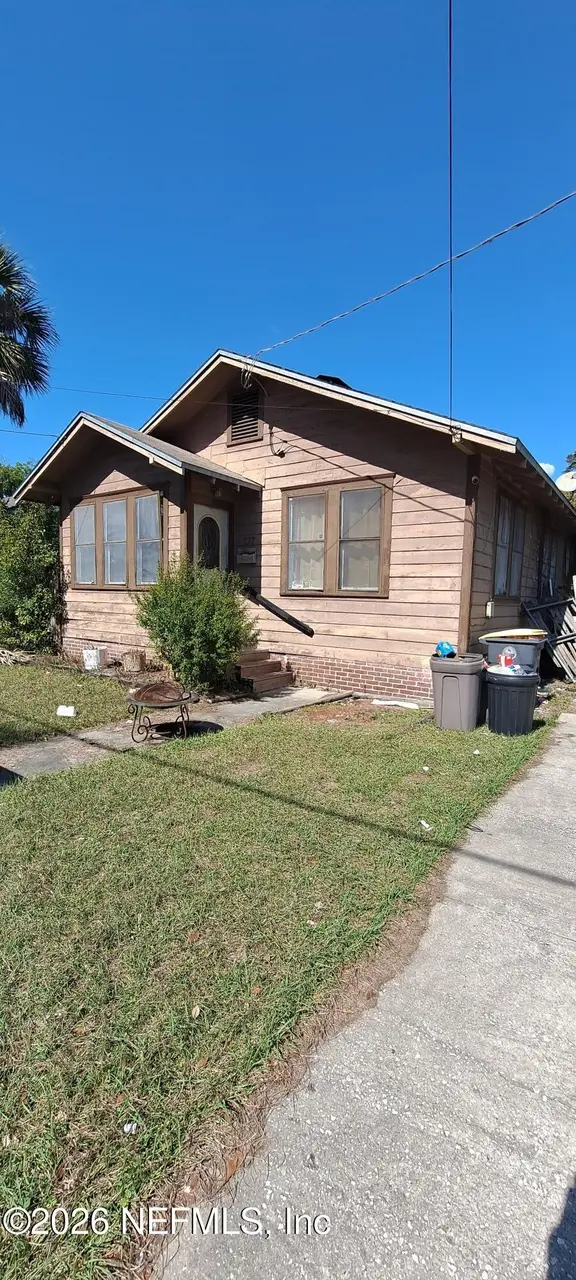
237 Tallulah Ave · Jacksonville, FL
Flood risk 1/10 · Minimal
- FEMA flood zone
- X (unshaded)
- Chance of flooding over 30 yrs
- 0.0%
- Est. flood insurance / yr
- $507 – $1,088
Fire risk 1/10 · Minimal
- Est. fire insurance / yr
- $947 – $1,759
Heat risk 9/10 · Severe
- Hot days now (above 107°F)
- 7 days/yr
- Hot days in 30 yrs
- 20 days/yr
Wind risk 9/10 · Severe
- Chance of severe wind over 30 yrs
- 99.0%
Air-quality risk 4/10 · Minor
- Unhealthy air days now
- 6 days/yr
- Unhealthy air days in 30 yrs
- 6 days/yr
Risk factors via First Street. Map © Google.
Why this score? — see what drove the B+ grade
The composite is a weighted blend of 9 inputs, each scored 0–100. Each bar is that input's sub-score; the figure is the points it added to the 100-point composite (weight × sub-score).
- Cash flow +30.0/30.0
- ARV discount +15.0/15.0
- 1% rule +10.0/10.0
- DSCR +10.0/10.0
- Livability +4.2/5.0
- Schools +3.9/10.0
- Condition / age +2.5/5.0
- Rent growth +2.2/5.0
- Appreciation +0.0/10.0
$79,990
🖨 Deal sheet 📄 Offer letter ✓ Due diligence
Listing remarks MLS
Unapproved short sale. Investment opportunity!! This house has lots of potential! Quaint 2/1 in Jacksonville in need of some serious TLC.
Key facts
- 6,534 sq ft lot
- Built 1932
- Listed 45 days
Property features AI
Finance
- Financial info: Property tax information available (taxes listed in source — financial details omitted per instructions)
- HOA & community: Not a senior community
Exterior
- Parking: Other parking
- Utilities: Electricity connected; Water connected
- Home design: Single Family Residence; Used as a single-family home
- Exterior features: 0.15-acre lot
Interior
- Kitchen: No kitchen appliances specified
- Bedrooms: 2 bedrooms
- Bathrooms: 1 full bathroom
- Heating & cooling: Central heating (electric); Central air conditioning
- Interior features: No built-in appliances listed
- Laundry & utility: No laundry appliances specified
Neighborhood map
What this means for you Summary
Snapshot
- This is a 2-bed/1.0-bath single-family listed at $80k.
Deal economics
- At list price, monthly cash flow is $417 ($5k/yr) — positive.
- The deal already cash-flows at list — no discount required.
- Meets the 1% rule at list price ($1k rent vs $80k).
- Recommended offer: $78k (3.0% below list) — sets the bar for market timing.
- Cap rate 12.5% vs local median 4.0% in Jacksonville — top-decile yield for the area; either an underpriced asset or a hidden risk that comps aren't pricing in. Stress-test before assuming the spread holds.
Location & tenants
- Location reads 83/100 on livability (#50 in FL, #911 nationally) — a professional / high-income tenant draw. Strengths: amenities A+, commute A+, housing A+.
- Duval (urban): math 46% / reading 45% proficiency, ranked #48 of 73 in FL (top 66%) — families likely to look elsewhere, expect single-tenant / working-renter base with shorter leases.
- Market conditions: Rents soft (-1.4%/yr); 291 active listings in the ZIP; 40 comparable units currently listed for rent nearby; rentals at typical pace (median 15d on market — plan ~3-4 weeks tenant-placement turnaround); lower-income renter base — watch delinquency; 6,503 units permitted in Duval County in 2024 (1,131 in 5+ unit buildings).
- This rent runs 37% of the median local income ($41k/yr) — at the standard rent-burdened threshold; future hikes will face affordability resistance.
Forward outlook
- Local home prices are declining (-3.0%/yr); year-one equity from $554 of loan paydown is wiped out by about $2k of value loss. Plan a longer hold.
- Duval County population projected at +19% by 2050 — long-run rental-demand tailwind backs the buy-and-hold thesis.
- At projected returns (-3.0% appreciation + 0.0% rent growth), your $22k cash investment doubles in ~7 years — after that, you're playing with house money.
Negotiation context
- It's been on market 45 days — a 3% lower offer ($78k) is reasonable based on typical stale-listing flexibility.
- 4 sale attempts since 20y ago with the ask held roughly flat each time — persistent listings suggest the price (not the market) is what's stuck; bring a comps-based counter.
- Current owner paid $39k; list at $80k implies a 105% gain — meaningful room to come down on a strong offer.
Risks & watch-outs
- Watch-outs: built in 1932 — expect roof / HVAC / electrical / plumbing capex.
- Climate carrying-cost: severe wind risk, 99% chance of damaging wind over 30y; extreme-heat days projected 7→20/yr by 2055 (HVAC capex compounding) — expect insurance premiums to compound above CPI over the hold.
Questions for the listing agent
- It's been on market 45 days. Have you received any prior offers? Is the seller open to a 3% concession, seller financing, or rate buy-down credit?
- Built in 1932 — when were the roof, HVAC, electrical panel, plumbing, and water heater last replaced?
- Is there a deadline driving the sale (1031 exchange, divorce, estate, relocation)? That informs how much negotiation room exists.
- Schools are B-rated — typically a magnet for longer-tenancy family renters. What's the average tenant stay here, and is there a school-zone premium baked into asking?
- What's the average days-on-market for RENTAL listings here right now (not sales)? A rising rental-DOM trend means longer vacancies and softer asking-rent achievability than the comps imply.
- What's the recent tenant-quality profile in this submarket — average credit score on applications, eviction rate, late-payment / NSF rate, and stable-employment percentage? A property-management company in the area should have these aggregated.
- How much new for-sale + rental construction is in the pipeline within 1–3 miles? Heavy new supply typically softens prices + rents 12–24 months out; constrained supply supports both.
Investment metrics
- 1% rule
- 1.61% ✓
- Cap rate
- 12.55%
- Cash-on-cash
- 22.34%
- DSCR
- 1.99
- GRM
- 5.2
CMA / ARV
- ARV (on-the-fly)
- $111,210
- Comps found
- 12
Show comp detail 12 sales within ~0.75 mi
| Address | Dist | Beds/Ba | Sqft | Sold | Price | $/sf | Match |
|---|---|---|---|---|---|---|---|
| 50 W 58th St | 0.32mi | 2/1.0 | 1,004 (-1%) | 1mo | $71,000 | $71 | 83 |
| 110 Tallulah Ave | 0.20mi | 3/1.0 (+1) | 1,102 (+9%) | 2mo | $181,000 | $164 | 69 |
| 448 W 68th St | 0.38mi | 2/1.0 | 1,074 (+6%) | 4mo | $141,000 | $131 | 68 |
| 8024 Hawthorne St | 0.57mi | 2/1.0 | 1,042 (+3%) | 2mo | $115,000 | $110 | 66 |
| 6711 Drayton St | 0.31mi | 3/1.0 (+1) | 1,088 (+8%) | 3mo | $138,000 | $127 | 65 |
| 429 W 46th St | 0.71mi | 2/1.0 | 1,020 (+1%) | 2mo | $167,000 | $164 | 64 |
| 6835 Vermillion St | 0.25mi | 3/1.0 (+1) | 891 (-12%) | 2mo | $65,000 | $73 | 62 |
| 182 W 61st St | 0.12mi | 2/3.0 | 1,161 (+15%) | 3mo | $125,770 | $108 | 59 |
| 473 W 65th St | 0.34mi | 3/1.0 (+1) | 884 (-13%) | 0mo | $95,000 | $107 | 58 |
| 557 Chestnut Dr | 0.66mi | 2/1.0 | 943 (-7%) | 4mo | $125,000 | $133 | 55 |
| 569 W 49th St | 0.71mi | 2/1.0 | 924 (-9%) | 2mo | $57,000 | $62 | 51 |
| 465 W 60th St | 0.35mi | 2/3.5 | 1,157 (+14%) | 3mo | $89,000 | $77 | 47 |
Match score weights: distance 35% · size 25% · config 20% · recency 20%. Top-matched comps best support the ARV.
Projected returns pro-forma
-3.0% appreciation · 0.0% rent growth · sell at horizon
- IRR
- 11.6%
- Equity multiple
- 1.44×
- Total profit
- $9,871
- Equity at exit
- $11,927
- IRR
- 17.9%
- Equity multiple
- 2.27×
- Total profit
- $28,424
- Equity at exit
- $6,916
Cash invested: $22,397 (down + closing). Projections, not guarantees.
Landlord ↔ Tenant lean methodology
- Overall (STATE)
- 87 Strongly Landlord-Friendly
- State Florida
- 87 Strongly Landlord-Friendly · R+3
- County
- — inherits STATE
- City
- — inherits STATE
ZIP-level market 32208
- Home prices YoY
- -33.6%
- Rents YoY
- -1.4%
- Active inventory
- 291
- Price-to-rent
- 5.2×
Monthly cashflow live
- Estimated rent
- $1,285 high interval (Pro) →
- Mortgage (P&I)
- −$419
- Tax from tax record
- −$146 /mo · $1,746/yr
- Insurance
- −$33
- HOA
- −$0
- Vacancy / Maint / Mgmt
- −$270
- Net cashflow
- $417
Break-even live
UW: 25.0% down · 7.5% · 30yr · 1.5% tax · 5.0% vac · 8.0% maint · 8.0% mgmt
Financing live
Cash to close
- Down payment
- $19,998
- Closing costs
- $2,400
- Reserves months
- —
- Total cash needed
- —
Loan-product check · same deal, 3 products live
Conventional
25% down · 7.5% · 30yr
- Down + closing
- —
- Monthly P&I
- —
- Monthly cashflow
- —
- DSCR
- —
- Eligible?
- —
Personal DTI + credit; lowest rate.
DSCR
20% down · 8.5% · 30yr
- Down + closing
- —
- Monthly P&I
- —
- Monthly cashflow
- —
- DSCR
- —
- Eligible?
- —
No personal income docs; deal must DSCR.
Hard money
10% down · 12.0% · 12mo
- Down + closing
- —
- Monthly P&I
- —
- Monthly cashflow
- —
- DSCR
- —
- Eligible?
- —
Short-term bridge; refi at stabilization.
Rent comps 40 comps
| Address | Beds | Baths | Sqft | Rent | $/sqft | DOM | Units | Dist |
|---|---|---|---|---|---|---|---|---|
| 209 Woodrow St Jacksonville, FL | 3.0 | 1.0 | 1282 | $1,325 | $1.03 | 23d | 1 | 0.14mi |
| 7115 Lucky Dr W Jacksonville, FL | 3.0 | 1.0 | 1158 | $1,500 | $1.30 | 23d | 1 | 0.17mi |
| 343 W 60th St Jacksonville, FL | 3.0 | 1.0 | 1238 | $1,299 | $1.05 | 21d | 1 | 0.21mi |
| 346 W 68th St Jacksonville, FL | 3.0 | 1.0 | 1114 | $1,385 | $1.24 | 4d | 1 | 0.31mi |
| 41 Tallulah Ave Jacksonville, FL | 3.0 | 1.0 | 1092 | $1,390 | $1.27 | 3d | 1 | 0.34mi |
| 472 W 65th St Jacksonville, FL | 3.0 | 1.0 | 1312 | $1,295 | $0.99 | 21d | 1 | 0.34mi |
| 7124 Lorain St Jacksonville, FL | 3.0 | 1.0 | 864 | $1,043 | $1.21 | 3d | 1 | 0.38mi |
| 6418 Sapphire Dr Jacksonville, FL | 3.0 | 1.5 | 1296 | $1,350 | $1.04 | 23d | 1 | 0.39mi |
| 356 Duray Ct Jacksonville, FL | 3.0 | 2.0 | 1070 | $1,425 | $1.33 | 14d | 1 | 0.40mi |
| 6701 N Main St Jacksonville, FL | 1.0 | 1.0 | 700 | $950 | $1.36 | 23d | 1 | 0.42mi |
| 385 Duray Ct Jacksonville, FL | 3.0 | 1.0 | 932 | $1,250 | $1.34 | 19d | 1 | 0.43mi |
| 7511 N Shore Dr Jacksonville, FL | 2.0 | 1.0 | 1014 | $1,350 | $1.33 | 4d | 1 | 0.43mi |
| 7345 Penrose St Jacksonville, FL | 1.0 | 1.0 | 1006 | $685 | $0.68 | 16d | 1 | 0.45mi |
| 535 W 59th St Jacksonville, FL | 3.0 | 2.0 | 816 | $1,395 | $1.71 | 7d | 1 | 0.48mi |
| 7525 Oakwood St Jacksonville, FL | 3.0 | 1.0 | 945 | $1,375 | $1.46 | 14d | 1 | 0.52mi |
| 7210 Elwood Ave Jacksonville, FL | 2.0 | 1.0 | 831 | $995 | $1.20 | 21d | 1 | 0.52mi |
| 6460 Lanark Ave Jacksonville, FL | 2.0 | 1.0 | 708 | $1,095 | $1.55 | 23d | 1 | 0.57mi |
| 7545 Wilder Ave Jacksonville, FL | 3.0 | 1.0 | 1300 | $1,150 | $0.88 | 3d | 1 | 0.58mi |
| 319 W 49th St Jacksonville, FL | 2.0 | 1.0 | 977 | $1,200 | $1.23 | 23d | 1 | 0.60mi |
| 525 E 60th St Jacksonville, FL | 3.0 | 2.0 | 1120 | $1,471 | $1.31 | 23d | 1 | 0.65mi |
| 524 E 60th St Jacksonville, FL | 3.0 | 1.0 | 1212 | $1,195 | $0.99 | 7d | 1 | 0.65mi |
| 425 W 47th St Jacksonville, FL | 3.0 | 1.5 | 1083 | $1,193 | $1.10 | 7d | 1 | 0.68mi |
| 562 W 49th St Jacksonville, FL | 3.0 | 1.0 | 1091 | $1,195 | $1.10 | 23d | 1 | 0.74mi |
| 646 Escambia St Jacksonville, FL | 3.0 | 2.0 | 1200 | $1,395 | $1.16 | 21d | 1 | 0.75mi |
| 549 E 55th St Jacksonville, FL | 3.0 | 2.0 | 1230 | $1,488 | $1.21 | 10d | 1 | 0.76mi |
| 217 E 48th St Jacksonville, FL | 3.0 | 1.0 | 979 | $1,096 | $1.12 | 10d | 1 | 0.76mi |
| 555 E 55th St Jacksonville, FL | 3.0 | 2.0 | 1230 | $1,488 | $1.21 | 10d | 1 | 0.77mi |
| 664 Escambia St Jacksonville, FL | 3.0 | 2.0 | 1352 | $1,500 | $1.11 | 17d | 1 | 0.77mi |
| 567 E 55th St Jacksonville, FL | 3.0 | 2.0 | 1230 | $1,488 | $1.21 | 14d | 1 | 0.78mi |
| 8027 Floyd St Jacksonville, FL | 2.0 | 1.5 | 935 | $1,300 | $1.39 | 2d | 1 | 0.79mi |
| 5616 Calvin Ave Jacksonville, FL | 3.0 | 1.0 | 1008 | $1,195 | $1.19 | 7d | 1 | 0.82mi |
| 7140 Buffalo Ave Jacksonville, FL | 2.0 | 1.0 | 832 | $1,321 | $1.59 | 23d | 1 | 0.82mi |
| 141 W 43rd St Jacksonville, FL | 3.0 | 2.0 | 1022 | $1,231 | $1.20 | 3d | 1 | 0.89mi |
| 5514 Long St Jacksonville, FL | 2.0 | 1.0 | 941 | $1,250 | $1.33 | 1d | 1 | 0.90mi |
| 851 Broxton St Unit 851 Jacksonville, FL | 1.0 | 1.0 | 700 | $875 | $1.25 | 17d | 1 | 0.93mi |
| 205 E 44th St Jacksonville, FL | 3.0 | 1.0 | 955 | $1,075 | $1.13 | 21d | 1 | 0.93mi |
| 18 W 43rd St Jacksonville, FL | 2.0 | 1.0 | 750 | $795 | $1.06 | 4d | 1 | 0.94mi |
| 814 E 60th St Jacksonville, FL | 2.0 | 1.0 | 981 | $1,199 | $1.22 | 1d | 1 | 0.95mi |
| 841 E 60th St Jacksonville, FL | 3.0 | 1.0 | 954 | $1,225 | $1.28 | 23d | 1 | 0.99mi |
| 349 E 45th St Jacksonville, FL | 2.0 | 1.0 | 954 | $1,175 | $1.23 | 7d | 1 | 0.99mi |
Listing history 19 events
-
2026-06-07statusdays on market $79,990 Pending 45 DOM
-
2026-06-05days on market $79,990 Active 44 DOM
-
2026-06-03days on market $79,990 Active 43 DOM
-
2026-06-02days on market $79,990 Active 42 DOM
-
2026-06-01days on market $79,990 Active 41 DOM
-
2026-05-31days on market $79,990 Active 40 DOM
-
2026-04-21$79,990 Active
-
2020-08-04soldstatus $39,030 Closed 137-char remark
Show marketing remark (137 chars)
Unapproved short sale. Investment opportunity!! This house has lots of potential! Quaint 2/1 in Jacksonville in need of some serious TLC.
-
2020-07-30status Pending 137-char remark
Show marketing remark (137 chars)
Unapproved short sale. Investment opportunity!! This house has lots of potential! Quaint 2/1 in Jacksonville in need of some serious TLC.
-
2020-02-14historical Active Under Contract 137-char remark
Show marketing remark (137 chars)
Unapproved short sale. Investment opportunity!! This house has lots of potential! Quaint 2/1 in Jacksonville in need of some serious TLC.
-
2020-01-31$29,000 Active 137-char remark
Show marketing remark (137 chars)
Unapproved short sale. Investment opportunity!! This house has lots of potential! Quaint 2/1 in Jacksonville in need of some serious TLC.
-
2007-06-13soldstatus $126,000
-
2007-06-11historical 218-char remark
Show marketing remark (218 chars)
A must see to appreciate, a 2/1 remodeled home by home owner. New carpet, ceramic tile, beautiful bathroom, gorgeous kitchen, lots of cabinets, inside laundry, above ground pool, workshop with storage. Fenced backyard.
-
2007-06-08soldstatus $126,000 218-char remark
Show marketing remark (218 chars)
A must see to appreciate, a 2/1 remodeled home by home owner. New carpet, ceramic tile, beautiful bathroom, gorgeous kitchen, lots of cabinets, inside laundry, above ground pool, workshop with storage. Fenced backyard.
-
2006-11-29$125,000 218-char remark
Show marketing remark (218 chars)
A must see to appreciate, a 2/1 remodeled home by home owner. New carpet, ceramic tile, beautiful bathroom, gorgeous kitchen, lots of cabinets, inside laundry, above ground pool, workshop with storage. Fenced backyard.
-
2006-11-20historical
-
2006-09-25$137,500
-
2000-01-12soldstatus $33,600
-
1985-04-01soldstatus $35,500
ⓘ Source: listings_history table (triggers on properties + properties_extension) + one-shot
backfill from property_details.listing_events for pre-trigger history.
Tax reassessment forecast FL · Resets to sale price
- Current annual tax
- $1,746 · $146/mo
- Projected year-2 tax
- $1,746 · $146/mo
- Expected delta
- $0/yr ($0/mo · 0.0%)
ⓘ Screening estimate from a state-policy table — verify with the county assessor before closing.
Climate risk First Street
- Flood 1/10 Low FEMA zone X (unshaded) · 0% chance over 30 yrs
- Wildfire 1/10 Low
- Heat 9/10 Extreme 7 d/yr ≥107°F today · 20 d/yr by 30 yrs out
- Wind 9/10 Extreme 99% chance of damaging wind over 30 yrs
- Air quality 4/10 Moderate 6 unhealthy d/yr today · 6 by 30 yrs out
Nearby sold comps map
Loading sold comps map…
Walkable amenities ~0.75 mi
Loading nearby amenities…
Taxation est. · year 1
- Rental income
- $15,421
- − Mortgage interest
- −$4,481
- − Property taxes
- −$1,746
- − Insurance
- −$400
- − Repairs & maintenance
- −$1,234
- − Management
- −$1,234
- − Depreciation
- −$2,327
- Taxable income
- $4,000
- Est. tax owed @ 24.0%
- −$960
- After-tax cash flow
- $4,043/yr
For passive investors: Depreciation is non-cash, so a rental often shows a tax loss while cash-flowing — sheltering income. Rental losses are passive: they offset passive income freely, and up to $25,000/yr can offset ordinary (W-2) income if you actively participate and your MAGI is under $100k (phasing out to $0 by $150k); unused losses carry forward. On sale, claimed depreciation is recaptured at up to 25%, and gains may owe capital-gains tax (a 1031 exchange can defer both). Figures are a year-1 estimate at your 24.0% rate — not tax advice; consult a CPA.
Schools (NCES district)
- District
- Duval
- NCES district ID
- 1200480
- Math proficiency
- 46% ▼ -11.00%
- Reading proficiency
- 45% ▼ -4.00%
- Median HH income
- $48,987
- Composite
- 38.97/100
- National rank
- #4076
- State rank
- #48 of 73 in FL
Livability — Jacksonville
- Score
- 83/100
- State rank
- #50
- US rank
- #911
Category grades
Schools grade is shown separately in the Schools card above.
Census & demographics
- Census place
- Jacksonville, FL
- County
- Duval County · 1,015,274 people
- City population
- 979,034
- Metro
- Jacksonville, FL
- Population (ZIP)
- 32,699
- Household income
- $41,324
- Rent vs Own
- Severe rent burden
- 1765.0
Population outlook (Duval County) Hauer SSP2
- Today (2025)
- 1,013,010 people
- By 2030
- 1,059,228 · +4.6%
- By 2040
- 1,141,439 · +12.7%
- By 2050
- 1,205,258 · +19.0%
- By 2075
- 1,324,282 · +30.7%
- By 2100
- 1,319,620 · +30.3%
Race, ethnicity, and origin ACS 2023
- Neighborhood character
- Predominantly Black (77%)
- Race & ethnicity
- Black 77% White 16% Two or more races 4% Hispanic / Latino 3%
- Common ancestry
- Italian 1%
- Foreign-born
- 2% · Canada
- Languages at home
- 97% English-only · Spanish 2%
Political lean MEDSL · Duval
- 2024 margin
- Toss-up / Even · D 48.7% · R 50.1% · Other 1.2%
- 2008→2024 swing
- +0.4pp no change · 2008: -1.9pp · 2024: -1.5pp
- All cycles
- 2024: R+1.5 2020: D+3.8 2016: R+1.5 2012: R+3.6 2008: R+1.9
Not yet ingested
- Civics
- —
Market trends
- HPI YoY
- ▼ -110.56%
- Current HPI
- 217.9706
- Rent YoY
- ▼ -1.36%
- Metro
- Jacksonville, FL
- State GDP YoY
- ▲ 3.28%
- F500 in state
- 36
Industry mix (Fortune 500 HQ in FL)
| Industry | F500 HQs | Revenue |
|---|---|---|
| Industrial Technology | 2 | $29B |
|
||
| Insurance | 2 | $17B |
|
||
| Retail | 1 | $60B |
|
||
| Technology Distribution | 1 | $58B |
|
||
| Homebuilding | 1 | $35B |
|
||
| Technology Manufacturing | 1 | $35B |
|
||
Price history
+125.3% since first listed13 events — show timeline
- 2026-04-21 Listed $79,990 realMLS
- 2020-08-04 Sold (MLS) $39,030 MARMLS
- 2020-07-30 Pending — MARMLS
- 2020-02-14 Contingent — MARMLS
- 2020-01-31 Listed $29,000 MARMLS
- 2007-06-13 Sold (Public Records) $126,000 Public Records
- 2007-06-11 Listing Removed — realMLS
- 2007-06-08 Sold (MLS) $126,000 realMLS
- 2006-11-29 Listed $125,000 realMLS
- 2006-11-20 Listing Removed — realMLS
- 2006-09-25 Listed $137,500 realMLS
- 2000-01-12 Sold (Public Records) $33,600 Public Records
- 1985-04-01 Sold (Public Records) $35,500 Public Records
Property tax history
+10.1%/yrLatest (2025): $1,746 · +9.9% YoY. Source: county tax records.
Cash-flow waterfall
monthlySold comps — $/sqft
last 12 mo · ≤1 miLoading sold comps…