 🏗️ New Construction
8212 N 175 Ave · Omaha, NE
Flood risk No data
- FEMA flood zone
- —
- Chance of flooding over 30 yrs
- —
- Est. flood insurance / yr
- —
Fire risk No data
- Est. fire insurance / yr
- —
Heat risk No data
- Hot days now (above threshold)
- —
- Hot days in 30 yrs
- —
Wind risk No data
- Chance of severe wind over 30 yrs
- —
Air-quality risk No data
- Unhealthy air days now
- —
- Unhealthy air days in 30 yrs
- —
Risk factors via First Street. Map © Google.
Why this score? — see what drove the D grade
The composite is a weighted blend of 9 inputs, each scored 0–100. Each bar is that input's sub-score; the figure is the points it added to the 100-point composite (weight × sub-score).
- Cash flow +11.9/30.0
- ARV discount +7.5/15.0
- Schools +6.1/10.0
- Livability +4.2/5.0
- Rent growth +4.0/5.0
- DSCR +3.5/10.0
- Condition / age +2.5/5.0
- 1% rule +2.1/10.0
- Appreciation +0.0/10.0
$348,400
🖨 Deal sheet (PDF) 📄 Offer letter ✓ Due diligence
Listing remarks
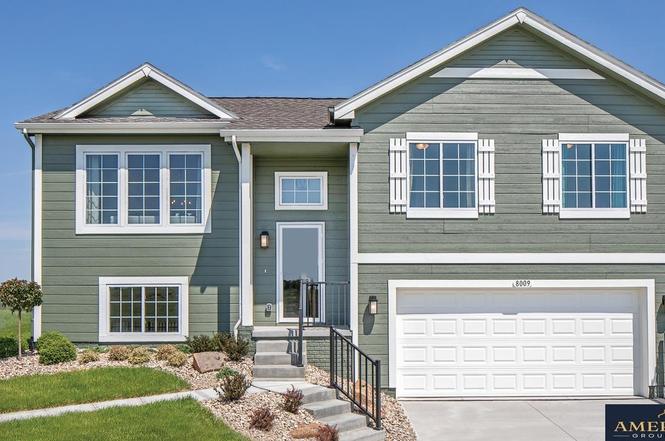
Welcome to The Vista by Celebrity Homes. This Open Design begins with a large Gathering Room shared with a spacious Eat-In Island Kitchen. The Great Room is perfect for entertaining or just relaxing with its’ Electric Linear Fireplace and Raised Ceilings. Need a little more space? The finished lower level is just perfect with a ¾ FINISHED BATH and SEPARATE LAUNDRY ROOM! Owner’s Suite is appointed with 2 walk-in closets, Bath with Dual Vanity. Features of this 3 Bedroom, 2 Bath Home Include: Oversized 2 Car Garage with a Garage Door Opener, Refrigerator, Washer/Dryer Package, Quartz Countertops, Luxury Vinyl Panel Flooring (LVP) Package, Sprinkler System, Extended 2-10 War
Key facts
- Raised ceilings
- Owner’s suite
- Finished lower level
Tags
Neighborhood map
What this means for you Summary
Snapshot
- This is a 3-bed/3.0-bath other listed at $348k.
Deal economics
- At list price, monthly cash flow is $-88 ($-1k/yr) — negative.
- To cash-flow at today's rent, offer at most $333k (4.4% below list).
- To meet the 1% rule (rent ≥ 1% of price), the offer needs to be $249k (28.6% below list).
- Recommended offer: $249k (28.6% below list) — sets the bar for 1% rule.
- Cap rate 6.0% vs local median 3.6% in Omaha — top-decile yield for the area; either an underpriced asset or a hidden risk that comps aren't pricing in. Stress-test before assuming the spread holds.
Location & tenants
- Location reads 84/100 on livability (#7 in NE, #663 nationally) — a professional / high-income tenant draw. Strengths: amenities A+, commute A+, cost of living A+; Watch: crime F.
- Bennington Public Schools (rural): math 67% / reading 67% proficiency, ranked #3 of 111 in NE (top 3%) — acceptable for families but not a draw, mixed tenant base, ~2y average lease; only 6% free/reduced lunch — higher-income household profile.
- Zoned schools: Anchor Pointe Elementary (math 65% / reading 71%, grade B+, #63 of 502 statewide, top 12%, 475 students, 8% FRL); Bennington South Middle School (510 students, 9% FRL); Bennington High School (math 66% / reading 70%, grade B, #21 of 261 statewide, top 8%, 1,002 students, 14% FRL) — zoned schools at 10% FRL track the district average.
- Market conditions: Rents rising fast (+5.9%/yr); 464 active listings in the ZIP; 4 comparable units currently listed for rent nearby; rentals leasing fast (median 4d on market — plan ~1-2 weeks tenant-placement turnaround); high-income renter base; 4,539 units permitted in Douglas County in 2024 (2,583 in 5+ unit buildings).
Forward outlook
- Local home prices are declining (-3.0%/yr); year-one equity from $2k of loan paydown is wiped out by about $10k of value loss. Plan a longer hold.
- Douglas County population projected at +28% by 2050 — long-run rental-demand tailwind backs the buy-and-hold thesis.
Negotiation context
- It's been on market 85 days — a 6% lower offer ($327k) is reasonable based on typical stale-listing flexibility.
- 2 sale attempts with the ask held roughly flat each time — persistent listings suggest the price (not the market) is what's stuck; bring a comps-based counter.
Questions for the listing agent
- What do current leases actually rent for vs. the listed asking? Can we see a recent rent roll and the last 12 months of T-12 income?
- It's been on market 85 days. Have you received any prior offers? Is the seller open to a 29% concession, seller financing, or rate buy-down credit?
- What does the HOA fee cover, when was the last increase, and are there any pending special assessments or reserve-fund shortfalls?
- Why hasn't it sold? Are there any deal-killer items the seller is aware of (foundation, flood, title, zoning, code violations)?
- Is there a deadline driving the sale (1031 exchange, divorce, estate, relocation)? That informs how much negotiation room exists.
- Crime grade is F in this area — have there been break-ins, vandalism, or insurance claims at this property in the last 3 years? What carrier currently insures it and at what premium?
- The area grade is low — what's the realistic commute time and amenity access for the typical tenant pool here? Any planned neighborhood developments (good or bad) we should know about?
- What's the average days-on-market for RENTAL listings here right now (not sales)? A rising rental-DOM trend means longer vacancies and softer asking-rent achievability than the comps imply.
- What's the recent tenant-quality profile in this submarket — average credit score on applications, eviction rate, late-payment / NSF rate, and stable-employment percentage? A property-management company in the area should have these aggregated.
- How much new for-sale + rental construction is in the pipeline within 1–3 miles? Heavy new supply typically softens prices + rents 12–24 months out; constrained supply supports both.
Investment metrics
- 1% rule
- 0.71% ✗
- Cap rate
- 5.99%
- Cash-on-cash
- -1.08%
- DSCR
- 0.95
- GRM
- 11.7
CMA / ARV
No comps found within radius.
Projected returns pro-forma
-3.0% appreciation · 5.88% rent growth · sell at horizon
- IRR
- -15.4%
- Equity multiple
- 0.44×
- Total profit
- $-54,808
- Equity at exit
- $51,948
- IRR
- -3.2%
- Equity multiple
- 0.76×
- Total profit
- $-23,373
- Equity at exit
- $30,123
Cash invested: $97,552 (down + closing). Projections, not guarantees.
Landlord ↔ Tenant lean methodology
- Overall (STATE)
- 83 Strongly Landlord-Friendly
- State Nebraska
- 83 Strongly Landlord-Friendly · R+13
- County
- — inherits STATE
- City
- — inherits STATE
ZIP-level market 68007
- Home prices YoY
- -19.4%
- Rents YoY
- 5.9%
- Active inventory
- 464
- Price-to-rent
- 11.7×
Monthly cashflow live
- Estimated rent
- $2,487 medium interval (Pro) →
- Mortgage (P&I)
- −$1,827
- Tax from tax record
- −$70 /mo · $845/yr
- Insurance
- −$145
- HOA
- −$10
- Vacancy / Maint / Mgmt
- −$522
- Net cashflow
- $-88
Break-even live
Sensitivity live
| Price | -10% $110 | -5% $11 | +0% $-88 | +5% $-186 | +10% $-285 |
|---|---|---|---|---|---|
| Rent | -10% $-284 | -5% $-186 | +0% $-88 | +5% $11 | +10% $109 |
| Rate | -1.0pp $88 | -0.5pp $1 | base $-88 | +0.5pp $-178 | +1.0pp $-270 |
UW: 25.0% down · 7.5% · 30yr · 1.5% tax · 5.0% vac · 8.0% maint · 8.0% mgmt
Financing live
Cash to close
- Down payment
- $87,100
- Closing costs
- $10,452
- Reserves months
- —
- Total cash needed
- —
Loan-product check · same deal, 3 products live
Conventional
25% down · 7.5% · 30yr
- Down + closing
- —
- Monthly P&I
- —
- Monthly cashflow
- —
- DSCR
- —
- Eligible?
- —
Personal DTI + credit; lowest rate.
DSCR
20% down · 8.5% · 30yr
- Down + closing
- —
- Monthly P&I
- —
- Monthly cashflow
- —
- DSCR
- —
- Eligible?
- —
No personal income docs; deal must DSCR.
Hard money
10% down · 12.0% · 12mo
- Down + closing
- —
- Monthly P&I
- —
- Monthly cashflow
- —
- DSCR
- —
- Eligible?
- —
Short-term bridge; refi at stabilization.
Rent comps 4 comps
| Address | Beds | Baths | Sqft | Rent | $/sqft | DOM | Units | Dist |
|---|---|---|---|---|---|---|---|---|
| 7308 N 167th Ave Bennington, NE | 4.0 | 3.0 | 2213 | $3,000 | $1.36 | 3d | 1 | 0.86mi |
| 8903 N 167th St Bennington, NE | 3.0 | 2.5 | 1511 | $2,500 | $1.65 | 3d | 1 | 0.91mi |
| 16333 Potter St Bennington, NE | 3.0 | 2.0 | 1618 | $3,200 | $1.98 | 3d | 1 | 1.11mi |
| 15840 Clay Plz Bennington, NE | 2.0 | 1.0–2.0 | 891 | $1,725 | $1.94 | 3d | 16 | 1.46mi |
HOA detail
- Monthly dues
- $10 · $120/yr
- Likely covers
- electric
Listing history 9 events
-
2026-02-27status Pending
-
2026-02-23price $348,400
-
2026-01-28price $346,900
-
2026-01-06price $349,900
-
2025-12-29price $346,900
-
2025-12-04$350,900 New
-
2025-05-19$379,400
-
2025-05-19historical
-
2025-05-19historical
ⓘ Source: listings_history table (triggers on properties + properties_extension) + one-shot
backfill from property_details.listing_events for pre-trigger history.
Tax reassessment forecast NE · Resets to sale price
- Current annual tax
- $845 · $70/mo
- Projected year-2 tax
- $6,027 · $502/mo
- Expected delta
- +$5,182/yr (+$432/mo · 613.2%)
ⓘ Screening estimate from a state-policy table — verify with the county assessor before closing.
Nearby sold comps map
Loading sold comps map…
Walkable amenities ~0.75 mi
Loading nearby amenities…
Taxation est. · year 1
- Rental income
- $29,847
- − Mortgage interest
- −$19,516
- − Property taxes
- −$845
- − Insurance
- −$1,742
- − Repairs & maintenance
- −$2,388
- − Management
- −$2,388
- − HOA
- −$120
- − Depreciation
- −$10,135
- Taxable loss
- −$7,287
- Est. tax savings @ 24.0%
- +$1,749
- After-tax cash flow
- $696/yr
For passive investors: Depreciation is non-cash, so a rental often shows a tax loss while cash-flowing — sheltering income. Rental losses are passive: they offset passive income freely, and up to $25,000/yr can offset ordinary (W-2) income if you actively participate and your MAGI is under $100k (phasing out to $0 by $150k); unused losses carry forward. On sale, claimed depreciation is recaptured at up to 25%, and gains may owe capital-gains tax (a 1031 exchange can defer both). Figures are a year-1 estimate at your 24.0% rate — not tax advice; consult a CPA.
Schools (NCES district)
- District
- Bennington Public Schools
- NCES district ID
- 3103990
- Math proficiency
- 67% ▼ -6.00%
- Reading proficiency
- 67% ▼ -7.00%
- Median HH income
- $87,771
- Composite
- 60.5/100
- National rank
- #843
- State rank
- #3 of 111 in NE
Livability — Omaha
- Score
- 84/100
- State rank
- #7
- US rank
- #663
Category grades
Schools grade is shown separately in the Schools card above.
Census & demographics
- County
- Douglas County · 538,646 people
- City population
- 552,986
- Metro
- Omaha-Council Bluffs, NE-IA
- Population (ZIP)
- 19,536
- Household income
- $141,042
- Rent vs Own
- Severe rent burden
- 107.0
Population outlook (Douglas County) Hauer SSP2
- Today (2025)
- 625,245 people
- By 2030
- 661,613 · +5.8%
- By 2040
- 732,395 · +17.1%
- By 2050
- 801,988 · +28.3%
- By 2075
- 968,637 · +54.9%
- By 2100
- 1,101,871 · +76.2%
Race, ethnicity, and origin ACS 2023
- Neighborhood character
- Predominantly White (84%)
- Race & ethnicity
- White 84% Hispanic / Latino 6% Two or more races 5% Black 4% Asian 2%
- Hispanic origin (detail)
- Mexican 3%
- Common ancestry
- Iranian 4% Romanian 4% Italian 3%
- Foreign-born
- 3% · Canada
- Languages at home
- 94% English-only · Spanish 3% Other Indo-European 1% Russian/Polish/Slavic 1%
Political lean MEDSL · Douglas
- 2024 margin
- D (+10.2) · D 54.4% · R 44.2% · Other 1.4%
- 2008→2024 swing
- +5.5pp toward D · 2008: 4.6pp · 2024: 10.2pp
- All cycles
- 2024: D+10.2 2020: D+11.3 2016: D+1.4 2012: R+4.3 2008: D+4.6
Not yet ingested
- Civics
- —
Market trends
- HPI YoY
- ▼ -60.06%
- Current HPI
- 250.3443
- Rent YoY
- ▲ 5.88%
- Metro
- Omaha-Council Bluffs, NE-IA
- State GDP YoY
- ▲ 0.68%
- F500 in state
- 2
Industry mix (Fortune 500 HQ in NE)
| Industry | F500 HQs | Revenue |
|---|---|---|
| Conglomerate | 1 | $371B |
|
||
Price history
-8.2% since first listed9 events — show timeline
- 2026-02-27 Pending — GPRMLS
- 2026-02-23 Price Changed $348,400 GPRMLS
- 2026-01-28 Price Changed $346,900 GPRMLS
- 2026-01-06 Price Changed $349,900 GPRMLS
- 2025-12-29 Price Changed $346,900 GPRMLS
- 2025-12-04 Listed $350,900 GPRMLS
- 2025-05-19 Listing Removed — GPRMLS
- 2025-05-19 Listing Removed — GPRMLS
- 2025-05-19 Listed $379,400 GPRMLS
Property tax history
+87.6%/yrLatest (2025): $845 · +74.3% YoY. Source: county tax records.
Cash-flow waterfall
monthlySold comps — $/sqft
last 12 mo · ≤1 miLoading sold comps…