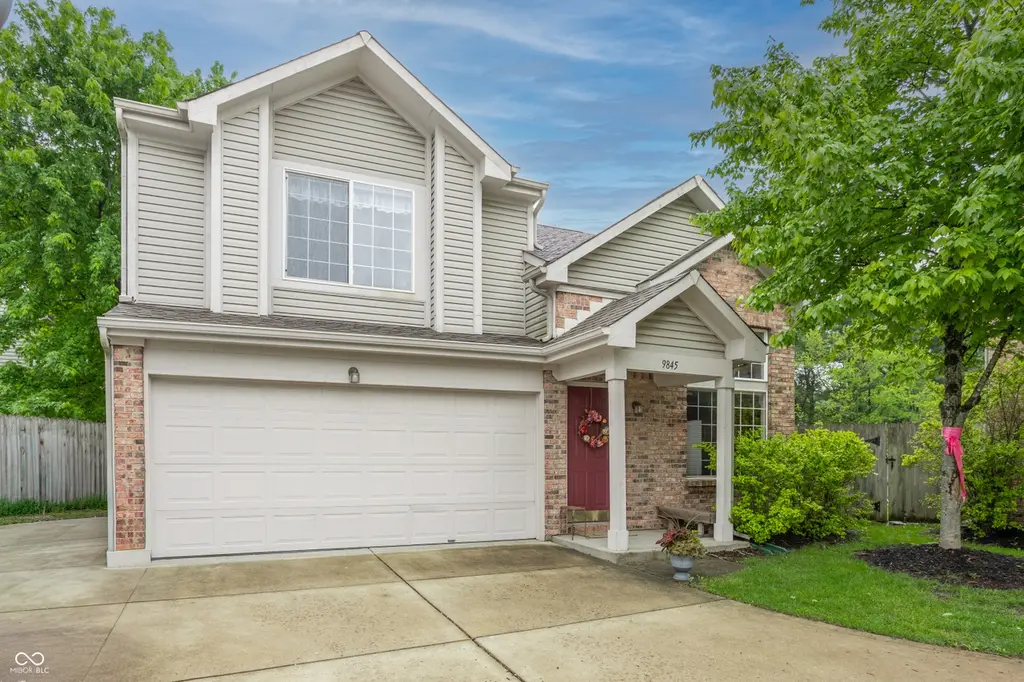
9845 Worthington Blvd · Fishers, IN
Flood risk 1/10 · Minimal
- FEMA flood zone
- X (unshaded)
- Chance of flooding over 30 yrs
- 0.0%
- Est. flood insurance / yr
- $507 – $1,088
Fire risk 1/10 · Minimal
- Est. fire insurance / yr
- $717 – $1,331
Heat risk 3/10 · Minor
- Hot days now (above 101°F)
- 7 days/yr
- Hot days in 30 yrs
- 18 days/yr
Wind risk 2/10 · Minimal
- Chance of severe wind over 30 yrs
- 0.0%
Air-quality risk 2/10 · Minimal
- Unhealthy air days now
- 1 days/yr
- Unhealthy air days in 30 yrs
- 1 days/yr
Risk factors via First Street. Map © Google.
Why this score? — see what drove the D grade
The composite is a weighted blend of 9 inputs, each scored 0–100. Each bar is that input's sub-score; the figure is the points it added to the 100-point composite (weight × sub-score).
- Cash flow +11.5/30.0
- ARV discount +7.5/15.0
- Schools +5.3/10.0
- Livability +4.2/5.0
- DSCR +3.4/10.0
- 1% rule +3.1/10.0
- Rent growth +2.8/5.0
- Condition / age +2.5/5.0
- Appreciation +0.0/10.0
$255,900
🖨 Deal sheet (PDF) 📄 Offer letter ✓ Due diligence
Listing remarks MLS
Affordable 3 bedroom, 2 .5 bath home in Fishers. Great value! Great investment property. Condo-style living in a free standing home with snow removal (to your front & garage door), trash removal & front lawn & landscaping included. Highly rated schools. New road expansions make this home very convenient. View it today, submit an offer soon, don't miss out.
Key facts
- Walk-in closet
- Open floorplan
- Built-in cabinets
Tags
Property features AI
Finance
- HOA & community: HOA with monthly fee (approximately $100); HOA covers entrance/common areas, insurance, lawn care, maintenance, management, snow removal and trash; Covenants and restrictions apply; No shared/common walls
Exterior
- Parking: Attached 2-car garage; Finished garage with storage; Garage door opener; Concrete parking
- Security: Security system; Smoke alarm
- Utilities: Public water; Municipal sewer connection; Electricity connected
- Home design: Residential condominium; Free-standing/co-op style; Updated/remodeled condition; Two levels
- Construction: Brick and vinyl siding exterior; Slab foundation; Built by Arbor Homes
- Exterior features: Deck; Full privacy fence; Small trees and sidewalks on lot; On waterfront (pond)
Interior
- Kitchen: Dishwasher; Disposal; Microwave; Electric oven; Refrigerator
- Bedrooms: Three upper bedrooms; Primary bedroom with walk-in closet
- Flooring: Two floors
- Bathrooms: Two full bathrooms; One half bathroom; Primary bathroom with tub, separate shower and suite layout
- Heating & cooling: Electric forced-air heating; Central air conditioning
- Interior features: Built-in features; Vaulted ceilings; Stained/painted woodwork
- Laundry & utility: Main-level laundry; Washer; Dryer; Electric water heater
Neighborhood map
What this means for you Summary
Snapshot
- This is a 3-bed/2.5-bath condo listed at $256k.
Deal economics
- At list price, monthly cash flow is $-84 ($-1k/yr) — negative.
- To cash-flow at today's rent, offer at most $241k (5.8% below list).
- To meet the 1% rule (rent ≥ 1% of price), the offer needs to be $208k (18.8% below list).
- Recommended offer: $208k (18.8% below list) — sets the bar for 1% rule.
- Cap rate 5.9% vs local median 3.6% in Fishers — top-decile yield for the area; either an underpriced asset or a hidden risk that comps aren't pricing in. Stress-test before assuming the spread holds.
Location & tenants
- Location reads 83/100 on livability (#11 in IN, #898 nationally) — a professional / high-income tenant draw. Strengths: crime A+, amenities A+, employment A+; Watch: commute F.
- Hamilton Southeastern Schools (suburban): math 57% / reading 59% proficiency, ranked #14 of 301 in IN (top 5%) — acceptable for families but not a draw, mixed tenant base, ~2y average lease; only 10% free/reduced lunch — higher-income household profile.
- Zoned schools: Harrison Parkway Elementary School (math 56% / reading 52%, grade C, #221 of 994 statewide, top 22%, 584 students, 35% FRL); Fishers Junior High School (math 44% / reading 54%, grade C-, #53 of 330 statewide, top 16%, 863 students, 28% FRL); Fishers High School (math 64% / reading 82%, grade B+, #8 of 369 statewide, top 2%, 3,674 students, 22% FRL) — zoned schools average 28% FRL vs 10% district-wide (19 pts higher); higher-poverty schools than district average — tighter screening recommended.
- Market conditions: Rents rising (+1.3%/yr); 248 active listings in the ZIP; 18 comparable units currently listed for rent nearby; rentals leasing fast (median 10d on market — plan ~1-2 weeks tenant-placement turnaround); solid renter incomes; 4,661 units permitted in Hamilton County in 2024 (1,528 in 5+ unit buildings).
Forward outlook
- Local home prices are declining (-3.0%/yr); year-one equity from $2k of loan paydown is wiped out by about $8k of value loss. Plan a longer hold.
- Hamilton County population projected at +44% by 2050 — long-run rental-demand tailwind backs the buy-and-hold thesis.
Negotiation context
- Only 2 days on market — expect competitive offers; lowballing is unlikely to land.
- 4 sale attempts since 22y ago with the ask held roughly flat each time — persistent listings suggest the price (not the market) is what's stuck; bring a comps-based counter.
- Current owner paid $114k; list at $256k implies a 124% gain — meaningful room to come down on a strong offer.
Questions for the listing agent
- What do current leases actually rent for vs. the listed asking? Can we see a recent rent roll and the last 12 months of T-12 income?
- What does the HOA fee cover, when was the last increase, and are there any pending special assessments or reserve-fund shortfalls?
- Any open or pending special assessments — roof, HVAC, plumbing, elevator, façade? What's the per-unit balance and payoff schedule, and is the seller paying it off at close or rolling it to the buyer?
- Is there a deadline driving the sale (1031 exchange, divorce, estate, relocation)? That informs how much negotiation room exists.
- Schools are A-rated — typically a magnet for longer-tenancy family renters. What's the average tenant stay here, and is there a school-zone premium baked into asking?
- The area grade is low — what's the realistic commute time and amenity access for the typical tenant pool here? Any planned neighborhood developments (good or bad) we should know about?
- What's the average days-on-market for RENTAL listings here right now (not sales)? A rising rental-DOM trend means longer vacancies and softer asking-rent achievability than the comps imply.
- What's the recent tenant-quality profile in this submarket — average credit score on applications, eviction rate, late-payment / NSF rate, and stable-employment percentage? A property-management company in the area should have these aggregated.
- How much new apartment / multifamily construction is in the pipeline within 1–3 miles? Heavy new supply (>2% of stock underway) typically softens rents 12–24 months out; light construction supports rent growth.
Investment metrics
- 1% rule
- 0.81% ✗
- Cap rate
- 5.90%
- Cash-on-cash
- -1.41%
- DSCR
- 0.94
- GRM
- 10.3
CMA / ARV
No comps found within radius.
Projected returns pro-forma
-3.0% appreciation · 1.27% rent growth · sell at horizon
- IRR
- -20.5%
- Equity multiple
- 0.30×
- Total profit
- $-50,389
- Equity at exit
- $38,156
- IRR
- -18.0%
- Equity multiple
- 0.09×
- Total profit
- $-64,866
- Equity at exit
- $22,126
Cash invested: $71,652 (down + closing). Projections, not guarantees.
Landlord ↔ Tenant lean methodology
- Overall (STATE)
- 90 Strongly Landlord-Friendly
- State Indiana
- 90 Strongly Landlord-Friendly · R+11
- County
- — inherits STATE
- City
- — inherits STATE
ZIP-level market 46038
- Home prices YoY
- -14.2%
- Rents YoY
- 1.3%
- Active inventory
- 248
- Price-to-rent
- 10.3×
Monthly cashflow live
- Estimated rent
- $2,078 high interval (Pro) →
- Mortgage (P&I)
- −$1,342
- Tax from tax record
- −$178 /mo · $2,130/yr
- Insurance
- −$107
- HOA
- −$100
- Vacancy / Maint / Mgmt
- −$436
- Net cashflow
- $-84
Break-even live
Sensitivity live
| Price | -10% $61 | -5% $-12 | +0% $-84 | +5% $-157 | +10% $-229 |
|---|---|---|---|---|---|
| Rent | -10% $-249 | -5% $-166 | +0% $-84 | +5% $-2 | +10% $80 |
| Rate | -1.0pp $45 | -0.5pp $-19 | base $-84 | +0.5pp $-151 | +1.0pp $-218 |
UW: 25.0% down · 7.5% · 30yr · 1.5% tax · 5.0% vac · 8.0% maint · 8.0% mgmt
Financing live
Cash to close
- Down payment
- $63,975
- Closing costs
- $7,677
- Reserves months
- —
- Total cash needed
- —
Loan-product check · same deal, 3 products live
Conventional
25% down · 7.5% · 30yr
- Down + closing
- —
- Monthly P&I
- —
- Monthly cashflow
- —
- DSCR
- —
- Eligible?
- —
Personal DTI + credit; lowest rate.
DSCR
20% down · 8.5% · 30yr
- Down + closing
- —
- Monthly P&I
- —
- Monthly cashflow
- —
- DSCR
- —
- Eligible?
- —
No personal income docs; deal must DSCR.
Hard money
10% down · 12.0% · 12mo
- Down + closing
- —
- Monthly P&I
- —
- Monthly cashflow
- —
- DSCR
- —
- Eligible?
- —
Short-term bridge; refi at stabilization.
Rent comps 18 comps
| Address | Beds | Baths | Sqft | Rent | $/sqft | DOM | Units | Dist |
|---|---|---|---|---|---|---|---|---|
| 9833 Worthington Blvd Fishers, IN | 3.0 | 2.5 | 1495 | $2,025 | $1.35 | 4d | 1 | 0.04mi |
| 14326 Shooting Star Dr Noblesville, IN | 2.0 | 2.5 | 1746 | $1,850 | $1.06 | 0d | 1 | 0.17mi |
| 9652 Wild Iris Dr Noblesville, IN | 3.0 | 2.5 | 1676 | $2,100 | $1.25 | 4d | 1 | 0.23mi |
| 9660 Angelica Dr Noblesville, IN | 3.0 | 2.5 | 1746 | $2,095 | $1.20 | 45d | 1 | 0.25mi |
| 14337 Weeping Cherry Dr Fishers, IN | 3.0 | 2.5 | 1880 | $2,200 | $1.17 | 0d | 1 | 0.27mi |
| 10154 Holly Berry Cir Fishers, IN | 3.0 | 2.0 | 1549 | $2,225 | $1.44 | 25d | 1 | 0.29mi |
| 14260 Bald Eagle Dr Noblesville, IN | 1.0–2.0 | 1.0–2.0 | 1031 | $1,829 | $1.77 | 0d | 13 | 0.35mi |
| 13791 Old Oak Dr Fishers, IN | 1.0–3.0 | 1.0–2.0 | 1123 | $1,965 | $1.75 | 0d | 9 | 0.66mi |
| 15001 Creekstone Way Noblesville, IN | 1.0–2.0 | 1.0–2.0 | 962 | $2,208 | $2.30 | 0d | 34 | 0.85mi |
| 15001 Creekstone Way Noblesville, IN | 1.0–3.0 | 1.0–2.0 | 1102 | $2,394 | $2.17 | 21d | 17 | 0.85mi |
| 15001 Noblesville, IN | 1.0–3.0 | 1.0–2.0 | 1102 | $2,394 | $2.17 | 13d | 1 | 0.85mi |
| 13968 Wakefield Pl Fishers, IN | 4.0 | 2.5 | 1674 | $2,250 | $1.34 | 45d | 1 | 0.93mi |
| 9588 Ambleside Dr Fishers, IN | 3.0 | 1.0–2.0 | 1017 | $2,024 | $1.99 | 0d | 34 | 1.17mi |
| 10686 Trailwood Dr Fishers, IN | 3.0 | 2.5 | 1640 | $2,300 | $1.40 | 25d | 1 | 1.22mi |
| 10152 Golden Dr Noblesville, IN | 4.0 | 2.5 | 1946 | $1,999 | $1.03 | 9d | 1 | 1.31mi |
| 10856 Trailwood Dr Fishers, IN | 4.0 | 2.5 | 1700 | $2,400 | $1.41 | 25d | 1 | 1.38mi |
| 15201 Flats Dr Noblesville, IN | 1.0–3.0 | 1.0–2.0 | 1079 | $1,825 | $1.69 | 0d | 52 | 1.43mi |
| 12848 Patrick Ct Fishers, IN | 3.0 | 2.0 | 1569 | $2,350 | $1.50 | 45d | 1 | 1.44mi |
HOA detail condo
- Monthly dues
- $100 · $1,200/yr
- Likely covers
- trashlandscapingsnow removal
- Assessments
- None detected in remarks — confirm with the listing agent.
Listing history 8 events
-
2026-05-06status Pending
-
2026-05-04$255,900 Active
-
2008-04-23soldstatus $114,000 374-char remark
Show marketing remark (374 chars)
Affordable 3 bedroom, 2 .5 bath home in Fishers. Great value! Great investment property. Condo-style living in a free standing home with snow removal (to your front & garage door), trash removal & front lawn & landscaping included. Highly rated schools. New road expansions make this home very convenient. View it today, submit an offer soon, don't miss out.
-
2007-10-18$112,000 374-char remark
Show marketing remark (374 chars)
Affordable 3 bedroom, 2 .5 bath home in Fishers. Great value! Great investment property. Condo-style living in a free standing home with snow removal (to your front & garage door), trash removal & front lawn & landscaping included. Highly rated schools. New road expansions make this home very convenient. View it today, submit an offer soon, don't miss out.
-
2005-06-03historical
-
2005-05-31soldstatus $112,000
-
2005-01-06$112,500
-
2004-12-06$119,900
ⓘ Source: listings_history table (triggers on properties + properties_extension) + one-shot
backfill from property_details.listing_events for pre-trigger history.
Tax reassessment forecast IN · Partial reset (capped growth)
- Current annual tax
- $2,130 · $178/mo
- Projected year-2 tax
- $2,153 · $179/mo
- Expected delta
- +$22/yr (+$2/mo · 1.1%)
ⓘ Screening estimate from a state-policy table — verify with the county assessor before closing.
Climate risk First Street
- Flood 1/10 Low FEMA zone X (unshaded) · 0% chance over 30 yrs
- Wildfire 1/10 Low
- Heat 3/10 Moderate 7 d/yr ≥101°F today · 18 d/yr by 30 yrs out
- Wind 2/10 Low 0% chance of damaging wind over 30 yrs
- Air quality 2/10 Low 1 unhealthy d/yr today · 1 by 30 yrs out
Nearby sold comps map
Loading sold comps map…
Walkable amenities ~0.75 mi
Loading nearby amenities…
Taxation est. · year 1
- Rental income
- $24,939
- − Mortgage interest
- −$14,334
- − Property taxes
- −$2,130
- − Insurance
- −$1,280
- − Repairs & maintenance
- −$1,995
- − Management
- −$1,995
- − HOA
- −$1,200
- − Depreciation
- −$7,444
- Taxable loss
- −$5,440
- Est. tax savings @ 24.0%
- +$1,306
- After-tax cash flow
- $294/yr
For passive investors: Depreciation is non-cash, so a rental often shows a tax loss while cash-flowing — sheltering income. Rental losses are passive: they offset passive income freely, and up to $25,000/yr can offset ordinary (W-2) income if you actively participate and your MAGI is under $100k (phasing out to $0 by $150k); unused losses carry forward. On sale, claimed depreciation is recaptured at up to 25%, and gains may owe capital-gains tax (a 1031 exchange can defer both). Figures are a year-1 estimate at your 24.0% rate — not tax advice; consult a CPA.
Schools (NCES district)
- District
- Hamilton Southeastern Schools
- NCES district ID
- 1810650
- Math proficiency
- 57% ▼ -11.00%
- Reading proficiency
- 59% ▼ -7.00%
- Median HH income
- $87,726
- Composite
- 53.02/100
- National rank
- #1520
- State rank
- #14 of 301 in IN
Livability — Fishers
- Score
- 83/100
- State rank
- #11
- US rank
- #898
Category grades
Schools grade is shown separately in the Schools card above.
Census & demographics
- Census place
- Fishers, IN
- County
- Hamilton County · 337,479 people
- City population
- 92,467
- Metro
- Indianapolis-Carmel-Anderson, IN
- Population (ZIP)
- 43,754
- Household income
- $106,886
- Rent vs Own
- Severe rent burden
- 925.0
Population outlook (Hamilton County) Hauer SSP2
- Today (2025)
- 381,938 people
- By 2030
- 417,496 · +9.3%
- By 2040
- 486,684 · +27.4%
- By 2050
- 549,805 · +44.0%
- By 2075
- 687,078 · +79.9%
- By 2100
- 754,495 · +97.5%
Race, ethnicity, and origin ACS 2023
- Neighborhood character
- Predominantly White (79%)
- Race & ethnicity
- White 79% Asian 6% Black 6% Two or more races 5% Hispanic / Latino 4%
- Common ancestry
- Romanian 3% Italian 2% Lithuanian 2%
- Foreign-born
- 10% · Canada, China, South Korea
- Languages at home
- 88% English-only · Other Indo-European 3% Spanish 3% Arabic 2%
Political lean MEDSL · Hamilton
- 2024 margin
- Lean R (+6.1) · D 46.0% · R 52.1% · Other 1.9%
- 2008→2024 swing
- +16.2pp toward D · 2008: -22.2pp · 2024: -6.1pp
- All cycles
- 2024: R+6.1 2020: R+6.8 2016: R+19.6 2012: R+34.3 2008: R+22.2
Not yet ingested
- Civics
- —
Market trends
- HPI YoY
- ▼ -39.52%
- Current HPI
- 238.7602
- Rent YoY
- ▲ 1.27%
- Metro
- Indianapolis-Carmel-Anderson, IN
- State GDP YoY
- ▲ 2.90%
- F500 in state
- 18
Industry mix (Fortune 500 HQ in IN)
| Industry | F500 HQs | Revenue |
|---|---|---|
| Industrial Machinery | 2 | $37B |
|
||
| Healthcare | 1 | $177B |
|
||
| Pharmaceuticals | 1 | $45B |
|
||
| Metals / Steel | 1 | $18B |
|
||
| Agriculture | 1 | $17B |
|
||
| Packaging | 1 | $12B |
|
||
Price history
+113.4% since first listed8 events — show timeline
- 2026-05-06 Pending — MIBOR as Distributed by MLS Grid
- 2026-05-04 Listed $255,900 MIBOR as Distributed by MLS Grid
- 2008-04-23 Sold (MLS) $114,000 MIBOR as Distributed by MLS Grid
- 2007-10-18 Listed $112,000 MIBOR as Distributed by MLS Grid
- 2005-06-03 Listing Removed — MIBOR as Distributed by MLS Grid
- 2005-05-31 Sold (MLS) $112,000 MIBOR as Distributed by MLS Grid
- 2005-01-06 Listed $112,500 MIBOR as Distributed by MLS Grid
- 2004-12-06 Listed $119,900 MIBOR as Distributed by MLS Grid
Property tax history
+8.2%/yrLatest (2025): $2,130 · -3.3% YoY. Source: county tax records.
Cash-flow waterfall
monthlySold comps — $/sqft
last 12 mo · ≤1 miLoading sold comps…