204 E State St #2 · Baton Rouge, LA
Flood risk 8/10 · Major
- FEMA flood zone
- AE
- Chance of flooding over 30 yrs
- 0.99%
- Est. flood insurance / yr
- $1,737 – $8,500
Fire risk 1/10 · Minimal
- Est. fire insurance / yr
- $1,269 – $2,357
Heat risk 8/10 · Major
- Hot days now (above 108°F)
- 7 days/yr
- Hot days in 30 yrs
- 21 days/yr
Wind risk 9/10 · Severe
- Chance of severe wind over 30 yrs
- 99.0%
Air-quality risk 2/10 · Minimal
- Unhealthy air days now
- 1 days/yr
- Unhealthy air days in 30 yrs
- 1 days/yr
Risk factors via First Street. Map © Google.
Why this score? — see what drove the F grade
The composite is a weighted blend of 9 inputs, each scored 0–100. Each bar is that input's sub-score; the figure is the points it added to the 100-point composite (weight × sub-score).
- ARV discount +7.5/15.0
- Rent growth +4.1/5.0
- Livability +3.7/5.0
- Schools +2.4/10.0
- Condition / age +2.2/5.0
- Cash flow +1.4/30.0
- 1% rule +0.0/10.0
- DSCR +0.0/10.0
- Appreciation +0.0/10.0
$350,000
🖨 Deal sheet 📄 Offer letter ✓ Due diligence
Listing remarks MLS
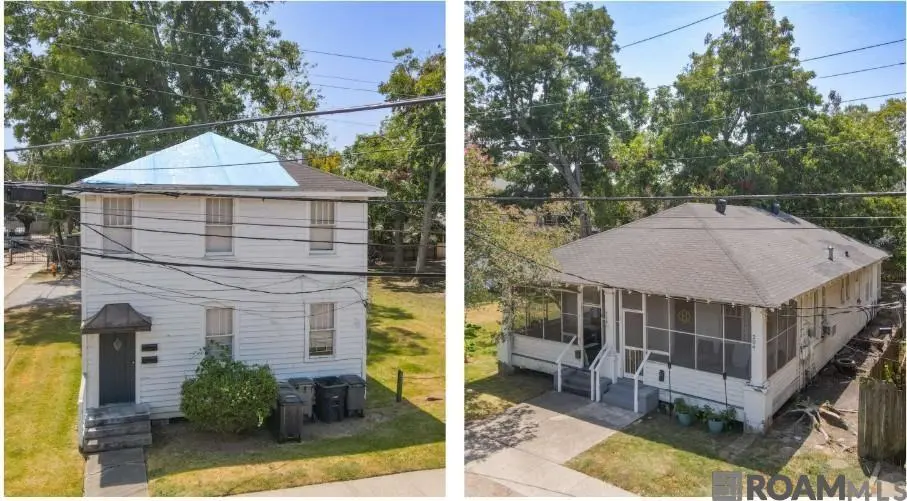
Developer's Dream Near LSU - Income Now, Expansion Potential for the Future Unlock the possibilities with this exceptional Baton Rouge investment opportunity featuring two income-producing duplexes plus two additional lots in a rapidly growing corridor just minutes from Louisiana State University. Located at 204-206 E. State Street and 226 A&B State Street, 240 E State Street (lot) and a parcel in between properties, this rare multi-property package offers the perfect blend of immediate cash flow and outstanding redevelopment potential. Fully occupied and generating steady rental income, these well-maintained duplexes showcase timeless architectural charm with desirable features including 9-foot ceilings, hardwood floors, newer roofs, and individually metered utilities for streamlined management and tenant convenience. The prime location near LSU ensures continued rental demand and long-term investment stability. What truly sets this portfolio apart is the incredible opportunity for new construction and multi-unit development. The additional lots create a unique canvas for developers/investors looking to expand, build additional units, increase density, or capitalize on the area's ongoing growth and housing demand. This multi-property package is ideal for investors seeking stable cash flow, proximity to LSU, and long-term appreciation potential in the growing Baton Rouge market. All information is believed to be accurate but not guaranteed and should be independently verified by purchaser. Measurements, occupancy status, zoning, lot dimensions, and investment projections are approximate and subject to buyer verification.
Key facts
- Additional lots
- Newer roofs
- Steady rental income
Tags
Property features AI
Finance
- Other: Located in the Arbour Place subdivision
Exterior
- Parking: Parking lot with 4 spaces
- Utilities: Public water; Public sewer
- Home design: Residential income property; Duplex; 2 stories
- Construction: Frame construction; Cement siding; Shingle roof
- Exterior features: Front porch
Interior
- Kitchen: Gas cooktop; Refrigerator
- Flooring: Tile; Wood; Ceramic tile
- Heating & cooling: Wall furnace heating; Window unit cooling
- Interior features: High ceilings
Neighborhood map
What this means for you Summary
Snapshot
- This is a condo listed at $350k. Condition is rated fair.
Deal economics
- At list price, monthly cash flow is $-2k ($-22k/yr) — negative.
- To cash-flow at today's rent, offer at most $88k (74.8% below list).
- To meet the 1% rule (rent ≥ 1% of price), the offer needs to be $131k (62.5% below list).
- Recommended offer: $88k (74.8% below list) — sets the bar for cash-flow.
- Cap rate 1.6% vs local median 4.3% in Baton Rouge — below-typical yield; the buyer is paying a premium for something (appreciation thesis, condition, location) that the cap rate doesn't capture.
Location & tenants
- Location reads 74/100 on livability (#24 in LA, #4,535 nationally) — a middle-class / working-renter tenant base. Strengths: commute A+, cost of living A+, health & safety A+; Watch: amenities D, crime F, employment D-.
- East Baton Rouge Parish (urban): math 22% / reading 34% proficiency, ranked #47 of 98 in LA (top 48%) — low school quality limits family demand, transient renter base, plan for 1-2y turnover; 77% free/reduced lunch — lower-income household profile, screen leases tightly.
- Market conditions: Rents rising fast (+6.6%/yr); 188 active listings in the ZIP; 31 comparable units currently listed for rent nearby; rentals at typical pace (median 24d on market — plan ~3-4 weeks tenant-placement turnaround); 48% of comp listings sitting > 30 days — soft ceiling on asking rent; lower-income renter base — watch delinquency; 2,252 units permitted in East Baton Rouge Parish in 2024 (440 in 5+ unit buildings).
- At $1,312/mo this rent would consume 46% of the median local household income ($34k/yr) (locally 1831% of renters already pay >50% of income on rent) — very limited rent-growth headroom before tenants either downsize or default.
Forward outlook
- Local home prices are declining (-3.0%/yr); year-one equity from $2k of loan paydown is wiped out by about $10k of value loss. Plan a longer hold.
- East Baton Rouge County population projected at +4% by 2050 — modest demand growth; plan on rents tracking national, not racing it.
Negotiation context
- It's been on market 30 days — a 2% lower offer ($345k) is reasonable based on typical stale-listing flexibility.
- 2 sale attempts with the ask held roughly flat each time — persistent listings suggest the price (not the market) is what's stuck; bring a comps-based counter.
Risks & watch-outs
- Watch-outs: flood insurance adds $427/mo.
- Climate carrying-cost: in FEMA flood zone AE (mandatory federal flood insurance); severe wind risk, 99% chance of damaging wind over 30y; extreme-heat days projected 7→21/yr by 2055 (HVAC capex compounding) — expect insurance premiums to compound above CPI over the hold.
Questions for the listing agent
- What do current leases actually rent for vs. the listed asking? Can we see a recent rent roll and the last 12 months of T-12 income?
- Have any recent inspections been done? Can we get a copy of the seller's disclosures and any deferred-maintenance estimates?
- What's the actual annual flood-insurance premium (NFIP or private), and is the property in a SFHA with mandatory coverage?
- Any open or pending special assessments — roof, HVAC, plumbing, elevator, façade? What's the per-unit balance and payoff schedule, and is the seller paying it off at close or rolling it to the buyer?
- Is there a deadline driving the sale (1031 exchange, divorce, estate, relocation)? That informs how much negotiation room exists.
- Crime grade is F in this area — have there been break-ins, vandalism, or insurance claims at this property in the last 3 years? What carrier currently insures it and at what premium?
- The area grade is low — what's the realistic commute time and amenity access for the typical tenant pool here? Any planned neighborhood developments (good or bad) we should know about?
- What's the average days-on-market for RENTAL listings here right now (not sales)? A rising rental-DOM trend means longer vacancies and softer asking-rent achievability than the comps imply.
- What's the recent tenant-quality profile in this submarket — average credit score on applications, eviction rate, late-payment / NSF rate, and stable-employment percentage? A property-management company in the area should have these aggregated.
- How much new apartment / multifamily construction is in the pipeline within 1–3 miles? Heavy new supply (>2% of stock underway) typically softens rents 12–24 months out; light construction supports rent growth.
Investment metrics
- 1% rule
- 0.37% ✗
- Cap rate
- 1.55%
- Cash-on-cash
- -16.93%
- DSCR
- 0.25
- GRM
- 22.2
CMA / ARV
No comps found within radius.
Projected returns pro-forma
-3.0% appreciation · 6.59% rent growth · sell at horizon
- IRR
- -59.1%
- Equity multiple
- -0.70×
- Total profit
- $-166,728
- Equity at exit
- $52,186
- IRR
- —
- Equity multiple
- -1.76×
- Total profit
- $-270,690
- Equity at exit
- $30,262
Cash invested: $98,000 (down + closing). Projections, not guarantees.
Landlord ↔ Tenant lean methodology
- Overall (STATE)
- 90 Strongly Landlord-Friendly
- State Louisiana
- 90 Strongly Landlord-Friendly · R+12
- County
- — inherits STATE
- City
- — inherits STATE
ZIP-level market 70802
- Rents YoY
- 6.6%
- Active inventory
- 188
- Price-to-rent
- 22.2×
Monthly cashflow live
- Estimated rent
- $1,312 high interval (Pro) →
- Mortgage (P&I)
- −$1,835
- Tax est. 1.5%
- −$438 /mo · $5,250/yr
- Insurance
- −$146
- Flood insurance flood zone
- −$427 /mo · $5,118/yr
- HOA
- −$0
- Vacancy / Maint / Mgmt
- −$276
- Net cashflow
- $-1,809
Break-even live
UW: 25.0% down · 7.5% · 30yr · 1.5% tax · 5.0% vac · 8.0% maint · 8.0% mgmt
Financing live
Cash to close
- Down payment
- $87,500
- Closing costs
- $10,500
- Reserves months
- —
- Total cash needed
- —
Loan-product check · same deal, 3 products live
Conventional
25% down · 7.5% · 30yr
- Down + closing
- —
- Monthly P&I
- —
- Monthly cashflow
- —
- DSCR
- —
- Eligible?
- —
Personal DTI + credit; lowest rate.
DSCR
20% down · 8.5% · 30yr
- Down + closing
- —
- Monthly P&I
- —
- Monthly cashflow
- —
- DSCR
- —
- Eligible?
- —
No personal income docs; deal must DSCR.
Hard money
10% down · 12.0% · 12mo
- Down + closing
- —
- Monthly P&I
- —
- Monthly cashflow
- —
- DSCR
- —
- Eligible?
- —
Short-term bridge; refi at stabilization.
Rent comps 31 comps
| Address | Beds | Baths | Sqft | Rent | $/sqft | DOM | Units | Dist |
|---|---|---|---|---|---|---|---|---|
| 408 E State St Unit B Baton Rouge, LA | 2.0 | 2.0 | 1258 | $1,100 | $0.87 | 43d | 1 | 0.11mi |
| 417 E State St Baton Rouge, LA | 3.0 | 1.0–2.0 | 849 | $1,202 | $1.41 | 14d | 26 | 0.13mi |
| 3101 Highland Rd Baton Rouge, LA | 2.0 | 1.0 | 955 | $1,038 | $1.09 | 14d | 2 | 0.21mi |
| 470 E McKinley St Baton Rouge, LA | 3.0 | 1.0 | 1200 | $1,185 | $0.99 | 23d | 1 | 0.41mi |
| 2273 Carolina St Baton Rouge, LA | 3.0 | 2.0 | 1244 | $1,050 | $0.84 | 43d | 1 | 0.62mi |
| 634 W Grant St Baton Rouge, LA | 3.0 | 2.0 | 1467 | $1,850 | $1.26 | 43d | 1 | 0.64mi |
| 1104 E Harrison St Unit A Baton Rouge, LA | 2.0 | 2.0 | 1100 | $975 | $0.89 | 43d | 1 | 0.77mi |
| 2030 Colorado St Baton Rouge, LA | 1.0 | 1.0 | 900 | $700 | $0.78 | 43d | 1 | 0.77mi |
| 1917 Minnesota St Unit A Baton Rouge, LA | 2.0 | 2.0 | 917 | $1,350 | $1.47 | 43d | 1 | 0.91mi |
| 1917 Minnesota St Unit A Baton Rouge, LA | 2.0 | 2.0 | 917 | $1,350 | $1.47 | 23d | 1 | 0.91mi |
| 4264 Oxford Ave Unit 3 Baton Rouge, LA | 2.0 | 1.0 | 1000 | $1,350 | $1.35 | 43d | 1 | 0.95mi |
| 4264 Oxford Ave Unit 4 Baton Rouge, LA | 2.0 | 1.0 | 1000 | $1,295 | $1.29 | 23d | 1 | 0.95mi |
| 1538 Fig St Baton Rouge, LA | 3.0 | 1.0 | 1100 | $1,100 | $1.00 | 23d | 1 | 0.97mi |
| 2539 Fiero St Baton Rouge, LA | 2.0 | 2.0 | 1752 | $2,600 | $1.48 | 43d | 1 | 0.99mi |
| 998 Stanford Ave #308 Baton Rouge, LA | 2.0 | 2.5 | 1744 | $3,000 | $1.72 | 43d | 1 | 1.06mi |
| 4464 Highland Rd Baton Rouge, LA | 2.0 | 2.0 | 1219 | $1,675 | $1.37 | 43d | 1 | 1.15mi |
| 436 Jennifer Jean Dr Baton Rouge, LA | 3.0 | 2.0 | 1100 | $1,950 | $1.77 | 14d | 1 | 1.18mi |
| 436 Jennifer Jean Dr Baton Rouge, LA | 3.0 | 2.0 | 1100 | $1,950 | $1.77 | 23d | 1 | 1.18mi |
| 1430 S 17th St Baton Rouge, LA | 3.0 | 2.0 | 1136 | $3,499 | $3.08 | 43d | 1 | 1.22mi |
| 555 Ursuline Dr Baton Rouge, LA | 2.0 | 1.5 | 1576 | $1,800 | $1.14 | 23d | 1 | 1.22mi |
| 4441 Burbank Dr Baton Rouge, LA | 3.0 | 2.0–3.0 | 1544 | $1,750 | $1.13 | 43d | 2 | 1.23mi |
| 4441 Burbank Dr #108 Baton Rouge, LA | 3.0 | 3.0 | 1500 | $1,725 | $1.15 | 23d | 1 | 1.24mi |
| 582 Jennifer Jean Dr Baton Rouge, LA | 3.0 | 2.0 | 1370 | $1,500 | $1.09 | 43d | 1 | 1.26mi |
| 1805 Perkins Rd Unit 1805 Baton Rouge, LA | 1.0 | 1.0 | 1000 | $1,500 | $1.50 | 14d | 1 | 1.27mi |
| 1327 S 17th St Baton Rouge, LA | 2.0 | 1.0 | 955 | $950 | $0.99 | 23d | 1 | 1.28mi |
| 101 Baton Rouge, LA | 1.0–2.0 | 1.0–2.0 | 803 | $1,696 | $2.11 | 14d | 28 | 1.35mi |
| 1522 Stephens Ave Unit A Baton Rouge, LA | 2.0 | 1.0 | 1302 | $1,800 | $1.38 | 23d | 1 | 1.39mi |
| 1522 Stephens Ave Unit Main House Baton Rouge, LA | 2.0 | 1.5 | 1302 | $1,800 | $1.38 | 43d | 1 | 1.39mi |
| 1133 Maximillian St Baton Rouge, LA | 3.0 | 2.0 | 1240 | $1,100 | $0.89 | 43d | 1 | 1.39mi |
| 837 E Boyd Dr Unit A Baton Rouge, LA | 2.0 | 1.5 | 1080 | $1,300 | $1.20 | 19d | 1 | 1.39mi |
| 839 E Boyd Dr Unit C Baton Rouge, LA | 2.0 | 1.5 | 1080 | $1,400 | $1.30 | 19d | 1 | 1.39mi |
HOA detail condo
- Monthly dues
- $0 · $0/yr
- Assessments
- None detected in remarks — confirm with the listing agent.
Listing history 17 events
-
2026-06-18days on market $350,000 Active 30 DOM
-
2026-06-17days on market $350,000 Active 29 DOM
-
2026-06-16days on market $350,000 Active 28 DOM
-
2026-06-15days on market $350,000 Active 27 DOM
-
2026-06-14days on market $350,000 Active 25 DOM
-
2026-06-10days on market $350,000 Active 22 DOM
-
2026-06-09days on market $350,000 Active 21 DOM
-
2026-06-08days on market $350,000 Active 20 DOM
-
2026-06-07days on market $350,000 Active 19 DOM
-
2026-06-05days on market $350,000 Active 16 DOM
-
2026-06-03days on market $350,000 Active 15 DOM
-
2026-06-02days on market $350,000 Active 14 DOM
-
2026-06-01days on market $350,000 Active 13 DOM
-
2026-05-31days on market $350,000 Active 12 DOM
-
2026-05-31days on market $350,000 Active 11 DOM
-
2026-05-14$350,000 Active
Show marketing remark (1652 chars)
Developer's Dream Near LSU - Income Now, Expansion Potential for the Future Unlock the possibilities with this exceptional Baton Rouge investment opportunity featuring two income-producing duplexes plus two additional lots in a rapidly growing corridor just minutes from Louisiana State University. Located at 204-206 E. State Street and 226 A&B State Street, 240 E State Street (lot) and a parcel in between properties, this rare multi-property package offers the perfect blend of immediate cash flow and outstanding redevelopment potential. Fully occupied and generating steady rental income, these well-maintained duplexes showcase timeless architectural charm with desirable features including 9-foot ceilings, hardwood floors, newer roofs, and individually metered utilities for streamlined management and tenant convenience. The prime location near LSU ensures continued rental demand and long-term investment stability. What truly sets this portfolio apart is the incredible opportunity for new construction and multi-unit development. The additional lots create a unique canvas for developers/investors looking to expand, build additional units, increase density, or capitalize on the area's ongoing growth and housing demand. This multi-property package is ideal for investors seeking stable cash flow, proximity to LSU, and long-term appreciation potential in the growing Baton Rouge market. All information is believed to be accurate but not guaranteed and should be independently verified by purchaser. Measurements, occupancy status, zoning, lot dimensions, and investment projections are approximate and subject to buyer verification.
-
2026-05-14$350,000 Active 1652-char remark
Show marketing remark (1652 chars)
Developer's Dream Near LSU - Income Now, Expansion Potential for the Future Unlock the possibilities with this exceptional Baton Rouge investment opportunity featuring two income-producing duplexes plus two additional lots in a rapidly growing corridor just minutes from Louisiana State University. Located at 204-206 E. State Street and 226 A&B State Street, 240 E State Street (lot) and a parcel in between properties, this rare multi-property package offers the perfect blend of immediate cash flow and outstanding redevelopment potential. Fully occupied and generating steady rental income, these well-maintained duplexes showcase timeless architectural charm with desirable features including 9-foot ceilings, hardwood floors, newer roofs, and individually metered utilities for streamlined management and tenant convenience. The prime location near LSU ensures continued rental demand and long-term investment stability. What truly sets this portfolio apart is the incredible opportunity for new construction and multi-unit development. The additional lots create a unique canvas for developers/investors looking to expand, build additional units, increase density, or capitalize on the area's ongoing growth and housing demand. This multi-property package is ideal for investors seeking stable cash flow, proximity to LSU, and long-term appreciation potential in the growing Baton Rouge market. All information is believed to be accurate but not guaranteed and should be independently verified by purchaser. Measurements, occupancy status, zoning, lot dimensions, and investment projections are approximate and subject to buyer verification.
ⓘ Source: listings_history table (triggers on properties + properties_extension) + one-shot
backfill from property_details.listing_events for pre-trigger history.
Climate risk First Street
- Flood 8/10 Severe FEMA zone AE · 99% chance over 30 yrs
- Wildfire 1/10 Low
- Heat 8/10 Severe 7 d/yr ≥108°F today · 21 d/yr by 30 yrs out
- Wind 9/10 Extreme 99% chance of damaging wind over 30 yrs
- Air quality 2/10 Low 1 unhealthy d/yr today · 1 by 30 yrs out
Nearby sold comps map
Loading sold comps map…
Walkable amenities ~0.75 mi
Loading nearby amenities…
Taxation est. · year 1
- Rental income
- $15,744
- − Mortgage interest
- −$19,605
- − Property taxes
- −$5,250
- − Insurance
- −$6,868
- − Repairs & maintenance
- −$1,260
- − Management
- −$1,260
- − Depreciation
- −$10,182
- Taxable loss
- −$28,681
- Est. tax savings @ 24.0%
- +$6,883
- After-tax cash flow
- $-14,823/yr
For passive investors: Depreciation is non-cash, so a rental often shows a tax loss while cash-flowing — sheltering income. Rental losses are passive: they offset passive income freely, and up to $25,000/yr can offset ordinary (W-2) income if you actively participate and your MAGI is under $100k (phasing out to $0 by $150k); unused losses carry forward. On sale, claimed depreciation is recaptured at up to 25%, and gains may owe capital-gains tax (a 1031 exchange can defer both). Figures are a year-1 estimate at your 24.0% rate — not tax advice; consult a CPA.
Condition & rehab AI · 5 photos
This multi-family property requires significant repairs and updates to improve its condition and value. Immediate attention to the roof, exterior, and interior is necessary to prevent further damage and enhance its appeal.
Repairs flagged
- Major roof — Signs of significant damage
- Major exterior siding — Severe peeling and damage
- Major flooring — Worn and uneven
- Major interior walls — Painted walls with visible wear
- Major windows — Old and possibly drafty
- Major HVAC/mechanicals — No visible signs of recent maintenance
Value-add opportunities
- Both Paint exterior — Enhances curb appeal and value
- Both Replace flooring — Improves living space and value
- Both Upgrade HVAC — Enhances comfort and energy efficiency
Renovation cost estimate screening
| Repair item | Severity | Est. cost |
|---|---|---|
| roof · Signs of significant damage | Major | $15,000–50,000 |
| exterior siding · Severe peeling and damage | Major | $15,000–50,000 |
| flooring · Worn and uneven | Major | $15,000–50,000 |
| interior walls · Painted walls with visible wear | Major | $15,000–50,000 |
| windows · Old and possibly drafty | Major | $15,000–50,000 |
| HVAC/mechanicals · No visible signs of recent maintenance | Major | $15,000–50,000 |
| Total estimated repair cost · 6 items | $90,000–300,000 |
Value-add ROI direction
- Both Paint exterior — Enhances curb appeal and value ↑
- Both Replace flooring — Improves living space and value ↑
- Both Upgrade HVAC — Enhances comfort and energy efficiency ↑
ⓘ Cost ranges are severity-bucket heuristics (US national rule-of-thumb). Get contractor quotes + a written scope before underwriting a rehab budget.
Schools (NCES district)
- District
- East Baton Rouge Parish
- NCES district ID
- 2200540
- Math proficiency
- 22% ▼ -36.00%
- Reading proficiency
- 34% ▼ -31.00%
- Median HH income
- $46,263
- Composite
- 24.14/100
- National rank
- #7745
- State rank
- #47 of 98 in LA
Livability — Baton Rouge
- Score
- 74/100
- State rank
- #24
- US rank
- #4535
Category grades
Schools grade is shown separately in the Schools card above.
Census & demographics
- Census place
- Baton Rouge, LA
- County
- East Baton Rouge Parish · 399,686 people
- City population
- 351,868
- Metro
- Baton Rouge, LA
- Population (ZIP)
- 25,118
- Household income
- $34,458
- Rent vs Own
- Severe rent burden
- 1831.0
Population outlook (East Baton Rouge County) Hauer SSP2
- Today (2025)
- 464,810 people
- By 2030
- 472,137 · +1.6%
- By 2040
- 480,243 · +3.3%
- By 2050
- 484,422 · +4.2%
- By 2075
- 492,069 · +5.9%
- By 2100
- 476,347 · +2.5%
Race, ethnicity, and origin ACS 2023
- Neighborhood character
- Predominantly Black (69%)
- Race & ethnicity
- Black 69% White 20% Two or more races 5% Hispanic / Latino 5% Asian 3%
- Common ancestry
- Lithuanian 2% Italian 1% Iranian 0%
- Foreign-born
- 6% · Canada, Vietnam
- Languages at home
- 91% English-only · Spanish 3% Tagalog/Filipino 1% Other Indo-European 1%
Political lean MEDSL · East Baton Rouge
- 2024 margin
- D (+11.1) · D 54.5% · R 43.4% · Other 2.1%
- 2008→2024 swing
- +8.9pp toward D · 2008: 2.2pp · 2024: 11.1pp
- All cycles
- 2024: D+11.1 2020: D+13.1 2016: D+9.2 2012: D+5.2 2008: D+2.2
Not yet ingested
- Civics
- —
Market trends
- HPI YoY
- ▼ -137.02%
- Current HPI
- 47.7285
- Rent YoY
- ▲ 6.59%
- Metro
- Baton Rouge, LA
- State GDP YoY
- ▲ 3.29%
- F500 in state
- 10
Industry mix (Fortune 500 HQ in LA)
| Industry | F500 HQs | Revenue |
|---|---|---|
| Telecommunications | 2 | $23B |
|
||
| Utilities | 1 | $12B |
|
||
| Wholesale / Distribution | 1 | $5B |
|
||
| Advertising | 1 | $2B |
|
||
Price history
+0.0% since first listed2 events — show timeline
- 2026-05-14 Listed $350,000 AcadianaMLS
- 2026-05-14 Listed $350,000 GBRMLS
Cash-flow waterfall
monthlySold comps — $/sqft
last 12 mo · ≤1 miLoading sold comps…