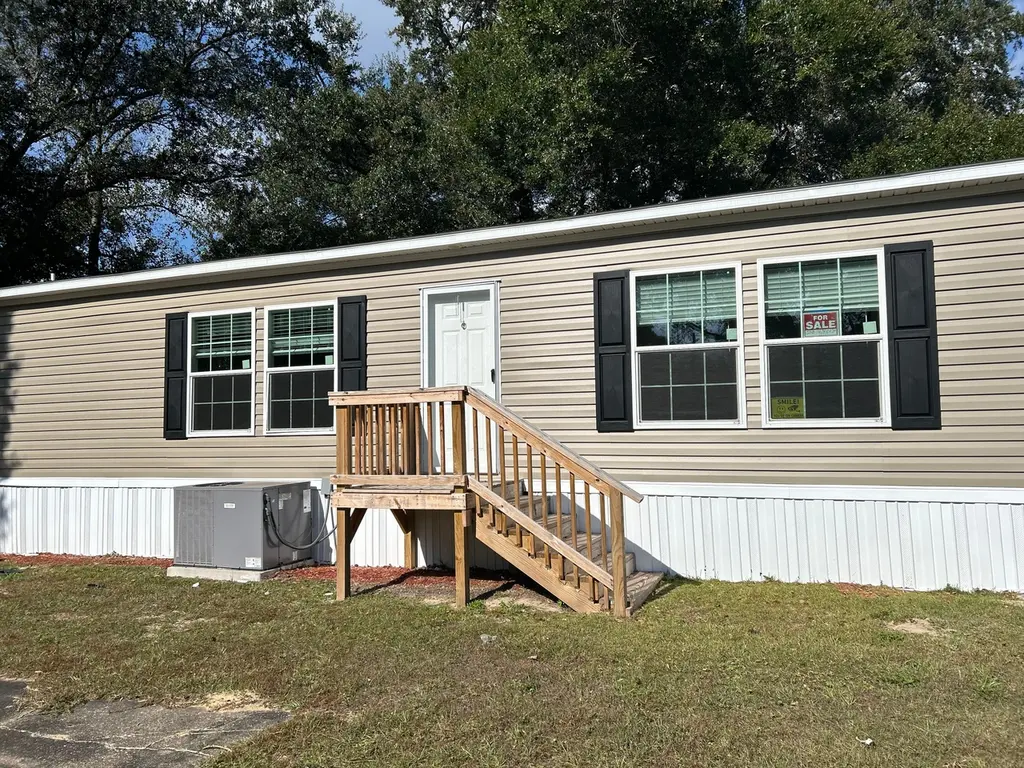
901 Massachusetts Ave · Brent, FL
Flood risk No data
- FEMA flood zone
- —
- Chance of flooding over 30 yrs
- —
- Est. flood insurance / yr
- —
Fire risk No data
- Est. fire insurance / yr
- —
Heat risk No data
- Hot days now (above threshold)
- —
- Hot days in 30 yrs
- —
Wind risk No data
- Chance of severe wind over 30 yrs
- —
Air-quality risk No data
- Unhealthy air days now
- —
- Unhealthy air days in 30 yrs
- —
Risk factors via First Street. Map © Google.
Why this score? — see what drove the B+ grade
The composite is a weighted blend of 9 inputs, each scored 0–100. Each bar is that input's sub-score; the figure is the points it added to the 100-point composite (weight × sub-score).
- Cash flow +30.0/30.0
- ARV discount +15.0/15.0
- 1% rule +10.0/10.0
- DSCR +10.0/10.0
- Rent growth +3.7/5.0
- Schools +3.6/10.0
- Livability +3.5/5.0
- Condition / age +2.5/5.0
- Appreciation +0.0/10.0
$84,900
🖨 Deal sheet (PDF) 📄 Offer letter ✓ Due diligence
Listing remarks MLS
This home boasts 3 generously sized bedrooms and 2 full bathrooms, perfect for families or anyone seeking extra space. Split Living Plan: Enjoy privacy with a thoughtfully designed layout that separates the primary suite from the additional bedrooms. Primary Suite: Features a large walk-in closet and attached bathroom for your convenience. Modern Kitchen: Equipped with stainless steel appliances, ample cabinetry, and plenty of counter space for meal prep. Laundry Room: Dedicated space for washer and dryer, adding ease to your daily routine.
Key facts
- Built 2026
- Listed 162 days
Neighborhood map
What this means for you Summary
Snapshot
- This is a 3-bed/2.0-bath single-family listed at $85k.
Deal economics
- At list price, monthly cash flow is $681 ($8k/yr) — positive.
- The deal already cash-flows at list — no discount required.
- Meets the 1% rule at list price ($2k rent vs $85k).
- Recommended offer: $75k (12.0% below list) — sets the bar for market timing.
- Cap rate 15.9% vs local median 6.6% in Brent — top-decile yield for the area; either an underpriced asset or a hidden risk that comps aren't pricing in. Stress-test before assuming the spread holds.
Location & tenants
- Location reads 69/100 on livability (#484 in FL) — a middle-class / working-renter tenant base. Strengths: cost of living A+, housing A+, health & safety A+; Watch: crime D, amenities F, commute F.
- Escambia (suburban): math 40% / reading 45% proficiency, ranked #56 of 73 in FL (top 77%) — families likely to look elsewhere, expect single-tenant / working-renter base with shorter leases.
- Market conditions: Rents rising fast (+4.9%/yr); 198 active listings in the ZIP; 17 comparable units currently listed for rent nearby; rentals at typical pace (median 24d on market — plan ~3-4 weeks tenant-placement turnaround); lower-income renter base — watch delinquency; 1,479 units permitted in Escambia County in 2024 (0 in 5+ unit buildings).
- This rent runs 43% of the median local income ($45k/yr) — at the standard rent-burdened threshold; future hikes will face affordability resistance.
Forward outlook
- Local home prices are declining (-3.0%/yr); year-one equity from $587 of loan paydown is wiped out by about $3k of value loss. Plan a longer hold.
- Escambia County population projected at +13% by 2050 — modest demand growth; plan on rents tracking national, not racing it.
- At projected returns (-3.0% appreciation + 4.9% rent growth), your $24k cash investment doubles in ~4 years — after that, you're playing with house money.
Negotiation context
- It's been on market 162 days — a 12% lower offer ($75k) is reasonable based on typical stale-listing flexibility.
- 2 sale attempts with the ask held roughly flat each time — persistent listings suggest the price (not the market) is what's stuck; bring a comps-based counter.
Questions for the listing agent
- It's been on market 162 days. Have you received any prior offers? Is the seller open to a 12% concession, seller financing, or rate buy-down credit?
- Why hasn't it sold? Are there any deal-killer items the seller is aware of (foundation, flood, title, zoning, code violations)?
- Is there a deadline driving the sale (1031 exchange, divorce, estate, relocation)? That informs how much negotiation room exists.
- Crime grade is D in this area — have there been break-ins, vandalism, or insurance claims at this property in the last 3 years? What carrier currently insures it and at what premium?
- What's the average days-on-market for RENTAL listings here right now (not sales)? A rising rental-DOM trend means longer vacancies and softer asking-rent achievability than the comps imply.
- What's the recent tenant-quality profile in this submarket — average credit score on applications, eviction rate, late-payment / NSF rate, and stable-employment percentage? A property-management company in the area should have these aggregated.
- How much new for-sale + rental construction is in the pipeline within 1–3 miles? Heavy new supply typically softens prices + rents 12–24 months out; constrained supply supports both.
Investment metrics
- 1% rule
- 1.89% ✓
- Cap rate
- 15.92%
- Cash-on-cash
- 34.40%
- DSCR
- 2.53
- GRM
- 4.4
CMA / ARV
- ARV (median comp)
- $145,996
- List price
- $84,900
- Delta
- -41.85%
- Verdict
- UNDERPRICED
- Comps
- 20 within 1.0 mi
Show comp detail 12 sales within ~0.75 mi
| Address | Dist | Beds/Ba | Sqft | Sold | Price | $/sf | Match |
|---|---|---|---|---|---|---|---|
| 4404 Ellysee Way | 0.26mi | 3/2.0 | 1,435 (-1%) | 2mo | $239,900 | $167 | 84 |
| 4260 Erress Blvd | 0.17mi | 3/2.0 | 1,325 (-9%) | 6mo | $140,000 | $106 | 72 |
| 4482 Rochelle Dr | 0.36mi | 4/2.0 (+1) | 1,524 (+5%) | 2mo | $89,000 | $58 | 69 |
| 1231 Ft Smith Cir | 0.22mi | 3/2.0 | 1,274 (-12%) | 3mo | $219,000 | $172 | 67 |
| 4517 Monpellier Dr | 0.46mi | 3/2.0 | 1,357 (-7%) | 7mo | $198,000 | $146 | 62 |
| 812 Montclair Rd | 0.68mi | 3/2.0 | 1,433 (-2%) | 6mo | $192,000 | $134 | 60 |
| 4512 Havre Way | 0.57mi | 3/2.0 | 1,380 (-5%) | 8mo | $72,800 | $53 | 58 |
| 4511 St Nazaire Rd | 0.60mi | 4/2.0 (+1) | 1,508 (+4%) | 4mo | $130,000 | $86 | 58 |
| 4505 Ellysee Way | 0.49mi | 3/2.0 | 1,279 (-12%) | 4mo | $182,500 | $143 | 54 |
| 3258 Peagler Plaza Rd | 0.56mi | 3/2.0 | 1,310 (-10%) | 5mo | $164,000 | $125 | 53 |
| 702 Loire Way | 0.62mi | 3/1.0 | 1,297 (-11%) | 3mo | $100,000 | $77 | 47 |
| 4514 Florelle Way | 0.56mi | 4/2.0 (+1) | 1,650 (+13%) | 7mo | $180,000 | $109 | 41 |
Match score weights: distance 35% · size 25% · config 20% · recency 20%. Top-matched comps best support the ARV.
Projected returns pro-forma
-3.0% appreciation · 4.92% rent growth · sell at horizon
- IRR
- 32.0%
- Equity multiple
- 2.38×
- Total profit
- $32,824
- Equity at exit
- $12,659
- IRR
- 40.1%
- Equity multiple
- 5.12×
- Total profit
- $98,048
- Equity at exit
- $7,341
Cash invested: $23,772 (down + closing). Projections, not guarantees.
Landlord ↔ Tenant lean methodology
- Overall (STATE)
- 87 Strongly Landlord-Friendly
- State Florida
- 87 Strongly Landlord-Friendly · R+3
- County
- — inherits STATE
- City
- — inherits STATE
ZIP-level market 32505
- Home prices YoY
- -26.5%
- Rents YoY
- 4.9%
- Active inventory
- 198
- Price-to-rent
- 4.4×
Monthly cashflow live
- Estimated rent
- $1,605 high interval (Pro) →
- Mortgage (P&I)
- −$445
- Tax est. 1.5%
- −$106 /mo · $1,274/yr
- Insurance
- −$35
- HOA
- −$0
- Vacancy / Maint / Mgmt
- −$337
- Net cashflow
- $681
Break-even live
Sensitivity live
| Price | -10% $740 | -5% $711 | +0% $681 | +5% $652 | +10% $623 |
|---|---|---|---|---|---|
| Rent | -10% $555 | -5% $618 | +0% $681 | +5% $745 | +10% $808 |
| Rate | -1.0pp $724 | -0.5pp $703 | base $681 | +0.5pp $659 | +1.0pp $637 |
UW: 25.0% down · 7.5% · 30yr · 1.5% tax · 5.0% vac · 8.0% maint · 8.0% mgmt
Financing live
Cash to close
- Down payment
- $21,225
- Closing costs
- $2,547
- Reserves months
- —
- Total cash needed
- —
Loan-product check · same deal, 3 products live
Conventional
25% down · 7.5% · 30yr
- Down + closing
- —
- Monthly P&I
- —
- Monthly cashflow
- —
- DSCR
- —
- Eligible?
- —
Personal DTI + credit; lowest rate.
DSCR
20% down · 8.5% · 30yr
- Down + closing
- —
- Monthly P&I
- —
- Monthly cashflow
- —
- DSCR
- —
- Eligible?
- —
No personal income docs; deal must DSCR.
Hard money
10% down · 12.0% · 12mo
- Down + closing
- —
- Monthly P&I
- —
- Monthly cashflow
- —
- DSCR
- —
- Eligible?
- —
Short-term bridge; refi at stabilization.
Rent comps 17 comps
| Address | Beds | Baths | Sqft | Rent | $/sqft | DOM | Units | Dist |
|---|---|---|---|---|---|---|---|---|
| 3417 W Fisher St Unit C Pensacola, FL | 3.0 | 2.0 | 1106 | $1,350 | $1.22 | 24d | 1 | 0.68mi |
| 918 Montclair Rd Pensacola, FL | 3.0 | 1.0 | 1012 | $1,500 | $1.48 | 14d | 1 | 0.71mi |
| 918 Fremont Ave Pensacola, FL | 3.0 | 1.0 | 1756 | $1,450 | $0.83 | 14d | 1 | 0.76mi |
| 3418 Luke St Pensacola, FL | 4.0 | 2.0 | 1620 | $1,800 | $1.11 | 24d | 1 | 0.78mi |
| 707 New York Dr Pensacola, FL | 2.0 | 1.0 | 1266 | $1,185 | $0.94 | 24d | 1 | 0.88mi |
| 902 Lucerne Ave Pensacola, FL | 3.0 | 2.0 | 1276 | $1,600 | $1.25 | 24d | 1 | 0.89mi |
| 5180 Burlington Ave Pensacola, FL | 3.0 | 2.0 | 1184 | $1,650 | $1.39 | 24d | 1 | 0.91mi |
| 2301 W Michigan Ave #21 Pensacola, FL | 2.0 | 2.5 | 1164 | $1,325 | $1.14 | 24d | 1 | 1.10mi |
| 2303 W Michigan Ave Unit A6 Pensacola, FL | 2.0 | 2.0 | 1014 | $1,300 | $1.28 | 24d | 1 | 1.13mi |
| 5602 W Shore Dr Unit B Pensacola, FL | 2.0 | 2.0 | 920 | $1,250 | $1.36 | 24d | 1 | 1.22mi |
| 221 Edison Dr Pensacola, FL | 3.0 | 1.0 | 1500 | $1,598 | $1.07 | 24d | 1 | 1.22mi |
| 925 Twinbrook Ave Pensacola, FL | 3.0 | 1.0 | 1105 | $1,750 | $1.58 | 24d | 1 | 1.30mi |
| 3296 Two Sisters Way Pensacola, FL | 4.0 | 2.5 | 1856 | $1,795 | $0.97 | 24d | 1 | 1.31mi |
| 2300 W Michigan Ave #12 Pensacola, FL | 2.0 | 2.0 | 1050 | $1,300 | $1.24 | 24d | 1 | 1.39mi |
| 3216 Two Sisters Way Pensacola, FL | 3.0 | 2.0 | 1117 | $1,700 | $1.52 | 24d | 1 | 1.41mi |
| 2108 W Bobe St Pensacola, FL | 4.0 | 2.0 | 1752 | $2,100 | $1.20 | 24d | 1 | 1.42mi |
| 2355 W Michigan Ave Pensacola, FL | 1.0–2.0 | 1.0–2.0 | 850 | $1,450 | $1.71 | 14d | 9 | 1.44mi |
Listing history 20 events
-
2026-06-18days on market $84,900 Active 162 DOM
-
2026-06-17days on market $84,900 Active 161 DOM
-
2026-06-16days on market $84,900 Active 160 DOM
-
2026-06-15days on market $84,900 Active 159 DOM
-
2026-06-14days on market $84,900 Active 157 DOM
-
2026-06-10days on market $84,900 Active 154 DOM
-
2026-06-09days on market $84,900 Active 153 DOM
-
2026-06-08days on market $84,900 Active 152 DOM
-
2026-06-07days on market $84,900 Active 151 DOM
-
2026-06-03days on market $84,900 Active 147 DOM
-
2026-06-02days on market $84,900 Active 146 DOM
-
2026-06-01days on market $84,900 Active 145 DOM
-
2026-05-31days on market $84,900 Active 144 DOM
-
2026-01-08$84,900 Active 546-char remark
Show marketing remark (546 chars)
This home boasts 3 generously sized bedrooms and 2 full bathrooms, perfect for families or anyone seeking extra space. Split Living Plan: Enjoy privacy with a thoughtfully designed layout that separates the primary suite from the additional bedrooms. Primary Suite: Features a large walk-in closet and attached bathroom for your convenience. Modern Kitchen: Equipped with stainless steel appliances, ample cabinetry, and plenty of counter space for meal prep. Laundry Room: Dedicated space for washer and dryer, adding ease to your daily routine.
-
2025-12-19$62,900 Active 537-char remark
Show marketing remark (537 chars)
Oakstead is an all-age, pet-friendly community designed for comfort and convenience. Located near shopping, dining, and top-rated schools, it offers easy access to everyday essentials. The neighborhood includes a playground and basketball courts, providing space for recreation and connection. Whether you're raising a family or simply looking for a welcoming place to live, Oakstead offers a relaxed environment where neighbors get to know each other. Interested in learning more? Contact us today to explore what Oakstead has to offer.
-
2005-10-28soldstatus $2,800,000
-
2002-10-09soldstatus $1,650,000
-
2002-05-23soldstatus $148,950
-
1995-05-08soldstatus $865,000
-
1992-07-01soldstatus $400,000
ⓘ Source: listings_history table (triggers on properties + properties_extension) + one-shot
backfill from property_details.listing_events for pre-trigger history.
Nearby sold comps map
Loading sold comps map…
Walkable amenities ~0.75 mi
Loading nearby amenities…
Taxation est. · year 1
- Rental income
- $19,262
- − Mortgage interest
- −$4,756
- − Property taxes
- −$1,274
- − Insurance
- −$424
- − Repairs & maintenance
- −$1,541
- − Management
- −$1,541
- − Depreciation
- −$2,470
- Taxable income
- $7,257
- Est. tax owed @ 24.0%
- −$1,742
- After-tax cash flow
- $6,435/yr
For passive investors: Depreciation is non-cash, so a rental often shows a tax loss while cash-flowing — sheltering income. Rental losses are passive: they offset passive income freely, and up to $25,000/yr can offset ordinary (W-2) income if you actively participate and your MAGI is under $100k (phasing out to $0 by $150k); unused losses carry forward. On sale, claimed depreciation is recaptured at up to 25%, and gains may owe capital-gains tax (a 1031 exchange can defer both). Figures are a year-1 estimate at your 24.0% rate — not tax advice; consult a CPA.
Schools (NCES district)
- District
- Escambia
- NCES district ID
- 1200510
- Math proficiency
- 40% ▼ -9.00%
- Reading proficiency
- 45% ▼ -4.00%
- Median HH income
- $44,649
- Composite
- 36.04/100
- National rank
- #4773
- State rank
- #56 of 73 in FL
Livability — Brent
- Score
- 69/100
- State rank
- #484
- US rank
- #8921
Category grades
Schools grade is shown separately in the Schools card above.
Census & demographics
- Census place
- Brent, FL
- County
- Escambia County · 301,722 people
- City population
- 27,543
- Metro
- Pensacola-Ferry Pass-Brent, FL
- Population (ZIP)
- 27,877
- Household income
- $44,783
- Rent vs Own
- Severe rent burden
- 1458.0
Population outlook (Escambia County) Hauer SSP2
- Today (2025)
- 334,637 people
- By 2030
- 345,779 · +3.3%
- By 2040
- 364,828 · +9.0%
- By 2050
- 378,514 · +13.1%
- By 2075
- 403,220 · +20.5%
- By 2100
- 386,125 · +15.4%
Race, ethnicity, and origin ACS 2023
- Neighborhood character
- Diverse neighborhood (Simpson 0.66)
- Race & ethnicity
- Black 48% White 32% Hispanic / Latino 11% Two or more races 9% Asian 2%
- Hispanic origin (detail)
- Mexican 5% Cuban 2%
- Common ancestry
- Slovak 2% Italian 1% Serbian 1%
- Foreign-born
- 9% · Canada, Vietnam
- Languages at home
- 87% English-only · Spanish 9% Other Indo-European 1% Vietnamese 1%
Political lean MEDSL · Escambia
- 2024 margin
- R (+19.5) · D 39.7% · R 59.2% · Other 1.1%
- 2008→2024 swing
- -0.2pp no change · 2008: -19.3pp · 2024: -19.5pp
- All cycles
- 2024: R+19.5 2020: R+15.1 2016: R+20.6 2012: R+20.6 2008: R+19.3
Not yet ingested
- Civics
- —
Market trends
- HPI YoY
- ▼ -74.10%
- Current HPI
- 205.45
- Rent YoY
- ▲ 4.92%
- Metro
- Pensacola-Ferry Pass-Brent, FL
- State GDP YoY
- ▲ 3.28%
- F500 in state
- 36
Industry mix (Fortune 500 HQ in FL)
| Industry | F500 HQs | Revenue |
|---|---|---|
| Industrial Technology | 2 | $29B |
|
||
| Insurance | 2 | $17B |
|
||
| Retail | 1 | $60B |
|
||
| Technology Distribution | 1 | $58B |
|
||
| Homebuilding | 1 | $35B |
|
||
| Technology Manufacturing | 1 | $35B |
|
||
Price history
-78.8% since first listed7 events — show timeline
- 2026-01-08 Listed $84,900 Zillow
- 2025-12-19 Listed $62,900 Zillow
- 2005-10-28 Sold (Public Records) $2,800,000 Public Records
- 2002-10-09 Sold (Public Records) $1,650,000 Public Records
- 2002-05-23 Sold (Public Records) $148,950 Public Records
- 1995-05-08 Sold (Public Records) $865,000 Public Records
- 1992-07-01 Sold (Public Records) $400,000 Public Records
Property tax history
+9.8%/yrLatest (2025): $58,227 · +37.5% YoY. Source: county tax records.
Cash-flow waterfall
monthlySold comps — $/sqft
last 12 mo · ≤1 miLoading sold comps…