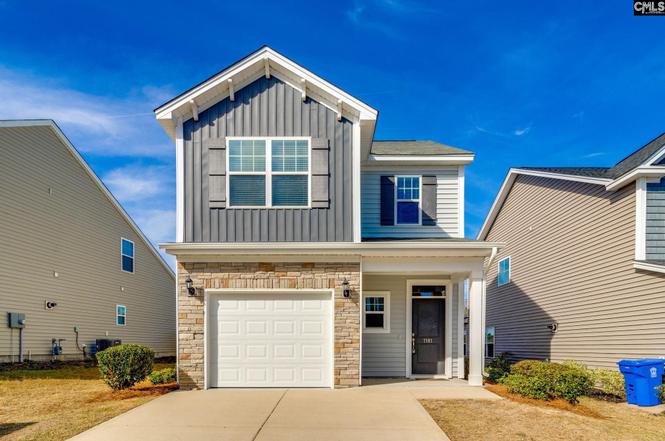
1181 Coopers Ridge Ln · Columbia, SC
Flood risk 1/10 · Minimal
- FEMA flood zone
- X (unshaded)
- Chance of flooding over 30 yrs
- 0.0%
- Est. flood insurance / yr
- $507 – $1,088
Fire risk 4/10 · Minor
- Est. fire insurance / yr
- $783 – $1,453
Heat risk 7/10 · Major
- Hot days now (above 107°F)
- 7 days/yr
- Hot days in 30 yrs
- 17 days/yr
Wind risk 6/10 · Moderate
- Chance of severe wind over 30 yrs
- 68.0%
Air-quality risk 3/10 · Minor
- Unhealthy air days now
- 2 days/yr
- Unhealthy air days in 30 yrs
- 3 days/yr
Risk factors via First Street. Map © Google.
Why this score? — see what drove the D- grade
The composite is a weighted blend of 9 inputs, each scored 0–100. Each bar is that input's sub-score; the figure is the points it added to the 100-point composite (weight × sub-score).
- Cash flow +11.3/30.0
- ARV discount +7.5/15.0
- Livability +3.9/5.0
- Schools +3.6/10.0
- 1% rule +3.5/10.0
- DSCR +3.3/10.0
- Rent growth +3.2/5.0
- Condition / age +2.5/5.0
- Appreciation +0.0/10.0
$250,000
🖨 Deal sheet 📄 Offer letter ✓ Due diligence
Listing remarks
Welcome to this beautiful home. Perfect as a starter property or for those looking to downsize. The first level features stunning luxury vinyl plank flooring throughout. Enjoy a spacious great room with a cozy fireplace, and a kitchen equipped with upgraded cabinets and granite countertops. The owner’s suite offers a tray ceiling, walk-in closet, and an ensuite bathroom complete with a double vanity, garden tub, and separate shower. All secondary bedrooms are well-sized with ample closet space. Outside, you’ll find a fenced backyard and patio, ideal for BBQs, children, or pets. Located in the award-winning Richland 2 School District with convenient access to Interstates 20 and 7
Key facts
- Walk-in closet
- Great room
- Cozy fireplace
Tags
Property features AI
Finance
- HOA & community: Homeowners association present
Exterior
- Parking: Attached 1-car garage
- Utilities: Public water; Public sewer
- Home design: Two-story home
- Construction: Vinyl exterior; Slab foundation
- Exterior features: Rear wood fencing; Patio; Paved road access
Interior
- Kitchen: Pantry; Granite countertops; Luxury vinyl plank flooring in kitchen
- Bedrooms: Master suite with garden tub, separate shower, tray ceilings and carpeted floors (second floor); Second bedroom with carpeted floors (second floor); Third bedroom with carpeted floors (second floor)
- Flooring: Carpet in bedrooms; Luxury vinyl plank in great room and kitchen
- Bathrooms: Two full bathrooms; One half bathroom; Two second full bathrooms
- Heating & cooling: Central heating; Central cooling
- Interior features: Fireplace in great room; Free-standing range; Pantry; Granite countertops
- Laundry & utility: Laundry closet
Neighborhood map
What this means for you Summary
Snapshot
- This is a 3-bed/2.5-bath single-family listed at $250k.
Deal economics
- At list price, monthly cash flow is $-94 ($-1k/yr) — negative.
- To cash-flow at today's rent, offer at most $236k (5.4% below list).
- To meet the 1% rule (rent ≥ 1% of price), the offer needs to be $213k (14.7% below list).
- Recommended offer: $213k (14.7% below list) — sets the bar for 1% rule.
Location & tenants
- Location reads 78/100 on livability (#18 in SC, #2,436 nationally) — a middle-class / working-renter tenant base. Strengths: amenities A+, commute A+, cost of living A+; Watch: employment D, crime F.
- Richland 02 (suburban): math 35% / reading 47% proficiency, ranked #29 of 80 in SC (top 36%) — families likely to look elsewhere, expect single-tenant / working-renter base with shorter leases.
- Zoned schools: Pontiac Elementary (math 39% / reading 35%, grade F, #315 of 597 statewide, top 55%, 724 students, 68% FRL); Spring Valley High (math 53% / reading 92%, grade B+, #46 of 196 statewide, top 24%, 2,187 students, 49% FRL) — zoned schools average 58% FRL vs 38% district-wide (20 pts higher); higher-poverty schools than district average — tighter screening recommended.
- Zoned-school proficiency averages 55% at this address vs 41% district-wide (+14 pts) — the actual schools serving this property are materially stronger than the Richland 02 average implies; a family-tenant draw the district grade alone would hide.
- Market conditions: Rents rising (+2.7%/yr); 334 active listings in the ZIP; 7 comparable units currently listed for rent nearby; rentals leasing fast (median 3d on market — plan ~1-2 weeks tenant-placement turnaround); solid renter incomes; 3,472 units permitted in Richland County in 2024 (1,096 in 5+ unit buildings).
Forward outlook
- Local home prices are declining (-3.0%/yr); year-one equity from $2k of loan paydown is wiped out by about $8k of value loss. Plan a longer hold.
- Richland County population projected at +30% by 2050 — long-run rental-demand tailwind backs the buy-and-hold thesis.
Negotiation context
- Only 3 days on market — expect competitive offers; lowballing is unlikely to land.
- 6 sale attempts since 4y ago; this cycle's ask has dropped $15k (6%) from the opening price — seller is motivated, your offer sets the floor, not the list.
Risks & watch-outs
- Climate carrying-cost: major wind risk, 68% chance of damaging wind over 30y; extreme-heat days projected 7→17/yr by 2055 (HVAC capex compounding) — expect insurance premiums to compound above CPI over the hold.
Questions for the listing agent
- What do current leases actually rent for vs. the listed asking? Can we see a recent rent roll and the last 12 months of T-12 income?
- What does the HOA fee cover, when was the last increase, and are there any pending special assessments or reserve-fund shortfalls?
- Is there a deadline driving the sale (1031 exchange, divorce, estate, relocation)? That informs how much negotiation room exists.
- Schools are D-rated, which usually means shorter tenancies and higher turnover. Who's the typical renter profile here, and what's been the actual vacancy rate?
- Crime grade is F in this area — have there been break-ins, vandalism, or insurance claims at this property in the last 3 years? What carrier currently insures it and at what premium?
- The area grade is low — what's the realistic commute time and amenity access for the typical tenant pool here? Any planned neighborhood developments (good or bad) we should know about?
- What's the average days-on-market for RENTAL listings here right now (not sales)? A rising rental-DOM trend means longer vacancies and softer asking-rent achievability than the comps imply.
- What's the recent tenant-quality profile in this submarket — average credit score on applications, eviction rate, late-payment / NSF rate, and stable-employment percentage? A property-management company in the area should have these aggregated.
- How much new for-sale + rental construction is in the pipeline within 1–3 miles? Heavy new supply typically softens prices + rents 12–24 months out; constrained supply supports both.
Investment metrics
- 1% rule
- 0.85% ✗
- Cap rate
- 5.84%
- Cash-on-cash
- -1.60%
- DSCR
- 0.93
- GRM
- 9.8
CMA / ARV
No comps found within radius.
Projected returns pro-forma
-3.0% appreciation · 2.7% rent growth · sell at horizon
- IRR
- -19.3%
- Equity multiple
- 0.33×
- Total profit
- $-47,051
- Equity at exit
- $37,276
- IRR
- -12.5%
- Equity multiple
- 0.27×
- Total profit
- $-51,008
- Equity at exit
- $21,615
Cash invested: $70,000 (down + closing). Projections, not guarantees.
Landlord ↔ Tenant lean methodology
- Overall (STATE)
- 90 Strongly Landlord-Friendly
- State South Carolina
- 90 Strongly Landlord-Friendly · R+6
- County
- — inherits STATE
- City
- — inherits STATE
ZIP-level market 29045
- Home prices YoY
- -17.9%
- Rents YoY
- 2.7%
- Active inventory
- 334
- Price-to-rent
- 9.8×
Monthly cashflow live
- Estimated rent
- $2,132 high interval (Pro) →
- Mortgage (P&I)
- −$1,311
- Tax est. 1.5%
- −$312 /mo · $3,750/yr
- Insurance
- −$104
- HOA
- −$50
- Vacancy / Maint / Mgmt
- −$448
- Net cashflow
- $-94
Break-even live
UW: 25.0% down · 7.5% · 30yr · 1.5% tax · 5.0% vac · 8.0% maint · 8.0% mgmt
Financing live
Cash to close
- Down payment
- $62,500
- Closing costs
- $7,500
- Reserves months
- —
- Total cash needed
- —
Loan-product check · same deal, 3 products live
Conventional
25% down · 7.5% · 30yr
- Down + closing
- —
- Monthly P&I
- —
- Monthly cashflow
- —
- DSCR
- —
- Eligible?
- —
Personal DTI + credit; lowest rate.
DSCR
20% down · 8.5% · 30yr
- Down + closing
- —
- Monthly P&I
- —
- Monthly cashflow
- —
- DSCR
- —
- Eligible?
- —
No personal income docs; deal must DSCR.
Hard money
10% down · 12.0% · 12mo
- Down + closing
- —
- Monthly P&I
- —
- Monthly cashflow
- —
- DSCR
- —
- Eligible?
- —
Short-term bridge; refi at stabilization.
Rent comps 7 comps
| Address | Beds | Baths | Sqft | Rent | $/sqft | DOM | Units | Dist |
|---|---|---|---|---|---|---|---|---|
| 1315 Montford Dr Elgin, SC | 4.0 | 3.0 | 1959 | $2,300 | $1.17 | 14d | 1 | 0.32mi |
| 1074 Cornelia St Elgin, SC | 3.0 | 2.5 | 1432 | $1,995 | $1.39 | 3d | 1 | 0.34mi |
| 1037 Astoria DR Columbia, SC | 3.0 | 2.5 | 1363 | $1,900 | $1.39 | 3d | 1 | 0.82mi |
| 837 Peony LN Columbia, SC | 3.0 | 2.5 | 1996 | $2,500 | $1.25 | 21d | 1 | 0.93mi |
| 225 Bails Rd Elgin, SC | 3.0 | 2.0 | 2176 | $2,350 | $1.08 | 2d | 1 | 1.10mi |
| 325 Spears Creek Church Rd Elgin, SC | 1.0–2.0 | 1.0–2.0 | 1038 | $1,460 | $1.41 | 3d | 5 | 1.22mi |
| 1102 Semoran Way Columbia, SC | 3.0–4.0 | 2.5 | 1488 | $1,730 | $1.16 | 2d | 16 | 1.42mi |
HOA detail
- Monthly dues
- $50 · $600/yr
Listing history 16 events
-
2026-06-18days on market $250,000 Active 3 DOM
-
2026-06-17days on market $250,000 Active 2 DOM
-
2026-06-15pricedays on market $250,000 Active 1 DOM
-
2026-05-09status Active
-
2026-05-04status Pending
-
2026-03-30price $253,500
-
2026-01-18price $259,900
-
2025-11-30$265,000 Active
-
2024-04-26historical $2,100
-
2024-04-10$2,100
-
2024-04-10historical $2,100
-
2024-04-05price $2,100
-
2024-03-13$2,250
-
2024-01-21$265,000 Active
-
2022-03-28historical
-
2022-03-25$255,000 Active
ⓘ Source: listings_history table (triggers on properties + properties_extension) + one-shot
backfill from property_details.listing_events for pre-trigger history.
Climate risk First Street
- Flood 1/10 Low FEMA zone X (unshaded) · 0% chance over 30 yrs
- Wildfire 4/10 Moderate
- Heat 7/10 Severe 7 d/yr ≥107°F today · 17 d/yr by 30 yrs out
- Wind 6/10 Major 68% chance of damaging wind over 30 yrs
- Air quality 3/10 Moderate 2 unhealthy d/yr today · 3 by 30 yrs out
Nearby sold comps map
Loading sold comps map…
Walkable amenities ~0.75 mi
Loading nearby amenities…
Taxation est. · year 1
- Rental income
- $25,581
- − Mortgage interest
- −$14,004
- − Property taxes
- −$3,750
- − Insurance
- −$1,250
- − Repairs & maintenance
- −$2,046
- − Management
- −$2,046
- − HOA
- −$600
- − Depreciation
- −$7,273
- Taxable loss
- −$5,388
- Est. tax savings @ 24.0%
- +$1,293
- After-tax cash flow
- $170/yr
For passive investors: Depreciation is non-cash, so a rental often shows a tax loss while cash-flowing — sheltering income. Rental losses are passive: they offset passive income freely, and up to $25,000/yr can offset ordinary (W-2) income if you actively participate and your MAGI is under $100k (phasing out to $0 by $150k); unused losses carry forward. On sale, claimed depreciation is recaptured at up to 25%, and gains may owe capital-gains tax (a 1031 exchange can defer both). Figures are a year-1 estimate at your 24.0% rate — not tax advice; consult a CPA.
Schools (NCES district)
- District
- Richland 02
- NCES district ID
- 4503390
- Math proficiency
- 35% ▼ -15.00%
- Reading proficiency
- 47% ▼ -5.00%
- Median HH income
- $59,684
- Composite
- 36.2/100
- National rank
- #4730
- State rank
- #29 of 80 in SC
Livability — Columbia
- Score
- 78/100
- State rank
- #18
- US rank
- #2436
Category grades
Schools grade is shown separately in the Schools card above.
Census & demographics
- Census place
- Columbia, SC
- County
- Kershaw County · 47,655 people
- City population
- 335,994
- Metro
- Columbia, SC
- Population (ZIP)
- 31,372
- Household income
- $87,366
- Rent vs Own
- Severe rent burden
- 204.0
Population outlook (Richland County) Hauer SSP2
- Today (2025)
- 459,667 people
- By 2030
- 487,524 · +6.1%
- By 2040
- 542,035 · +17.9%
- By 2050
- 595,371 · +29.5%
- By 2075
- 732,998 · +59.5%
- By 2100
- 820,415 · +78.5%
Race, ethnicity, and origin ACS 2023
- Neighborhood character
- Diverse neighborhood (Simpson 0.62)
- Race & ethnicity
- White 53% Black 31% Hispanic / Latino 9% Two or more races 5% Asian 3%
- Hispanic origin (detail)
- Mexican 5% Puerto Rican 2%
- Common ancestry
- Serbian 1% Slovak 1% Lithuanian 1%
- Foreign-born
- 7% · Canada, South Korea
- Languages at home
- 90% English-only · Spanish 6% Other Indo-European 1% Korean 1%
Political lean MEDSL · Richland
- 2024 margin
- Solid D (+34.6) · D 66.4% · R 31.8% · Other 1.8%
- 2008→2024 swing
- +5.7pp toward D · 2008: 28.9pp · 2024: 34.6pp
- All cycles
- 2024: D+34.6 2020: D+38.3 2016: D+32.9 2012: D+33.3 2008: D+28.9
Not yet ingested
- Civics
- —
Market trends
- HPI YoY
- ▼ -45.60%
- Current HPI
- 209.2469
- Rent YoY
- ▲ 2.70%
- Metro
- Columbia, SC
- State GDP YoY
- ▲ 4.51%
- F500 in state
- 2
Industry mix (Fortune 500 HQ in SC)
| Industry | F500 HQs | Revenue |
|---|---|---|
| Packaging | 1 | $7B |
|
||
Price history
-0.6% since first listed13 events — show timeline
- 2026-05-09 Relisted — Consolidated MLS
- 2026-05-04 Pending — Consolidated MLS
- 2026-03-30 Price Changed $253,500 Consolidated MLS
- 2026-01-18 Price Changed $259,900 Consolidated MLS
- 2025-11-30 Listed $265,000 Consolidated MLS
- 2024-04-26 Rental Removed $2,100 APPFOLIO
- 2024-04-10 Listed for Rent $2,100 APPFOLIO
- 2024-04-10 Rental Removed $2,100 APPFOLIO
- 2024-04-05 Price Changed $2,100 APPFOLIO
- 2024-03-13 Listed for Rent $2,250 APPFOLIO
- 2024-01-21 Listed $265,000 Consolidated MLS
- 2022-03-28 Delisted — Consolidated MLS
- 2022-03-25 Listed $255,000 Consolidated MLS
Cash-flow waterfall
monthlySold comps — $/sqft
last 12 mo · ≤1 miLoading sold comps…