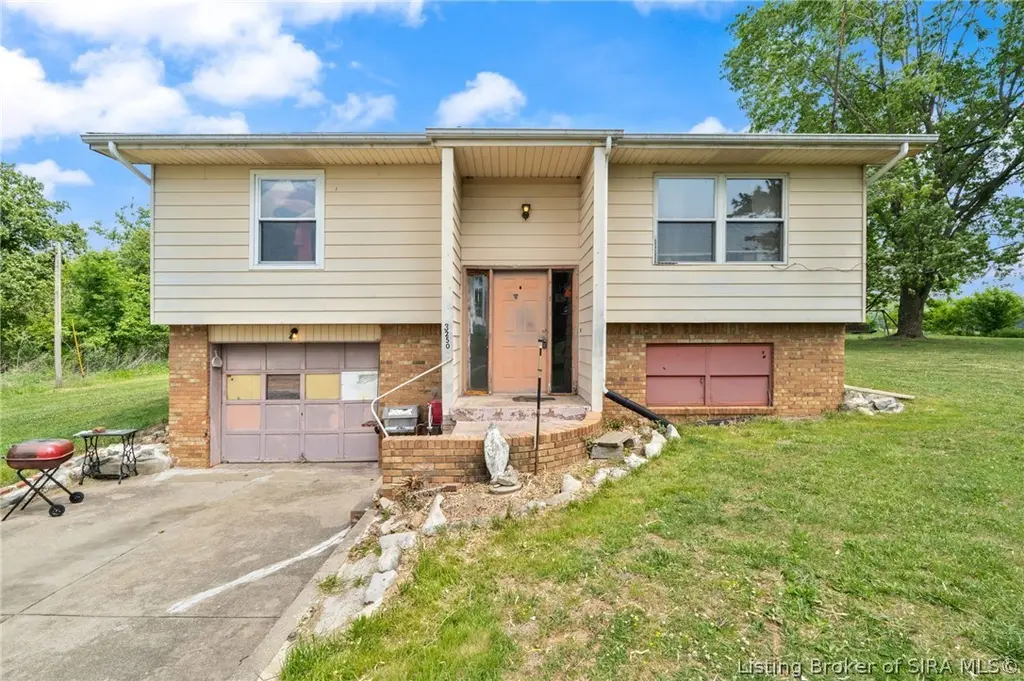
3250 Heth-washington Rd · Mauckport, IN
Flood risk 1/10 · Minimal
- FEMA flood zone
- X (unshaded)
- Chance of flooding over 30 yrs
- 0.0%
- Est. flood insurance / yr
- $473 – $860
Fire risk 3/10 · Minor
- Est. fire insurance / yr
- $717 – $1,331
Heat risk 4/10 · Minor
- Hot days now (above 104°F)
- 7 days/yr
- Hot days in 30 yrs
- 19 days/yr
Wind risk 3/10 · Minor
- Chance of severe wind over 30 yrs
- 6.0%
Air-quality risk 2/10 · Minimal
- Unhealthy air days now
- 1 days/yr
- Unhealthy air days in 30 yrs
- 2 days/yr
Risk factors via First Street. Map © Google.
Why this score? — see what drove the D+ grade
The composite is a weighted blend of 9 inputs, each scored 0–100. Each bar is that input's sub-score; the figure is the points it added to the 100-point composite (weight × sub-score).
- ARV discount +15.0/15.0
- Cash flow +9.3/30.0
- Appreciation +8.1/10.0
- Schools +3.9/10.0
- DSCR +2.6/10.0
- Rent growth +2.5/5.0
- Condition / age +2.5/5.0
- Livability +2.2/5.0
- 1% rule +1.5/10.0
$187,000
🖨 Deal sheet 📄 Offer letter ✓ Due diligence
Listing remarks
LOCATION IS EVERYTHING! Wonderfully located 3 bedroom, 1 bathroom home situated on 2 peaceful acres with a large yard and plenty of space to enjoy! This property sits off the road offering added privacy and a quiet setting. Home does need TLC, making it a great opportunity for investors, flippers, or buyers looking to add their own personal touch. Conveniently located just 2 minutes from Heth Washington Elementary School, Dollar General, and Longbottom & Hardsaw’s Hardware. Easy commute with only 16 minutes to I-64/Corydon, 15 minutes to Kroger in Brandenburg, KY, and 34 minutes to Fort Knox. Great location with country feel and everyday conveniences nearby! This home is only av
Key facts
- Added privacy
- Large yard
- Quiet setting
Tags
Property features AI
Exterior
- Parking: Attached 1-car garage
- Utilities: Public water connection; Septic tank
- Home design: Residential property
- Construction: Vinyl siding with frame construction; Shingle roof; Slab foundation; Built on 2-acre lot
- Exterior features: Shed(s); Paved road access; Has view
Interior
- Kitchen: Oven; Range; Refrigerator
- Bedrooms: Two bedrooms on the first floor
- Bathrooms: Two full bathrooms
- Interior features: Primary bedroom with private bath; Walk-out basement
- Laundry & utility: Laundry in basement
Neighborhood map
What this means for you Summary
Snapshot
- This is a 3-bed/2.0-bath single-family listed at $187k.
Deal economics
- At list price, monthly cash flow is $-138 ($-2k/yr) — negative.
- To cash-flow at today's rent, offer at most $163k (13.0% below list).
- To meet the 1% rule (rent ≥ 1% of price), the offer needs to be $121k (35.3% below list).
- Recommended offer: $121k (35.3% below list) — sets the bar for 1% rule.
Location & tenants
- Location reads 45/100 on livability (#665 in IN) — a working-class tenant base; expect higher turnover. Strengths: cost of living A+, crime A; Watch: schools F, amenities F, commute F.
- South Harrison Community Schools (town): math 42% / reading 50% proficiency, ranked #89 of 301 in IN (top 30%) — families likely to look elsewhere, expect single-tenant / working-renter base with shorter leases.
- Market conditions: 4 active listings in the ZIP; 158 units permitted in Harrison County in 2024 (0 in 5+ unit buildings).
Forward outlook
- In year one you build about $13k of equity ($1k loan paydown + $12k appreciation (6.2% local appreciation)).
- Harrison County population projected to shrink 6% by 2050 — rents likely to lag national; underwrite the cash flow, not the appreciation.
- By year 3, paydown + projected appreciation supports a ~$32k cash-out refi (75% LTV) — recoverable capital for the next deal without selling this one.
Negotiation context
- Only 11 days on market — expect competitive offers; lowballing is unlikely to land.
Questions for the listing agent
- What do current leases actually rent for vs. the listed asking? Can we see a recent rent roll and the last 12 months of T-12 income?
- Built in 1978 — when were the roof, HVAC, electrical panel, plumbing, and water heater last replaced?
- Is there a deadline driving the sale (1031 exchange, divorce, estate, relocation)? That informs how much negotiation room exists.
- Schools are F-rated, which usually means shorter tenancies and higher turnover. Who's the typical renter profile here, and what's been the actual vacancy rate?
- The area grade is low — what's the realistic commute time and amenity access for the typical tenant pool here? Any planned neighborhood developments (good or bad) we should know about?
- What's the average days-on-market for RENTAL listings here right now (not sales)? A rising rental-DOM trend means longer vacancies and softer asking-rent achievability than the comps imply.
- What's the recent tenant-quality profile in this submarket — average credit score on applications, eviction rate, late-payment / NSF rate, and stable-employment percentage? A property-management company in the area should have these aggregated.
- How much new for-sale + rental construction is in the pipeline within 1–3 miles? Heavy new supply typically softens prices + rents 12–24 months out; constrained supply supports both.
Investment metrics
- 1% rule
- 0.65% ✗
- Cap rate
- 5.41%
- Cash-on-cash
- -3.16%
- DSCR
- 0.86
- GRM
- 12.9
CMA / ARV
- ARV (on-the-fly)
- $285,420
- Comps found
- 2
Show comp detail 2 sales within ~0.75 mi
| Address | Dist | Beds/Ba | Sqft | Sold | Price | $/sf | Match |
|---|---|---|---|---|---|---|---|
| 2985 Heth Washington Rd SW | 0.27mi | 3/1.0 | 1,152 (-14%) | 9mo | $214,000 | $186 | 52 |
| 3432 Hisey Rd SW | 0.51mi | 3/2.0 | 1,486 (+11%) | 10mo | $316,500 | $213 | 49 |
Match score weights: distance 35% · size 25% · config 20% · recency 20%. Top-matched comps best support the ARV.
Projected returns pro-forma
6.21% appreciation · 3.0% rent growth · sell at horizon
- IRR
- 13.3%
- Equity multiple
- 1.91×
- Total profit
- $47,496
- Equity at exit
- $120,086
- IRR
- 13.8%
- Equity multiple
- 3.78×
- Total profit
- $145,763
- Equity at exit
- $219,988
Cash invested: $52,360 (down + closing). Projections, not guarantees.
Landlord ↔ Tenant lean methodology
- Overall (STATE)
- 90 Strongly Landlord-Friendly
- State Indiana
- 90 Strongly Landlord-Friendly · R+11
- County
- — inherits STATE
- City
- — inherits STATE
ZIP-level market 47110
- Home prices YoY
- 2.5%
- Active inventory
- 4
- Price-to-rent
- 12.9×
Monthly cashflow live
- Estimated rent
- $1,210 medium interval (Pro) →
- Mortgage (P&I)
- −$981
- Tax from tax record
- −$35 /mo · $425/yr
- Insurance
- −$78
- HOA
- −$0
- Vacancy / Maint / Mgmt
- −$254
- Net cashflow
- $-138
Break-even live
UW: 25.0% down · 7.5% · 30yr · 1.5% tax · 5.0% vac · 8.0% maint · 8.0% mgmt
Financing live
Cash to close
- Down payment
- $46,750
- Closing costs
- $5,610
- Reserves months
- —
- Total cash needed
- —
Loan-product check · same deal, 3 products live
Conventional
25% down · 7.5% · 30yr
- Down + closing
- —
- Monthly P&I
- —
- Monthly cashflow
- —
- DSCR
- —
- Eligible?
- —
Personal DTI + credit; lowest rate.
DSCR
20% down · 8.5% · 30yr
- Down + closing
- —
- Monthly P&I
- —
- Monthly cashflow
- —
- DSCR
- —
- Eligible?
- —
No personal income docs; deal must DSCR.
Hard money
10% down · 12.0% · 12mo
- Down + closing
- —
- Monthly P&I
- —
- Monthly cashflow
- —
- DSCR
- —
- Eligible?
- —
Short-term bridge; refi at stabilization.
Listing history 3 events
-
2026-06-01days on market $187,000 Active 11 DOM
-
2026-05-31days on market $187,000 Active 10 DOM
-
2026-05-21$187,000 Active
ⓘ Source: listings_history table (triggers on properties + properties_extension) + one-shot
backfill from property_details.listing_events for pre-trigger history.
Tax reassessment forecast IN · Partial reset (capped growth)
- Current annual tax
- $425 · $35/mo
- Projected year-2 tax
- $1,007 · $84/mo
- Expected delta
- +$582/yr (+$49/mo · 137.1%)
ⓘ Screening estimate from a state-policy table — verify with the county assessor before closing.
Climate risk First Street
- Flood 1/10 Low FEMA zone X (unshaded) · 0% chance over 30 yrs
- Wildfire 3/10 Moderate
- Heat 4/10 Moderate 7 d/yr ≥104°F today · 19 d/yr by 30 yrs out
- Wind 3/10 Moderate 6% chance of damaging wind over 30 yrs
- Air quality 2/10 Low 1 unhealthy d/yr today · 2 by 30 yrs out
Nearby sold comps map
Loading sold comps map…
Walkable amenities ~0.75 mi
Loading nearby amenities…
Taxation est. · year 1
- Rental income
- $14,526
- − Mortgage interest
- −$10,475
- − Property taxes
- −$425
- − Insurance
- −$935
- − Repairs & maintenance
- −$1,162
- − Management
- −$1,162
- − Depreciation
- −$5,440
- Taxable loss
- −$5,073
- Est. tax savings @ 24.0%
- +$1,218
- After-tax cash flow
- $-435/yr
For passive investors: Depreciation is non-cash, so a rental often shows a tax loss while cash-flowing — sheltering income. Rental losses are passive: they offset passive income freely, and up to $25,000/yr can offset ordinary (W-2) income if you actively participate and your MAGI is under $100k (phasing out to $0 by $150k); unused losses carry forward. On sale, claimed depreciation is recaptured at up to 25%, and gains may owe capital-gains tax (a 1031 exchange can defer both). Figures are a year-1 estimate at your 24.0% rate — not tax advice; consult a CPA.
Schools (NCES district)
- District
- South Harrison Community Schools
- NCES district ID
- 1810360
- Math proficiency
- 42% ▼ -12.00%
- Reading proficiency
- 50% ▼ -3.00%
- Median HH income
- $50,528
- Composite
- 39.49/100
- National rank
- #3950
- State rank
- #89 of 301 in IN
Livability — Mauckport
- Score
- 45/100
- State rank
- #665
- US rank
- #26625
Category grades
Schools grade is shown separately in the Schools card above.
Census & demographics
- Population (ZIP)
- 656
Population outlook (Harrison County) Hauer SSP2
- Today (2025)
- 40,288 people
- By 2030
- 40,265 · -0.1%
- By 2040
- 39,538 · -1.9%
- By 2050
- 37,781 · -6.2%
- By 2075
- 33,200 · -17.6%
- By 2100
- 26,668 · -33.8%
Race, ethnicity, and origin ACS 2023
- Neighborhood character
- Predominantly White (97%)
- Race & ethnicity
- White 97% Hispanic / Latino 2%
- Common ancestry
- Italian 15% Slovak 8% Lithuanian 7%
- Languages at home
- 99% English-only · German/W. Germanic 1%
Political lean MEDSL · Harrison
- 2024 margin
- Solid R (+47.0) · D 25.6% · R 72.5% · Other 1.8%
- 2008→2024 swing
- -28.9pp toward R · 2008: -18.0pp · 2024: -47.0pp
- All cycles
- 2024: R+47.0 2020: R+45.6 2016: R+44.4 2012: R+22.8 2008: R+18.0
Not yet ingested
- Civics
- —
Market trends
- HPI YoY
- ▲ 6.21%
- Current HPI
- 252.7375
- Rent YoY
- —
- Metro
- —
- State GDP YoY
- ▲ 2.90%
- F500 in state
- 18
Industry mix (Fortune 500 HQ in IN)
| Industry | F500 HQs | Revenue |
|---|---|---|
| Industrial Machinery | 2 | $37B |
|
||
| Healthcare | 1 | $177B |
|
||
| Pharmaceuticals | 1 | $45B |
|
||
| Metals / Steel | 1 | $18B |
|
||
| Agriculture | 1 | $17B |
|
||
| Packaging | 1 | $12B |
|
||
Price history
1 event — show timeline
- 2026-05-21 Listed $187,000 SIRA
Property tax history
+1.8%/yrLatest (2024): $425 · +7.1% YoY. Source: county tax records.
Cash-flow waterfall
monthlySold comps — $/sqft
last 12 mo · ≤1 miLoading sold comps…