 🏷️ Likely Rental
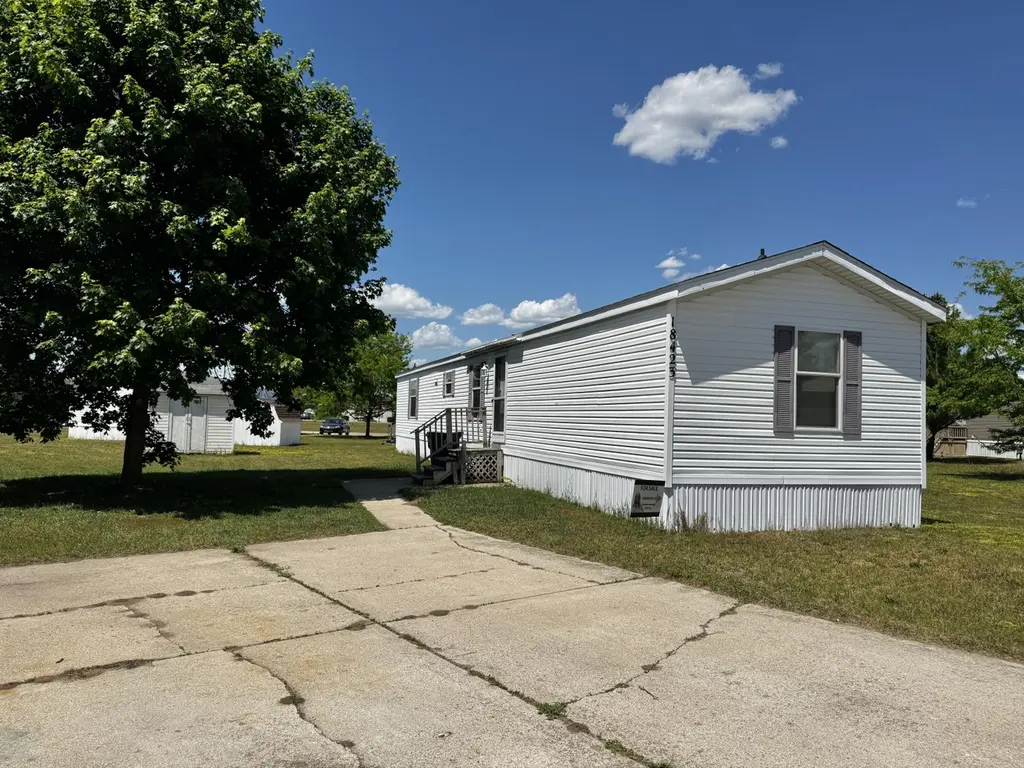
18423 Saint Joseph Ave #238 · Big Rapids, MI
Flood risk 1/10 · Minimal
- FEMA flood zone
- X (unshaded)
- Chance of flooding over 30 yrs
- 0.0%
- Est. flood insurance / yr
- $507 – $1,088
Fire risk 2/10 · Minimal
- Est. fire insurance / yr
- $784 – $1,456
Heat risk 2/10 · Minimal
- Hot days now (above 95°F)
- 7 days/yr
- Hot days in 30 yrs
- 15 days/yr
Wind risk 1/10 · Minimal
- Chance of severe wind over 30 yrs
- —
Air-quality risk 2/10 · Minimal
- Unhealthy air days now
- 1 days/yr
- Unhealthy air days in 30 yrs
- 1 days/yr
Risk factors via First Street. Map © Google.
Why this score? — see what drove the B+ grade
The composite is a weighted blend of 9 inputs, each scored 0–100. Each bar is that input's sub-score; the figure is the points it added to the 100-point composite (weight × sub-score).
- Cash flow +30.0/30.0
- ARV discount +15.0/15.0
- 1% rule +10.0/10.0
- DSCR +10.0/10.0
- Livability +3.7/5.0
- Schools +3.6/10.0
- Rent growth +2.5/5.0
- Condition / age +2.2/5.0
- Appreciation +0.0/10.0
$38,000
🖨 Deal sheet 📄 Offer letter ✓ Due diligence
Listing remarks MLS
Country Manor Estates is now under new ownership and professional management! Looking for an affordable 3-bedroom, 2 full bath home? This welcoming community offers a variety of financing options to fit your needs. Enjoy clean, well-maintained grounds along with great amenities, including a playground, tennis, pickleball, and basketball court--perfect for families and active lifestyles. Lot rent is approximately $525/month, plus $110 for water, sewer, trash. Please note: this is a mobile home community; no land is included in the sale. Buyer must complete park application and receive approval prior to closing. Buyers must pay a 6% sales tax and a $90.00 title transfer fee that goes to the Secretary of State. Contact the listing agent today for more information or to schedule a tour!
Key facts
- Great amenities
- Pickleball court
- Tennis court
Tags
Property features AI
Finance
- HOA & community: Monthly association fee of 525; Association amenities include a playground and tennis courts; Association fee includes snow removal
Exterior
- Utilities: Natural gas available
- Home design: Ranch-style residence; Built in 2001
- Construction: Vinyl siding; Shingle roof
- Exterior features: Public water
Interior
- Bathrooms: 2 full bathrooms
- Heating & cooling: Forced air heating; Heating available
- Interior features: Total of 8 rooms; Slab foundation/basement
Neighborhood map
What this means for you Summary
Snapshot
- This is a 3-bed/2.0-bath manufactured listed at $38k. Condition is rated fair.
Deal economics
- At list price, monthly cash flow is $268 ($3k/yr) — positive.
- The deal already cash-flows at list — no discount required.
- Meets the 1% rule at list price ($1k rent vs $38k).
- Cap rate 14.8% vs local median 2.5% in Big Rapids — top-decile yield for the area; either an underpriced asset or a hidden risk that comps aren't pricing in. Stress-test before assuming the spread holds.
Location & tenants
- Location reads 73/100 on livability (#209 in MI) — a middle-class / working-renter tenant base. Strengths: cost of living A+, health & safety A+, housing A; Watch: amenities F, commute F, employment F.
- Big Rapids Public Schools (town): math 36% / reading 52% proficiency, ranked #176 of 540 in MI (top 33%) — families likely to look elsewhere, expect single-tenant / working-renter base with shorter leases.
- Market conditions: 191 active listings in the ZIP; 116 units permitted in Mecosta County in 2024 (0 in 5+ unit buildings).
Forward outlook
- Local home prices are declining (-3.0%/yr); year-one equity from $263 of loan paydown is wiped out by about $1k of value loss. Plan a longer hold.
- Mecosta County population projected to shrink 9% by 2050 — rents likely to lag national; underwrite the cash flow, not the appreciation.
- At projected returns (-3.0% appreciation + 3.0% rent growth), your $11k cash investment doubles in ~4 years — after that, you're playing with house money.
Negotiation context
- Only 11 days on market — expect competitive offers; lowballing is unlikely to land.
- 3 sale attempts with the ask held roughly flat each time — persistent listings suggest the price (not the market) is what's stuck; bring a comps-based counter.
Risks & watch-outs
- Watch-outs: HOA is 39% of rent.
Questions for the listing agent
- Have any recent inspections been done? Can we get a copy of the seller's disclosures and any deferred-maintenance estimates?
- What does the HOA fee cover, when was the last increase, and are there any pending special assessments or reserve-fund shortfalls?
- Is there a deadline driving the sale (1031 exchange, divorce, estate, relocation)? That informs how much negotiation room exists.
- What's the average days-on-market for RENTAL listings here right now (not sales)? A rising rental-DOM trend means longer vacancies and softer asking-rent achievability than the comps imply.
- What's the recent tenant-quality profile in this submarket — average credit score on applications, eviction rate, late-payment / NSF rate, and stable-employment percentage? A property-management company in the area should have these aggregated.
- How much new for-sale + rental construction is in the pipeline within 1–3 miles? Heavy new supply typically softens prices + rents 12–24 months out; constrained supply supports both.
Investment metrics
- 1% rule
- 3.52% ✓
- Cap rate
- 14.77%
- Cash-on-cash
- 30.26%
- DSCR
- 2.35
- GRM
- 2.4
CMA / ARV
- ARV (on-the-fly)
- $69,312
- Comps found
- 4
Show comp detail 4 sales within ~0.75 mi
| Address | Dist | Beds/Ba | Sqft | Sold | Price | $/sf | Match |
|---|---|---|---|---|---|---|---|
| 20798 Saint Joseph Ave Lot 226 | 0.00mi | 3/2.0 | 1,216 (0%) | 1mo | $35,000 | $29 | 99 |
| 18365 Saint Joseph Dr #234 | 0.05mi | 3/2.0 | 1,216 (0%) | 1mo | $30,000 | $25 | 97 |
| 18336 St Joseph Ave #222 | 0.08mi | 3/2.0 | 1,216 (0%) | 6mo | $69,900 | $57 | 92 |
| 21269 19 Mile Rd | 0.69mi | 2/2.0 (-1) | 1,288 (+6%) | 8mo | $119,900 | $93 | 46 |
Match score weights: distance 35% · size 25% · config 20% · recency 20%. Top-matched comps best support the ARV.
Projected returns pro-forma
-3.0% appreciation · 3.0% rent growth · sell at horizon
- IRR
- 25.5%
- Equity multiple
- 2.06×
- Total profit
- $11,275
- Equity at exit
- $5,666
- IRR
- 33.5%
- Equity multiple
- 4.12×
- Total profit
- $33,217
- Equity at exit
- $3,286
Cash invested: $10,640 (down + closing). Projections, not guarantees.
Landlord ↔ Tenant lean methodology
- Overall (STATE)
- 62 Landlord-Friendly
- State Michigan
- 62 Landlord-Friendly · EVEN
- County
- — inherits STATE
- City
- — inherits STATE
ZIP-level market 49307
- Active inventory
- 191
- Price-to-rent
- 2.4×
Monthly cashflow live
- Estimated rent
- $1,337 medium interval (Pro) →
- Mortgage (P&I)
- −$199
- Tax est. 1.5%
- −$48 /mo · $570/yr
- Insurance
- −$16
- HOA
- −$525
- Vacancy / Maint / Mgmt
- −$281
- Net cashflow
- $268
Break-even live
UW: 25.0% down · 7.5% · 30yr · 1.5% tax · 5.0% vac · 8.0% maint · 8.0% mgmt
Financing live
Cash to close
- Down payment
- $9,500
- Closing costs
- $1,140
- Reserves months
- —
- Total cash needed
- —
Loan-product check · same deal, 3 products live
Conventional
25% down · 7.5% · 30yr
- Down + closing
- —
- Monthly P&I
- —
- Monthly cashflow
- —
- DSCR
- —
- Eligible?
- —
Personal DTI + credit; lowest rate.
DSCR
20% down · 8.5% · 30yr
- Down + closing
- —
- Monthly P&I
- —
- Monthly cashflow
- —
- DSCR
- —
- Eligible?
- —
No personal income docs; deal must DSCR.
Hard money
10% down · 12.0% · 12mo
- Down + closing
- —
- Monthly P&I
- —
- Monthly cashflow
- —
- DSCR
- —
- Eligible?
- —
Short-term bridge; refi at stabilization.
HOA detail
- Monthly dues
- $525 · $6,300/yr
- Likely covers
- watersewertrashlandscaping
Listing history 8 events
-
2026-06-19days on market $38,000 Active 11 DOM
-
2026-06-18days on market $38,000 Active 10 DOM
-
2026-06-17days on market $38,000 Active 9 DOM
-
2026-06-16days on market $38,000 Active 8 DOM
-
2026-06-15days on market $38,000 Active 7 DOM
-
2026-06-12days on market $38,000 Active 4 DOM
-
2026-06-09remarks 699-char remark
-
2026-06-09$38,000 Active 1 DOM
ⓘ Source: listings_history table (triggers on properties + properties_extension) + one-shot
backfill from property_details.listing_events for pre-trigger history.
Climate risk First Street
- Flood 1/10 Low FEMA zone X (unshaded) · 0% chance over 30 yrs
- Wildfire 2/10 Low
- Heat 2/10 Low 7 d/yr ≥95°F today · 15 d/yr by 30 yrs out
- Wind 1/10 Low
- Air quality 2/10 Low 1 unhealthy d/yr today · 1 by 30 yrs out
Nearby sold comps map
Loading sold comps map…
Walkable amenities ~0.75 mi
Loading nearby amenities…
Taxation est. · year 1
- Rental income
- $16,040
- − Mortgage interest
- −$2,129
- − Property taxes
- −$570
- − Insurance
- −$190
- − Repairs & maintenance
- −$1,283
- − Management
- −$1,283
- − HOA
- −$6,300
- − Depreciation
- −$1,105
- Taxable income
- $3,179
- Est. tax owed @ 24.0%
- −$763
- After-tax cash flow
- $2,457/yr
For passive investors: Depreciation is non-cash, so a rental often shows a tax loss while cash-flowing — sheltering income. Rental losses are passive: they offset passive income freely, and up to $25,000/yr can offset ordinary (W-2) income if you actively participate and your MAGI is under $100k (phasing out to $0 by $150k); unused losses carry forward. On sale, claimed depreciation is recaptured at up to 25%, and gains may owe capital-gains tax (a 1031 exchange can defer both). Figures are a year-1 estimate at your 24.0% rate — not tax advice; consult a CPA.
Condition & rehab AI · 9 photos
This mobile home requires cosmetic repairs and maintenance to improve its appearance and value. Key areas for improvement include the exterior siding, driveway, and carpet. Painting and replacing the carpet will significantly enhance the home's curb appeal and interior comfort.
Repairs flagged
- Major Driveway — Cracked concrete
- Major Exterior siding — Weathered and peeling
- Major Carpet — Worn and frayed
Value-add opportunities
- Both Paint interior walls — Enhances curb appeal and interior aesthetics
- Both Replace carpet — Improves comfort and reduces maintenance
- Both Replace exterior siding — Enhances curb appeal and structural integrity
Renovation cost estimate screening
| Repair item | Severity | Est. cost |
|---|---|---|
| Driveway · Cracked concrete | Major | $15,000–50,000 |
| Exterior siding · Weathered and peeling | Major | $15,000–50,000 |
| Carpet · Worn and frayed | Major | $15,000–50,000 |
| Total estimated repair cost · 3 items | $45,000–150,000 |
Value-add ROI direction
- Both Paint interior walls — Enhances curb appeal and interior aesthetics ↑
- Both Replace carpet — Improves comfort and reduces maintenance ↑
- Both Replace exterior siding — Enhances curb appeal and structural integrity ↑
ⓘ Cost ranges are severity-bucket heuristics (US national rule-of-thumb). Get contractor quotes + a written scope before underwriting a rehab budget.
Schools (NCES district)
- District
- Big Rapids Public Schools
- NCES district ID
- 2605780
- Math proficiency
- 36% ▼ -4.00%
- Reading proficiency
- 52% ▲ 4.00%
- Median HH income
- $35,568
- Composite
- 36.37/100
- National rank
- #4685
- State rank
- #176 of 540 in MI
Livability — Big Rapids
- Score
- 73/100
- State rank
- #209
- US rank
- #5231
Category grades
Schools grade is shown separately in the Schools card above.
Census & demographics
- County
- Mecosta County · 18,407 people
- City population
- 18,407
- Metro
- Big Rapids, MI
- Population (ZIP)
- 18,407
- Household income
- $60,358
- Rent vs Own
- Severe rent burden
- 667.0
Population outlook (Mecosta County) Hauer SSP2
- Today (2025)
- 42,954 people
- By 2030
- 42,954 · +0.0%
- By 2040
- 41,574 · -3.2%
- By 2050
- 39,250 · -8.6%
- By 2075
- 32,628 · -24.0%
- By 2100
- 27,476 · -36.0%
Race, ethnicity, and origin ACS 2023
- Neighborhood character
- Predominantly White (87%)
- Race & ethnicity
- White 87% Two or more races 5% Black 4% Hispanic / Latino 3% Asian 1%
- Common ancestry
- Romanian 6% Iranian 5% Lithuanian 3%
- Foreign-born
- 2% · Canada
- Languages at home
- 97% English-only · Spanish 1% Other Asian/Pacific 1%
Political lean MEDSL · Mecosta
- 2024 margin
- Solid R (+30.0) · D 34.2% · R 64.2% · Other 1.6%
- 2008→2024 swing
- -29.3pp toward R · 2008: -0.7pp · 2024: -30.0pp
- All cycles
- 2024: R+30.0 2020: R+28.0 2016: R+26.1 2012: R+9.8 2008: R+0.7
Not yet ingested
- Civics
- —
Market trends
- HPI YoY
- ▼ -107.88%
- Current HPI
- 199.8828
- Rent YoY
- —
- Metro
- Big Rapids, MI
- State GDP YoY
- ▲ 1.37%
- F500 in state
- 28
Industry mix (Fortune 500 HQ in MI)
| Industry | F500 HQs | Revenue |
|---|---|---|
| Automotive Parts | 3 | $48B |
|
||
| Automotive | 2 | $372B |
|
||
| Chemicals | 1 | $45B |
|
||
| Automotive Retail | 1 | $29B |
|
||
| Healthcare / Medical Devices | 1 | $23B |
|
||
| Automotive Technology | 1 | $20B |
|
||
Price history
+0.0% since first listed3 events — show timeline
- 2026-06-03 Listed $38,000 MiRealSource-MiMLS
- 2026-06-03 Listed $38,000 REALCOMP
- 2026-06-03 Listed $38,000 SW Michigan MLS
Cash-flow waterfall
monthlySold comps — $/sqft
last 12 mo · ≤1 miLoading sold comps…