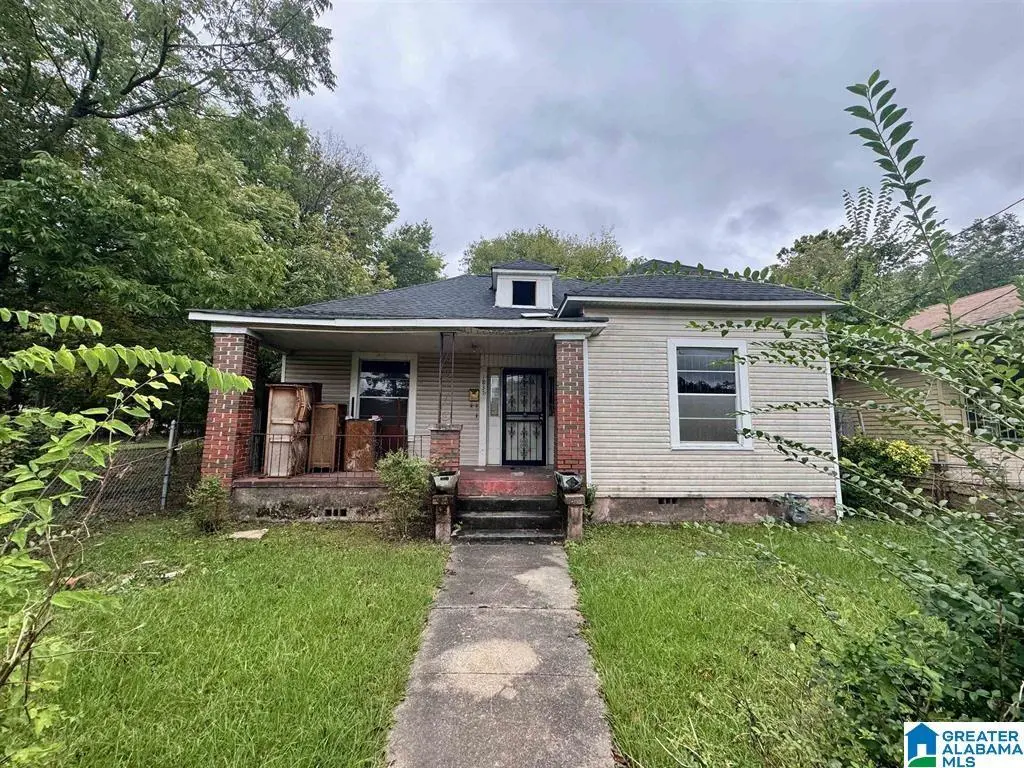
1837 15th Street Ensley · Birmingham, AL
Flood risk 4/10 · Minor
- FEMA flood zone
- AE
- Chance of flooding over 30 yrs
- 0.22%
- Est. flood insurance / yr
- $1,737 – $8,500
Fire risk 1/10 · Minimal
- Est. fire insurance / yr
- $916 – $1,700
Heat risk 7/10 · Major
- Hot days now (above 106°F)
- 7 days/yr
- Hot days in 30 yrs
- 19 days/yr
Wind risk 6/10 · Moderate
- Chance of severe wind over 30 yrs
- 27.0%
Air-quality risk 4/10 · Minor
- Unhealthy air days now
- 5 days/yr
- Unhealthy air days in 30 yrs
- 5 days/yr
Risk factors via First Street. Map © Google.
Why this score? — see what drove the B+ grade
The composite is a weighted blend of 9 inputs, each scored 0–100. Each bar is that input's sub-score; the figure is the points it added to the 100-point composite (weight × sub-score).
- Cash flow +30.0/30.0
- ARV discount +15.0/15.0
- 1% rule +10.0/10.0
- DSCR +10.0/10.0
- Appreciation +4.2/10.0
- Livability +3.4/5.0
- Rent growth +2.5/5.0
- Condition / age +2.5/5.0
- Schools +0.9/10.0
$40,000
🖨 Deal sheet 📄 Offer letter ✓ Due diligence
Listing remarks MLS
What an adorable investment opportunity on the edge of Bush Hills. Set amongst the trees, and fenced lot, this 2 bedroom home is ready for the next owner that will show it some tender loving care as they bring it to their desired condition. Huge opportunity for those moving into home ownership and/or as a rental to build rapid equity due to the renovation potential. With plenty of space and nearly 1200 square feet, there's plenty for everyone. Don't miss this one call today!
Key facts
- 4,356 sq ft lot
- Built 1916
- Listed 224 days
Neighborhood map
What this means for you Summary
Snapshot
- This is a 3-bed/1.0-bath single-family listed at $40k.
Deal economics
- At list price, monthly cash flow is $144 ($2k/yr) — positive.
- The deal already cash-flows at list — no discount required.
- Meets the 1% rule at list price ($1k rent vs $40k).
- Recommended offer: $35k (12.0% below list) — sets the bar for market timing.
- Cap rate 23.4% vs local median 6.2% in Birmingham — top-decile yield for the area; either an underpriced asset or a hidden risk that comps aren't pricing in. Stress-test before assuming the spread holds.
Location & tenants
- Location reads 67/100 on livability (#78 in AL) — a middle-class / working-renter tenant base. Strengths: commute A+, cost of living A+, housing A+; Watch: amenities C-, schools F, crime F.
- Birmingham City (urban): math 4% / reading 20% proficiency, ranked #116 of 129 in AL (top 90%) — low school quality limits family demand, transient renter base, plan for 1-2y turnover; 82% free/reduced lunch — lower-income household profile, screen leases tightly.
- Market conditions: 50 active listings in the ZIP; 40 comparable units currently listed for rent nearby; rentals at typical pace (median 24d on market — plan ~3-4 weeks tenant-placement turnaround); 45% of comp listings sitting > 30 days — soft ceiling on asking rent; lower-income renter base — watch delinquency; 2,114 units permitted in Jefferson County in 2024 (556 in 5+ unit buildings).
- This rent runs 43% of the median local income ($31k/yr) — at the standard rent-burdened threshold; future hikes will face affordability resistance.
Forward outlook
- Local home prices are declining (-1.5%/yr); year-one equity from $277 of loan paydown is wiped out by about $616 of value loss. Plan a longer hold.
- Jefferson County population projected to shrink 4% by 2050 — rents likely to lag national; underwrite the cash flow, not the appreciation.
- At projected returns (-1.5% appreciation + 3.0% rent growth), your $11k cash investment doubles in ~6 years — after that, you're playing with house money.
Negotiation context
- It's been on market 224 days — a 12% lower offer ($35k) is reasonable based on typical stale-listing flexibility.
- 2 sale attempts since 4y ago; this cycle's ask has dropped $20k (33%) from the opening price — seller is motivated, your offer sets the floor, not the list.
Risks & watch-outs
- Watch-outs: flood insurance adds $427/mo; built in 1916 — expect roof / HVAC / electrical / plumbing capex.
- Climate carrying-cost: in FEMA flood zone AE (mandatory federal flood insurance); major wind risk, 27% chance of damaging wind over 30y; extreme-heat days projected 7→19/yr by 2055 (HVAC capex compounding) — expect insurance premiums to compound above CPI over the hold.
Questions for the listing agent
- It's been on market 224 days. Have you received any prior offers? Is the seller open to a 12% concession, seller financing, or rate buy-down credit?
- Built in 1916 — when were the roof, HVAC, electrical panel, plumbing, and water heater last replaced?
- What's the actual annual flood-insurance premium (NFIP or private), and is the property in a SFHA with mandatory coverage?
- Why hasn't it sold? Are there any deal-killer items the seller is aware of (foundation, flood, title, zoning, code violations)?
- Is there a deadline driving the sale (1031 exchange, divorce, estate, relocation)? That informs how much negotiation room exists.
- Schools are F-rated, which usually means shorter tenancies and higher turnover. Who's the typical renter profile here, and what's been the actual vacancy rate?
- Crime grade is F in this area — have there been break-ins, vandalism, or insurance claims at this property in the last 3 years? What carrier currently insures it and at what premium?
- What's the average days-on-market for RENTAL listings here right now (not sales)? A rising rental-DOM trend means longer vacancies and softer asking-rent achievability than the comps imply.
- What's the recent tenant-quality profile in this submarket — average credit score on applications, eviction rate, late-payment / NSF rate, and stable-employment percentage? A property-management company in the area should have these aggregated.
- How much new for-sale + rental construction is in the pipeline within 1–3 miles? Heavy new supply typically softens prices + rents 12–24 months out; constrained supply supports both.
Investment metrics
- 1% rule
- 2.76% ✓
- Cap rate
- 23.40%
- Cash-on-cash
- 61.08%
- DSCR
- 3.72
- GRM
- 3.0
CMA / ARV
- ARV (median comp)
- $52,833
- List price
- $40,000
- Delta
- -24.29%
- Verdict
- UNDERPRICED
- Comps
- 20 within 1.0 mi
Show comp detail 12 sales within ~0.75 mi
| Address | Dist | Beds/Ba | Sqft | Sold | Price | $/sf | Match |
|---|---|---|---|---|---|---|---|
| 1921 10th St | 0.47mi | 3/1.0 | 1,120 (-5%) | 2mo | $85,000 | $76 | 68 |
| 1328 Avenue I | 0.38mi | 3/1.0 | 1,223 (+4%) | 12mo | $51,500 | $42 | 66 |
| 1249 Avenue M | 0.25mi | 3/2.0 | 1,144 (-3%) | 18mo | $30,000 | $26 | 65 |
| 811 W 17th St | 0.44mi | 3/1.0 | 1,146 (-3%) | 22mo | $57,000 | $50 | 57 |
| 2016 26th St W | 0.64mi | 3/2.0 | 1,156 (-2%) | 11mo | $70,000 | $61 | 54 |
| 1520 Avenue G | 0.52mi | 3/1.0 | 1,231 (+4%) | 20mo | $77,000 | $63 | 52 |
| 1408 Avenue D | 0.73mi | 3/1.0 | 1,320 (+12%) | 2mo | $67,000 | $51 | 44 |
| 1104 Avenue | 0.71mi | 4/2.0 (+1) | 1,200 (+2%) | 13mo | $15,100 | $13 | 44 |
| 925 Avenue F | 0.74mi | 3/1.0 | 1,036 (-12%) | 2mo | $13,000 | $13 | 44 |
| 2643 16th Street Ensley | 0.69mi | 3/1.0 | 1,084 (-8%) | 17mo | $42,500 | $39 | 40 |
| 2129 Pike Rd | 0.46mi | 4/1.0 (+1) | 1,352 (+15%) | 11mo | $115,000 | $85 | 40 |
| 1414 20th Street Ensley | 0.42mi | 3/1.0 | 1,339 (+14%) | 23mo | $55,000 | $41 | 38 |
Match score weights: distance 35% · size 25% · config 20% · recency 20%. Top-matched comps best support the ARV.
Projected returns pro-forma
-1.54% appreciation · 3.0% rent growth · sell at horizon
- IRR
- 11.1%
- Equity multiple
- 1.49×
- Total profit
- $5,462
- Equity at exit
- $8,629
- IRR
- 18.4%
- Equity multiple
- 2.79×
- Total profit
- $20,015
- Equity at exit
- $8,214
Cash invested: $11,200 (down + closing). Projections, not guarantees.
Landlord ↔ Tenant lean methodology
- Overall (STATE)
- 90 Strongly Landlord-Friendly
- State Alabama
- 90 Strongly Landlord-Friendly · R+15
- County
- — inherits STATE
- City
- — inherits STATE
ZIP-level market 35218
- Home prices YoY
- -0.9%
- Active inventory
- 50
- Price-to-rent
- 3.0×
Monthly cashflow live
- Estimated rent
- $1,104 high interval (Pro) →
- Mortgage (P&I)
- −$210
- Tax from tax record
- −$76 /mo · $912/yr
- Insurance
- −$17
- Flood insurance flood zone
- −$427 /mo · $5,118/yr
- HOA
- −$0
- Vacancy / Maint / Mgmt
- −$232
- Net cashflow
- $144
Break-even live
UW: 25.0% down · 7.5% · 30yr · 1.5% tax · 5.0% vac · 8.0% maint · 8.0% mgmt
Financing live
Cash to close
- Down payment
- $10,000
- Closing costs
- $1,200
- Reserves months
- —
- Total cash needed
- —
Loan-product check · same deal, 3 products live
Conventional
25% down · 7.5% · 30yr
- Down + closing
- —
- Monthly P&I
- —
- Monthly cashflow
- —
- DSCR
- —
- Eligible?
- —
Personal DTI + credit; lowest rate.
DSCR
20% down · 8.5% · 30yr
- Down + closing
- —
- Monthly P&I
- —
- Monthly cashflow
- —
- DSCR
- —
- Eligible?
- —
No personal income docs; deal must DSCR.
Hard money
10% down · 12.0% · 12mo
- Down + closing
- —
- Monthly P&I
- —
- Monthly cashflow
- —
- DSCR
- —
- Eligible?
- —
Short-term bridge; refi at stabilization.
Rent comps 40 comps
| Address | Beds | Baths | Sqft | Rent | $/sqft | DOM | Units | Dist |
|---|---|---|---|---|---|---|---|---|
| 1825 18th Street Ensley Unit ENSLEY Birmingham, AL | 3.0 | 1.0 | 1316 | $1,123 | $0.85 | 43d | 1 | 0.07mi |
| 1316 Court R Birmingham, AL | 3.0 | 1.0 | 904 | $900 | $1.00 | 10d | 1 | 0.09mi |
| 1306 Avenue R Unit R Birmingham, AL | 3.0 | 1.0 | 980 | $950 | $0.97 | 43d | 1 | 0.11mi |
| 1306 Avenue R Unit R Birmingham, AL | 3.0 | 1.0 | 980 | $950 | $0.97 | 3d | 1 | 0.11mi |
| 1701 Avenue I Unit I Birmingham, AL | 3.0 | 1.0 | 1140 | $1,200 | $1.05 | 3d | 1 | 0.36mi |
| 820 17th Street Ensley Birmingham, AL | 3.0 | 2.0 | 1336 | $1,250 | $0.94 | 43d | 1 | 0.37mi |
| 811 17th Aly Birmingham, AL | 4.0 | 1.0 | 1146 | $1,050 | $0.92 | 10d | 1 | 0.41mi |
| 1521 22nd Street Ensley Unit B Birmingham, AL | 2.0 | 1.0 | 750 | $875 | $1.17 | 23d | 1 | 0.48mi |
| 1520 Avenue G Unit G Birmingham, AL | 4.0 | 1.0 | 1231 | $1,100 | $0.89 | 43d | 1 | 0.49mi |
| 1001 21st Street Ensley Unit B Birmingham, AL | 2.0 | 1.0 | 700 | $725 | $1.04 | 16d | 1 | 0.50mi |
| 2426 Avenue U Unit U Birmingham, AL | 3.0 | 2.0 | 1260 | $1,175 | $0.93 | 19d | 1 | 0.54mi |
| 2337 23rd Street Ensley Birmingham, AL | 3.0 | 1.0 | 1446 | $1,295 | $0.90 | 43d | 1 | 0.56mi |
| 2356 22nd Street Ensley Unit ENSLEY Birmingham, AL | 3.0 | 1.0 | 1500 | $985 | $0.66 | 23d | 1 | 0.57mi |
| 2108 25th Street Ensley Birmingham, AL | 4.0 | 2.0 | 1446 | $1,300 | $0.90 | 43d | 1 | 0.61mi |
| 1609 Pike Rd Birmingham, AL | 2.0 | 1.5 | 820 | $800 | $0.98 | 19d | 5 | 0.62mi |
| 2213 25th Street Ensley Birmingham, AL | 4.0 | 2.0 | 1197 | $1,150 | $0.96 | 10d | 1 | 0.66mi |
| 2610 Avenue P Birmingham, AL | 3.0 | 2.0 | 1014 | $850 | $0.84 | 43d | 1 | 0.68mi |
| 2609 20th Street Ensley Birmingham, AL | 3.0 | 2.0 | 1500 | $1,550 | $1.03 | 3d | 1 | 0.69mi |
| 2609 20th Street Ensley Birmingham, AL | 3.0 | 2.0 | 1229 | $1,550 | $1.26 | 43d | 1 | 0.69mi |
| 2037 26th Street Ensley Birmingham, AL | 3.0 | 1.0 | 1074 | $995 | $0.93 | 43d | 1 | 0.70mi |
| 2621 20th Street Ensley Birmingham, AL | 3.0 | 1.0 | 1117 | $1,295 | $1.16 | 43d | 1 | 0.71mi |
| 2661 Bush Blvd Birmingham, AL | 3.0 | 2.0 | 1024 | $1,200 | $1.17 | 43d | 1 | 0.75mi |
| 1616 28th Street Ensley Birmingham, AL | 3.0 | 1.0 | 1081 | $1,100 | $1.02 | 43d | 1 | 0.75mi |
| 1521 27th Street Ensley Birmingham, AL | 3.0 | 2.0 | 1120 | $1,000 | $0.89 | 43d | 1 | 0.76mi |
| 2520 Avenue L Unit A Birmingham, AL | 4.0 | 1.5 | 1260 | $1,150 | $0.91 | 23d | 1 | 0.80mi |
| 1720 Cullman Ave Unit 3 Birmingham, AL | 3.0 | 2.0 | 1174 | $950 | $0.81 | 43d | 1 | 0.83mi |
| 1720 Cullman Ave Unit 2 Birmingham, AL | 3.0 | 1.0 | 1174 | $899 | $0.77 | 21d | 1 | 0.83mi |
| 1545 29th Street Ensley Birmingham, AL | 3.0 | 1.5 | 1331 | $1,200 | $0.90 | 43d | 1 | 0.85mi |
| 1724 30th Street Ensley Birmingham, AL | 4.0 | 2.0 | 1428 | $1,395 | $0.98 | 16d | 1 | 0.86mi |
| 2617 Avenue K Birmingham, AL | 4.0 | 2.0 | 1046 | $1,495 | $1.43 | 1d | 1 | 0.86mi |
| 2720 23rd Street Ensley Birmingham, AL | 4.0 | 2.0 | 1350 | $1,500 | $1.11 | 3d | 1 | 0.89mi |
| 1501 29th Street Ensley Birmingham, AL | 2.0 | 1.0 | 772 | $800 | $1.04 | 23d | 1 | 0.89mi |
| 2712 24th Street Ensley Unit ENSLEY Birmingham, AL | 3.0 | 1.0 | 1232 | $1,099 | $0.89 | 23d | 1 | 0.90mi |
| 2421 29th Street Ensley Unit C Birmingham, AL | 2.0 | 1.0 | 950 | $703 | $0.74 | 23d | 1 | 0.92mi |
| 1532 31st Street Ensley Birmingham, AL | 2.0 | 1.0 | 839 | $850 | $1.01 | 43d | 1 | 0.97mi |
| 2329 30th Street Ensley Birmingham, AL | 2.0 | 1.0 | 917 | $990 | $1.08 | 23d | 1 | 0.97mi |
| 3009 Prince Ave Birmingham, AL | 3.0 | 2.0 | 1176 | $1,095 | $0.93 | 23d | 1 | 1.02mi |
| 2709 30th Street Ensley Birmingham, AL | 4.0 | 2.0 | 1410 | $1,323 | $0.94 | 2d | 1 | 1.04mi |
| 1313 Pike Rd Birmingham, AL | 3.0 | 1.0 | 1437 | $975 | $0.68 | 43d | 1 | 1.06mi |
| 1820 33rd St W Birmingham, AL | 4.0 | 1.5 | 1212 | $1,495 | $1.23 | 43d | 1 | 1.07mi |
Listing history 19 events
-
2026-06-18days on market $40,000 Active 224 DOM
-
2026-06-17days on market $40,000 Active 223 DOM
-
2026-06-16days on market $40,000 Active 222 DOM
-
2026-06-15days on market $40,000 Active 221 DOM
-
2026-06-13days on market $40,000 Active 219 DOM
-
2026-06-10days on market $40,000 Active 216 DOM
-
2026-06-09days on market $40,000 Active 215 DOM
-
2026-06-08days on market $40,000 Active 214 DOM
-
2026-06-07days on market $40,000 Active 213 DOM
-
2026-06-03days on market $40,000 Active 209 DOM
-
2026-06-02days on market $40,000 Active 208 DOM
-
2026-06-01days on market $40,000 Active 207 DOM
-
2026-05-31days on market $40,000 Active 206 DOM
-
2026-04-18price $40,000 479-char remark
Show marketing remark (479 chars)
What an adorable investment opportunity on the edge of Bush Hills. Set amongst the trees, and fenced lot, this 2 bedroom home is ready for the next owner that will show it some tender loving care as they bring it to their desired condition. Huge opportunity for those moving into home ownership and/or as a rental to build rapid equity due to the renovation potential. With plenty of space and nearly 1200 square feet, there's plenty for everyone. Don't miss this one call today!
-
2026-02-13price $55,000 479-char remark
Show marketing remark (479 chars)
What an adorable investment opportunity on the edge of Bush Hills. Set amongst the trees, and fenced lot, this 2 bedroom home is ready for the next owner that will show it some tender loving care as they bring it to their desired condition. Huge opportunity for those moving into home ownership and/or as a rental to build rapid equity due to the renovation potential. With plenty of space and nearly 1200 square feet, there's plenty for everyone. Don't miss this one call today!
-
2025-11-05$60,000 Active 479-char remark
Show marketing remark (479 chars)
What an adorable investment opportunity on the edge of Bush Hills. Set amongst the trees, and fenced lot, this 2 bedroom home is ready for the next owner that will show it some tender loving care as they bring it to their desired condition. Huge opportunity for those moving into home ownership and/or as a rental to build rapid equity due to the renovation potential. With plenty of space and nearly 1200 square feet, there's plenty for everyone. Don't miss this one call today!
-
2022-08-16soldstatus $40,000 Sold 153-char remark
Show marketing remark (153 chars)
Investor Special! 3/1 home with 1178 sq ft needs complete rehab inside and some roof repair on back. Sold as is. Call today for an opportunity to see it.
-
2022-08-15status Pending 153-char remark
Show marketing remark (153 chars)
Investor Special! 3/1 home with 1178 sq ft needs complete rehab inside and some roof repair on back. Sold as is. Call today for an opportunity to see it.
-
2022-07-18$48,500 Active 153-char remark
Show marketing remark (153 chars)
Investor Special! 3/1 home with 1178 sq ft needs complete rehab inside and some roof repair on back. Sold as is. Call today for an opportunity to see it.
ⓘ Source: listings_history table (triggers on properties + properties_extension) + one-shot
backfill from property_details.listing_events for pre-trigger history.
Tax reassessment forecast AL · Resets to sale price
- Current annual tax
- $912 · $76/mo
- Projected year-2 tax
- $912 · $76/mo
- Expected delta
- $0/yr ($0/mo · 0.0%)
ⓘ Screening estimate from a state-policy table — verify with the county assessor before closing.
Climate risk First Street
- Flood 4/10 Moderate FEMA zone AE · 22% chance over 30 yrs
- Wildfire 1/10 Low
- Heat 7/10 Severe 7 d/yr ≥106°F today · 19 d/yr by 30 yrs out
- Wind 6/10 Major 27% chance of damaging wind over 30 yrs
- Air quality 4/10 Moderate 5 unhealthy d/yr today · 5 by 30 yrs out
Nearby sold comps map
Loading sold comps map…
Walkable amenities ~0.75 mi
Loading nearby amenities…
Taxation est. · year 1
- Rental income
- $13,254
- − Mortgage interest
- −$2,241
- − Property taxes
- −$912
- − Insurance
- −$5,318
- − Repairs & maintenance
- −$1,060
- − Management
- −$1,060
- − Depreciation
- −$1,164
- Taxable income
- $1,498
- Est. tax owed @ 24.0%
- −$360
- After-tax cash flow
- $1,363/yr
For passive investors: Depreciation is non-cash, so a rental often shows a tax loss while cash-flowing — sheltering income. Rental losses are passive: they offset passive income freely, and up to $25,000/yr can offset ordinary (W-2) income if you actively participate and your MAGI is under $100k (phasing out to $0 by $150k); unused losses carry forward. On sale, claimed depreciation is recaptured at up to 25%, and gains may owe capital-gains tax (a 1031 exchange can defer both). Figures are a year-1 estimate at your 24.0% rate — not tax advice; consult a CPA.
Schools (NCES district)
- District
- Birmingham City
- NCES district ID
- 0100390
- Math proficiency
- 4% ▼ -17.00%
- Reading proficiency
- 20% ▼ -4.00%
- Median HH income
- $31,988
- Composite
- 9.49/100
- National rank
- #9850
- State rank
- #116 of 129 in AL
Livability — Birmingham
- Score
- 67/100
- State rank
- #78
- US rank
- #10412
Category grades
Schools grade is shown separately in the Schools card above.
Census & demographics
- Census place
- Birmingham, AL
- County
- Jefferson County · 527,445 people
- City population
- 210,422
- Metro
- Birmingham-Hoover, AL
- Population (ZIP)
- 6,981
- Household income
- $30,739
- Rent vs Own
- Severe rent burden
- 621.0
Population outlook (Jefferson County) Hauer SSP2
- Today (2025)
- 669,185 people
- By 2030
- 669,694 · +0.1%
- By 2040
- 661,388 · -1.2%
- By 2050
- 643,086 · -3.9%
- By 2075
- 577,267 · -13.7%
- By 2100
- 474,758 · -29.1%
Race, ethnicity, and origin ACS 2023
- Neighborhood character
- Predominantly Black (76%)
- Race & ethnicity
- Black 76% Two or more races 17% White 5% Hispanic / Latino 4%
- Foreign-born
- 2% · Canada, South Korea
- Languages at home
- 97% English-only · Spanish 1%
Political lean MEDSL · Jefferson
- 2024 margin
- D (+10.4) · D 54.6% · R 44.2% · Other 1.2%
- 2008→2024 swing
- +5.4pp toward D · 2008: 5.1pp · 2024: 10.4pp
- All cycles
- 2024: D+10.4 2020: D+13.2 2016: D+7.2 2012: D+6.0 2008: D+5.1
Not yet ingested
- Civics
- —
Market trends
- HPI YoY
- ▼ -1.54%
- Current HPI
- 170.4053
- Rent YoY
- —
- Metro
- Birmingham-Hoover, AL
- State GDP YoY
- ▲ 2.94%
- F500 in state
- 4
Industry mix (Fortune 500 HQ in AL)
| Industry | F500 HQs | Revenue |
|---|---|---|
| Financial Services | 1 | $8B |
|
||
| Healthcare | 1 | $5B |
|
||
Price history
-17.5% since first listed6 events — show timeline
- 2026-04-18 Price Changed $40,000 Greater Alabama MLS
- 2026-02-13 Price Changed $55,000 Greater Alabama MLS
- 2025-11-05 Listed $60,000 Greater Alabama MLS
- 2022-08-16 Sold (MLS) $40,000 Greater Alabama MLS
- 2022-08-15 Pending — Greater Alabama MLS
- 2022-07-18 Listed $48,500 Greater Alabama MLS
Property tax history
+12.7%/yrLatest (2025): $912 · +0.0% YoY. Source: county tax records.
Cash-flow waterfall
monthlySold comps — $/sqft
last 12 mo · ≤1 miLoading sold comps…