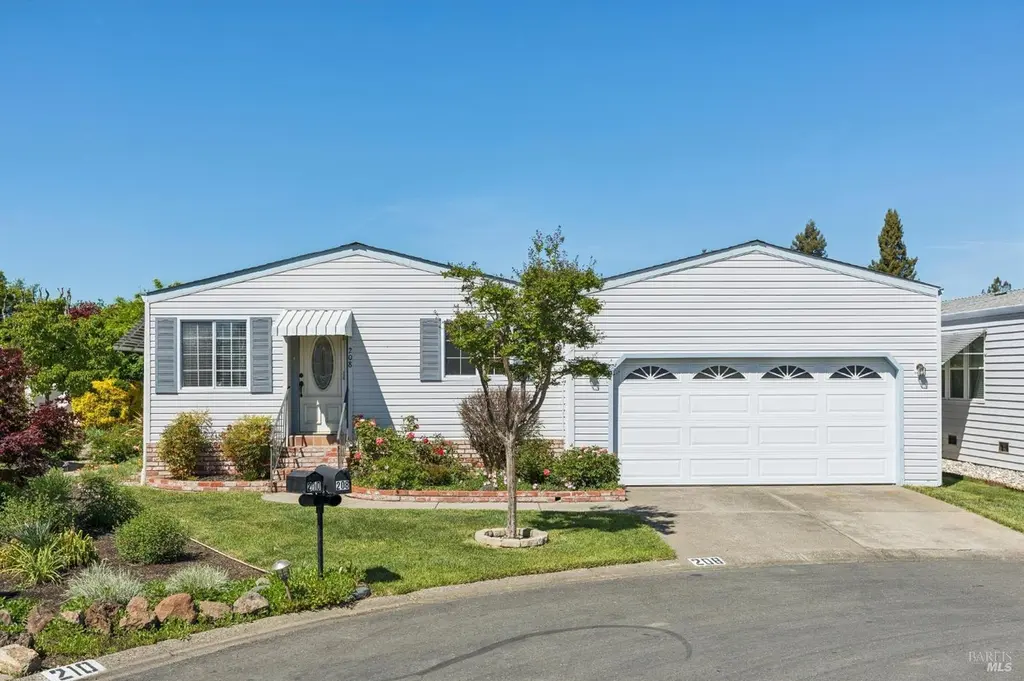
208 Betsy Pl · Napa, CA
Flood risk 5/10 · Moderate
- FEMA flood zone
- X (unshaded)
- Chance of flooding over 30 yrs
- 0.58%
- Est. flood insurance / yr
- $507 – $1,088
Fire risk 5/10 · Moderate
- Est. fire insurance / yr
- $659 – $1,223
Heat risk 5/10 · Moderate
- Hot days now (above 96°F)
- 7 days/yr
- Hot days in 30 yrs
- 15 days/yr
Wind risk 1/10 · Minimal
- Chance of severe wind over 30 yrs
- —
Air-quality risk 9/10 · Severe
- Unhealthy air days now
- 16 days/yr
- Unhealthy air days in 30 yrs
- 17 days/yr
Risk factors via First Street. Map © Google.
Why this score? — see what drove the D grade
The composite is a weighted blend of 9 inputs, each scored 0–100. Each bar is that input's sub-score; the figure is the points it added to the 100-point composite (weight × sub-score).
- Cash flow +17.8/30.0
- DSCR +5.6/10.0
- 1% rule +4.8/10.0
- Schools +4.0/10.0
- Livability +3.5/5.0
- Condition / age +2.5/5.0
- Rent growth +2.4/5.0
- ARV discount +0.0/15.0
- Appreciation +0.0/10.0
$295,000
🖨 Deal sheet 📄 Offer letter ✓ Due diligence
Listing remarks MLS
Desirable Oaktree Vineyard 55+ Park in North Napa located on a quiet Cul-de-Sac close to clubhouse and community pool, previously remodeled light and bright 2 bedroom 2 bath home featuring open concept floorplan including updated kitchen with stainless appliances opening to dining/family room & living room, vaulted ceilings with exposed beams, wood and tile flooring, private outdoor covered patio and lawn area & 2 car attached garage. Additional features include recent interior paint, central air and heat, ceiling fans & window coverings located in a fantastic area of Napa steps away from the Vine Trail & minutes to shopping and dining!
Key facts
- Garage
- Built 1984
- Listed 66 days
Neighborhood map
What this means for you Summary
Snapshot
- This is a 2-bed/2.0-bath manufactured listed at $295k.
Deal economics
- At list price, monthly cash flow is $245 ($3k/yr) — positive.
- The deal already cash-flows at list — no discount required.
- To meet the 1% rule (rent ≥ 1% of price), the offer needs to be $289k (2.0% below list).
- Recommended offer: $277k (6.0% below list) — sets the bar for market timing.
- Cap rate 7.3% vs local median 2.0% in Napa — top-decile yield for the area; either an underpriced asset or a hidden risk that comps aren't pricing in. Stress-test before assuming the spread holds.
Location & tenants
- Location reads 70/100 on livability (#227 in CA) — a middle-class / working-renter tenant base. Strengths: employment A+, health & safety A+, amenities B+; Watch: commute F, cost of living F.
- Napa Valley Unified (urban): math 35% / reading 48% proficiency, ranked #599 of 1,400 in CA (top 43%) — families likely to look elsewhere, expect single-tenant / working-renter base with shorter leases.
- Market conditions: Rents soft (-0.5%/yr); 538 active listings in the ZIP; 2 comparable units currently listed for rent nearby; high-income renter base; 427 units permitted in Napa County in 2024 (189 in 5+ unit buildings).
- This rent runs 31% of the median local income ($113k/yr) — at the standard rent-burdened threshold; future hikes will face affordability resistance.
Forward outlook
- Local home prices are declining (-3.0%/yr); year-one equity from $2k of loan paydown is wiped out by about $9k of value loss. Plan a longer hold.
- Napa County population projected at +14% by 2050 — modest demand growth; plan on rents tracking national, not racing it.
Negotiation context
- It's been on market 66 days — a 6% lower offer ($277k) is reasonable based on typical stale-listing flexibility.
Risks & watch-outs
- Climate carrying-cost: moderate flood risk; moderate wildfire risk; extreme-heat days projected 7→15/yr by 2055 (HVAC capex compounding) — expect insurance premiums to compound above CPI over the hold.
Questions for the listing agent
- It's been on market 66 days. Have you received any prior offers? Is the seller open to a 6% concession, seller financing, or rate buy-down credit?
- Why hasn't it sold? Are there any deal-killer items the seller is aware of (foundation, flood, title, zoning, code violations)?
- Is there a deadline driving the sale (1031 exchange, divorce, estate, relocation)? That informs how much negotiation room exists.
- The area grade is low — what's the realistic commute time and amenity access for the typical tenant pool here? Any planned neighborhood developments (good or bad) we should know about?
- What's the average days-on-market for RENTAL listings here right now (not sales)? A rising rental-DOM trend means longer vacancies and softer asking-rent achievability than the comps imply.
- What's the recent tenant-quality profile in this submarket — average credit score on applications, eviction rate, late-payment / NSF rate, and stable-employment percentage? A property-management company in the area should have these aggregated.
- How much new for-sale + rental construction is in the pipeline within 1–3 miles? Heavy new supply typically softens prices + rents 12–24 months out; constrained supply supports both.
Investment metrics
- 1% rule
- 0.98% ✗
- Cap rate
- 7.29%
- Cash-on-cash
- 3.56%
- DSCR
- 1.16
- GRM
- 8.5
CMA / ARV
- ARV (median comp)
- $238,421
- List price
- $295,000
- Delta
- 23.73%
- Verdict
- OVERPRICED
- Comps
- 15 within 1.0 mi
Show comp detail 12 sales within ~0.75 mi
| Address | Dist | Beds/Ba | Sqft | Sold | Price | $/sf | Match |
|---|---|---|---|---|---|---|---|
| 206 Shirley Ct | 0.10mi | 2/2.0 | 1,064 (+1%) | 3mo | $249,000 | $234 | 91 |
| 201 Julie Pl | 0.07mi | 2/2.0 | 1,056 (0%) | 17mo | $275,000 | $260 | 83 |
| 236 Reed Cir | 0.37mi | 2/2.0 | 1,040 (-2%) | 1mo | $240,000 | $231 | 79 |
| 5 Falcon Crest Cir | 0.10mi | 2/2.0 | 1,056 (0%) | 23mo | $405,000 | $384 | 77 |
| 107 Mobile Ln | 0.23mi | 2/2.0 | 1,128 (+7%) | 7mo | $170,000 | $151 | 72 |
| 60 Falcon Crest Cir | 0.09mi | 2/2.0 | 1,150 (+9%) | 23mo | $340,000 | $296 | 62 |
| 18 Hacienda Dr | 0.44mi | 2/2.0 | 1,100 (+4%) | 14mo | $265,000 | $241 | 61 |
| 217 Bernadine Pl | 0.11mi | 3/2.0 (+1) | 1,200 (+14%) | 8mo | $305,000 | $254 | 61 |
| 14 Falcon Crest Cir | 0.13mi | 2/2.0 | 1,152 (+9%) | 24mo | $339,000 | $294 | 59 |
| 10 Hacienda Dr | 0.39mi | 2/2.0 | 1,000 (-5%) | 18mo | $199,000 | $199 | 58 |
| 46 Hacienda Dr | 0.38mi | 2/2.0 | 900 (-15%) | 13mo | $80,000 | $89 | 46 |
| 38 Hacienda Dr | 0.38mi | 2/2.0 | 1,200 (+14%) | 23mo | $208,000 | $173 | 40 |
Match score weights: distance 35% · size 25% · config 20% · recency 20%. Top-matched comps best support the ARV.
Projected returns pro-forma
-3.0% appreciation · 0.0% rent growth · sell at horizon
- IRR
- -14.1%
- Equity multiple
- 0.51×
- Total profit
- $-40,603
- Equity at exit
- $43,985
- IRR
- -11.1%
- Equity multiple
- 0.42×
- Total profit
- $-47,800
- Equity at exit
- $25,506
Cash invested: $82,600 (down + closing). Projections, not guarantees.
Landlord ↔ Tenant lean methodology
- Overall (STATE)
- 18 Strongly Tenant-Friendly
- State California
- 18 Strongly Tenant-Friendly · D+13
- County
- — inherits STATE
- City
- — inherits STATE
ZIP-level market 94558
- Rents YoY
- -0.5%
- Active inventory
- 538
- Price-to-rent
- 8.5×
Monthly cashflow live
- Estimated rent
- $2,891 medium interval (Pro) →
- Mortgage (P&I)
- −$1,547
- Tax est. 1.5%
- −$369 /mo · $4,425/yr
- Insurance
- −$123
- HOA
- −$0
- Vacancy / Maint / Mgmt
- −$607
- Net cashflow
- $245
Break-even live
UW: 25.0% down · 7.5% · 30yr · 1.5% tax · 5.0% vac · 8.0% maint · 8.0% mgmt
Financing live
Cash to close
- Down payment
- $73,750
- Closing costs
- $8,850
- Reserves months
- —
- Total cash needed
- —
Loan-product check · same deal, 3 products live
Conventional
25% down · 7.5% · 30yr
- Down + closing
- —
- Monthly P&I
- —
- Monthly cashflow
- —
- DSCR
- —
- Eligible?
- —
Personal DTI + credit; lowest rate.
DSCR
20% down · 8.5% · 30yr
- Down + closing
- —
- Monthly P&I
- —
- Monthly cashflow
- —
- DSCR
- —
- Eligible?
- —
No personal income docs; deal must DSCR.
Hard money
10% down · 12.0% · 12mo
- Down + closing
- —
- Monthly P&I
- —
- Monthly cashflow
- —
- DSCR
- —
- Eligible?
- —
Short-term bridge; refi at stabilization.
Rent comps 2 comps
| Address | Beds | Baths | Sqft | Rent | $/sqft | DOM | Units | Dist |
|---|---|---|---|---|---|---|---|---|
| 3663 Solano Ave Napa, CA | 1.0–3.0 | 1.0–2.0 | 1122 | $2,742 | $2.44 | 13d | 7 | 0.97mi |
| 3225 Macfadden St Napa, CA | 3.0 | 2.0 | 1375 | $3,300 | $2.40 | 43d | 1 | 1.43mi |
Listing history 16 events
-
2026-06-16status $295,000 Pending 66 DOM
-
2026-06-15days on market $295,000 Contingent (Show) 66 DOM
-
2026-06-14days on market $295,000 Contingent (Show) 64 DOM
-
2026-06-13days on market $295,000 Contingent (Show) 63 DOM
-
2026-06-10days on market $295,000 Contingent (Show) 61 DOM
-
2026-06-09days on market $295,000 Contingent (Show) 60 DOM
-
2026-06-08days on market $295,000 Contingent (Show) 59 DOM
-
2026-06-07days on market $295,000 Contingent (Show) 58 DOM
-
2026-06-05days on market $295,000 Contingent (Show) 55 DOM
-
2026-06-03days on market $295,000 Contingent (Show) 54 DOM
-
2026-06-03status $295,000 Contingent (Show) 53 DOM
-
2026-06-02days on market $295,000 Active 53 DOM
-
2026-06-01days on market $295,000 Active 52 DOM
-
2026-05-31days on market $295,000 Active 51 DOM
-
2026-05-30days on market $295,000 Active 50 DOM
-
2026-04-10$295,000 Active 660-char remark
Show marketing remark (660 chars)
Desirable Oaktree Vineyard 55+ Park in North Napa located on a quiet Cul-de-Sac close to clubhouse and community pool, previously remodeled light and bright 2 bedroom 2 bath home featuring open concept floorplan including updated kitchen with stainless appliances opening to dining/family room & living room, vaulted ceilings with exposed beams, wood and tile flooring, private outdoor covered patio and lawn area & 2 car attached garage. Additional features include recent interior paint, central air and heat, ceiling fans & window coverings located in a fantastic area of Napa steps away from the Vine Trail & minutes to shopping and dining!
ⓘ Source: listings_history table (triggers on properties + properties_extension) + one-shot
backfill from property_details.listing_events for pre-trigger history.
Climate risk First Street
- Flood 5/10 Major FEMA zone X (unshaded) · 58% chance over 30 yrs
- Wildfire 5/10 Major
- Heat 5/10 Major 7 d/yr ≥96°F today · 15 d/yr by 30 yrs out
- Wind 1/10 Low
- Air quality 9/10 Extreme 16 unhealthy d/yr today · 17 by 30 yrs out
Nearby sold comps map
Loading sold comps map…
Walkable amenities ~0.75 mi
Loading nearby amenities…
Taxation est. · year 1
- Rental income
- $34,695
- − Mortgage interest
- −$16,525
- − Property taxes
- −$4,425
- − Insurance
- −$1,475
- − Repairs & maintenance
- −$2,776
- − Management
- −$2,776
- − Depreciation
- −$8,582
- Taxable loss
- −$1,863
- Est. tax savings @ 24.0%
- +$447
- After-tax cash flow
- $3,392/yr
For passive investors: Depreciation is non-cash, so a rental often shows a tax loss while cash-flowing — sheltering income. Rental losses are passive: they offset passive income freely, and up to $25,000/yr can offset ordinary (W-2) income if you actively participate and your MAGI is under $100k (phasing out to $0 by $150k); unused losses carry forward. On sale, claimed depreciation is recaptured at up to 25%, and gains may owe capital-gains tax (a 1031 exchange can defer both). Figures are a year-1 estimate at your 24.0% rate — not tax advice; consult a CPA.
Schools (NCES district)
- District
- Napa Valley Unified
- NCES district ID
- 0626640
- Math proficiency
- 35% ▲ 1.00%
- Reading proficiency
- 48% ▲ 2.00%
- Median HH income
- $72,007
- Composite
- 40.18/100
- National rank
- #7827
- State rank
- #599 of 1400 in CA
Livability — Napa
- Score
- 70/100
- State rank
- #227
- US rank
- #7435
Category grades
Schools grade is shown separately in the Schools card above.
Census & demographics
- Census place
- Napa, CA
- County
- Napa County · 120,669 people
- City population
- 91,371
- Metro
- Napa, CA
- Population (ZIP)
- 63,657
- Household income
- $113,269
- Rent vs Own
- Severe rent burden
- 2095.0
Population outlook (Napa County) Hauer SSP2
- Today (2025)
- 153,987 people
- By 2030
- 159,490 · +3.6%
- By 2040
- 168,796 · +9.6%
- By 2050
- 176,213 · +14.4%
- By 2075
- 190,113 · +23.5%
- By 2100
- 190,528 · +23.7%
Race, ethnicity, and origin ACS 2023
- Neighborhood character
- Diverse neighborhood (Simpson 0.56)
- Race & ethnicity
- White 54% Hispanic / Latino 37% Two or more races 15% Asian 3% Native American 1%
- Hispanic origin (detail)
- Mexican 31%
- Common ancestry
- Italian 4% Lithuanian 2% Portuguese 2%
- Foreign-born
- 21% · Canada
- Languages at home
- 68% English-only · Spanish 28% Other Indo-European 1% Tagalog/Filipino 1%
Political lean MEDSL · Napa
- 2024 margin
- Solid D (+34.9) · D 65.9% · R 31.1% · Other 3.0%
- 2008→2024 swing
- +2.4pp toward D · 2008: 32.5pp · 2024: 34.9pp
- All cycles
- 2024: D+34.9 2020: D+40.4 2016: D+35.2 2012: D+25.7 2008: D+32.5
Not yet ingested
- Civics
- —
Market trends
- HPI YoY
- ▼ -842.94%
- Current HPI
- 296.0661
- Rent YoY
- ▼ -0.50%
- Metro
- Napa, CA
- State GDP YoY
- ▲ 3.21%
- F500 in state
- 116
Industry mix (Fortune 500 HQ in CA)
| Industry | F500 HQs | Revenue |
|---|---|---|
| Technology | 27 | $1,492B |
|
||
| Financial Services | 3 | $174B |
|
||
| Retail | 3 | $44B |
|
||
| Insurance | 3 | $26B |
|
||
| Media / Entertainment | 2 | $115B |
|
||
| Pharmaceuticals / Biotech | 2 | $62B |
|
||
Price history
1 event — show timeline
- 2026-04-10 Listed $295,000 BAREIS
Property tax history
+1.9%/yrLatest (2025): $466 · +21.5% YoY. Source: county tax records.
Cash-flow waterfall
monthlySold comps — $/sqft
last 12 mo · ≤1 miLoading sold comps…