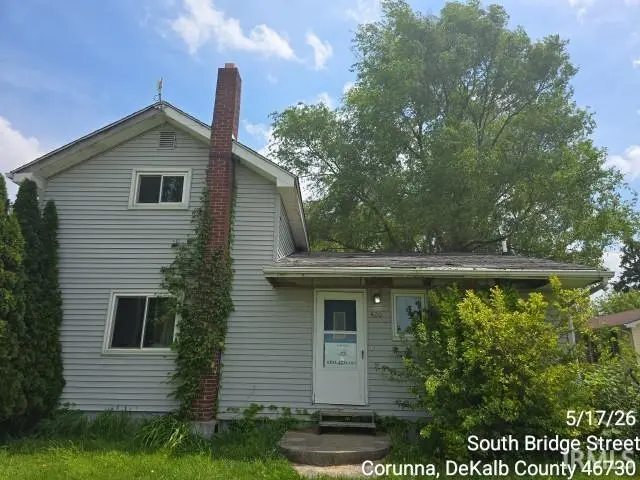
420 S Bridge St · Corunna, IN
Flood risk 1/10 · Minimal
- FEMA flood zone
- X (unshaded)
- Chance of flooding over 30 yrs
- 0.0%
- Est. flood insurance / yr
- $507 – $1,088
Fire risk 1/10 · Minimal
- Est. fire insurance / yr
- $717 – $1,331
Heat risk 2/10 · Minimal
- Hot days now (above 100°F)
- 7 days/yr
- Hot days in 30 yrs
- 17 days/yr
Wind risk 2/10 · Minimal
- Chance of severe wind over 30 yrs
- —
Air-quality risk 2/10 · Minimal
- Unhealthy air days now
- 1 days/yr
- Unhealthy air days in 30 yrs
- 2 days/yr
Risk factors via First Street. Map © Google.
Why this score? — see what drove the B- grade
The composite is a weighted blend of 9 inputs, each scored 0–100. Each bar is that input's sub-score; the figure is the points it added to the 100-point composite (weight × sub-score).
- Cash flow +18.0/30.0
- ARV discount +15.0/15.0
- Appreciation +10.0/10.0
- DSCR +5.6/10.0
- 1% rule +5.0/10.0
- Schools +3.9/10.0
- Livability +3.0/5.0
- Rent growth +2.5/5.0
- Condition / age +2.5/5.0
$110,000
🖨 Deal sheet 📄 Offer letter ✓ Due diligence
Listing remarks
Desirable & cozy home in a Country setting yet a short drive to all the City amenities needed for everyday life - 2/3 BR with primary bedroom on the main floor - upstairs bedroom & loft area - living room & dining room - spacious kitchen for the overall size of the house - partial basement for storage and workshop - 1/2 acre lot to enjoy in the warmer seasons! Detached garage for all your tools and toys or a small car or tractor. Sold as-is. Taxes may change based on exemptions or lack thereof. * Sale Subject to seller addendum. EMD to be 5% or $5000 whichever is greater & held w/ title co. Subject to OFAC clearance. A viewing release must be signed and returned to o
Key facts
- Upstairs bedroom
- 1/2 acre lot
- Spacious kitchen
Tags
Property features AI
Finance
- Other: Subdivision: McMillen(s)
Exterior
- Parking: Detached 1-car garage
- Utilities: Public water; Public sewer
- Home design: Single-family residential site-built home; 2 stories
- Construction: Vinyl siding and other exterior materials; Foundation includes brick/mortar, concrete perimeter, block, and stone; Asphalt roof
- Exterior features: Partial fencing; Level lot; Lot dimensions approximately 66 x 300
Interior
- Bedrooms: Total of 6 rooms (bedroom count not specified)
- Flooring: Hardwood; Carpet; Laminate; Vinyl
- Bathrooms: 1 full bathroom (main level)
- Heating & cooling: Forced air heating (propane); Ceiling fan cooling
- Interior features: Entrance foyer; Ceiling fans
- Laundry & utility: Laundry on the main level and in the basement; Partial basement
Neighborhood map
What this means for you Summary
Snapshot
- This is a 2-bed/1.0-bath single-family listed at $110k.
Deal economics
- At list price, monthly cash flow is $95 ($1k/yr) — positive.
- The deal already cash-flows at list — no discount required.
- To meet the 1% rule (rent ≥ 1% of price), the offer needs to be $110k (0.0% below list).
- Recommended offer: $108k (1.5% below list) — sets the bar for market timing.
Location & tenants
- Location reads 59/100 on livability (#563 in IN) — a working-class tenant base; expect higher turnover. Strengths: cost of living A+, housing A+; Watch: crime D, amenities F, commute F.
- Dekalb County Ctl United School District (town): math 42% / reading 50% proficiency, ranked #91 of 301 in IN (top 30%) — families likely to look elsewhere, expect single-tenant / working-renter base with shorter leases.
- Zoned schools: Country Meadow Elementary School (math 47% / reading 37%, grade F, #434 of 994 statewide, top 48%, 314 students, 43% FRL); Dekalb Middle School (math 34% / reading 52%, grade D-, #92 of 330 statewide, top 29%, 800 students, 47% FRL); Dekalb High School (math 43% / reading 70%, grade C, #70 of 369 statewide, top 19%, 1,075 students, 36% FRL).
- Market conditions: 5 active listings in the ZIP; 116 units permitted in DeKalb County in 2024 (0 in 5+ unit buildings).
Forward outlook
- In year one you build about $12k of equity ($761 loan paydown + $11k appreciation (10.0% local appreciation)).
- DeKalb County population projected to shrink 9% by 2050 — rents likely to lag national; underwrite the cash flow, not the appreciation.
- At projected returns (10.0% appreciation + 3.0% rent growth), your $31k cash investment doubles in ~3 years — after that, you're playing with house money.
- By year 4, paydown + projected appreciation supports a ~$42k cash-out refi (75% LTV) — recoverable capital for the next deal without selling this one.
Negotiation context
- It's been on market 27 days — a 2% lower offer ($108k) is reasonable based on typical stale-listing flexibility.
Risks & watch-outs
- Watch-outs: built in 1900 — expect roof / HVAC / electrical / plumbing capex.
Questions for the listing agent
- Built in 1900 — when were the roof, HVAC, electrical panel, plumbing, and water heater last replaced?
- Is there a deadline driving the sale (1031 exchange, divorce, estate, relocation)? That informs how much negotiation room exists.
- Schools are F-rated, which usually means shorter tenancies and higher turnover. Who's the typical renter profile here, and what's been the actual vacancy rate?
- Crime grade is D in this area — have there been break-ins, vandalism, or insurance claims at this property in the last 3 years? What carrier currently insures it and at what premium?
- What's the average days-on-market for RENTAL listings here right now (not sales)? A rising rental-DOM trend means longer vacancies and softer asking-rent achievability than the comps imply.
- What's the recent tenant-quality profile in this submarket — average credit score on applications, eviction rate, late-payment / NSF rate, and stable-employment percentage? A property-management company in the area should have these aggregated.
- How much new for-sale + rental construction is in the pipeline within 1–3 miles? Heavy new supply typically softens prices + rents 12–24 months out; constrained supply supports both.
Investment metrics
- 1% rule
- 1.00% ✗
- Cap rate
- 7.32%
- Cash-on-cash
- 3.68%
- DSCR
- 1.16
- GRM
- 8.3
CMA / ARV
- ARV (on-the-fly)
- $206,208
- Comps found
- 2
Show comp detail 2 sales within ~0.75 mi
| Address | Dist | Beds/Ba | Sqft | Sold | Price | $/sf | Match |
|---|---|---|---|---|---|---|---|
| 203 Depot St | 0.21mi | 2/1.5 | 1,317 (-8%) | 23mo | $190,000 | $144 | 56 |
| 227 Michigan Ave | 0.33mi | 3/1.0 (+1) | 1,259 (-12%) | 24mo | $145,000 | $115 | 39 |
Match score weights: distance 35% · size 25% · config 20% · recency 20%. Top-matched comps best support the ARV.
Projected returns pro-forma
10.0% appreciation · 3.0% rent growth · sell at horizon
- IRR
- 26.9%
- Equity multiple
- 3.14×
- Total profit
- $65,957
- Equity at exit
- $99,097
- IRR
- 23.6%
- Equity multiple
- 7.15×
- Total profit
- $189,545
- Equity at exit
- $213,706
Cash invested: $30,800 (down + closing). Projections, not guarantees.
Landlord ↔ Tenant lean methodology
- Overall (STATE)
- 90 Strongly Landlord-Friendly
- State Indiana
- 90 Strongly Landlord-Friendly · R+11
- County
- — inherits STATE
- City
- — inherits STATE
ZIP-level market 46730
- Home prices YoY
- 10.8%
- Active inventory
- 5
- Price-to-rent
- 8.3×
Monthly cashflow live
- Estimated rent
- $1,099 medium interval (Pro) →
- Mortgage (P&I)
- −$577
- Tax from tax record
- −$151 /mo · $1,816/yr
- Insurance
- −$46
- HOA
- −$0
- Vacancy / Maint / Mgmt
- −$231
- Net cashflow
- $95
Break-even live
UW: 25.0% down · 7.5% · 30yr · 1.5% tax · 5.0% vac · 8.0% maint · 8.0% mgmt
Financing live
Cash to close
- Down payment
- $27,500
- Closing costs
- $3,300
- Reserves months
- —
- Total cash needed
- —
Loan-product check · same deal, 3 products live
Conventional
25% down · 7.5% · 30yr
- Down + closing
- —
- Monthly P&I
- —
- Monthly cashflow
- —
- DSCR
- —
- Eligible?
- —
Personal DTI + credit; lowest rate.
DSCR
20% down · 8.5% · 30yr
- Down + closing
- —
- Monthly P&I
- —
- Monthly cashflow
- —
- DSCR
- —
- Eligible?
- —
No personal income docs; deal must DSCR.
Hard money
10% down · 12.0% · 12mo
- Down + closing
- —
- Monthly P&I
- —
- Monthly cashflow
- —
- DSCR
- —
- Eligible?
- —
Short-term bridge; refi at stabilization.
Listing history 17 events
-
2026-06-18days on market $110,000 Active 27 DOM
-
2026-06-17days on market $110,000 Active 26 DOM
-
2026-06-16days on market $110,000 Active 25 DOM
-
2026-06-15days on market $110,000 Active 24 DOM
-
2026-06-13days on market $110,000 Active 22 DOM
-
2026-06-12days on market $110,000 Active 21 DOM
-
2026-06-09days on market $110,000 Active 18 DOM
-
2026-06-08days on market $110,000 Active 17 DOM
-
2026-06-07days on market $110,000 Active 16 DOM
-
2026-06-07days on market $110,000 Active 15 DOM
-
2026-06-04days on market $110,000 Active 12 DOM
-
2026-06-02days on market $110,000 Active 11 DOM
-
2026-06-01remarks 683-char remark
-
2026-06-01days on market $110,000 Active 10 DOM
-
2026-05-31days on market $110,000 Active 9 DOM
-
2026-05-31days on market $110,000 Active 8 DOM
-
2026-05-20$110,000 Active
ⓘ Source: listings_history table (triggers on properties + properties_extension) + one-shot
backfill from property_details.listing_events for pre-trigger history.
Tax reassessment forecast IN · Partial reset (capped growth)
- Current annual tax
- $1,816 · $151/mo
- Projected year-2 tax
- $1,816 · $151/mo
- Expected delta
- $0/yr ($0/mo · 0.0%)
ⓘ Screening estimate from a state-policy table — verify with the county assessor before closing.
Climate risk First Street
- Flood 1/10 Low FEMA zone X (unshaded) · 0% chance over 30 yrs
- Wildfire 1/10 Low
- Heat 2/10 Low 7 d/yr ≥100°F today · 17 d/yr by 30 yrs out
- Wind 2/10 Low
- Air quality 2/10 Low 1 unhealthy d/yr today · 2 by 30 yrs out
Nearby sold comps map
Loading sold comps map…
Walkable amenities ~0.75 mi
Loading nearby amenities…
Taxation est. · year 1
- Rental income
- $13,194
- − Mortgage interest
- −$6,162
- − Property taxes
- −$1,816
- − Insurance
- −$550
- − Repairs & maintenance
- −$1,055
- − Management
- −$1,055
- − Depreciation
- −$3,200
- Taxable loss
- −$645
- Est. tax savings @ 24.0%
- +$155
- After-tax cash flow
- $1,290/yr
For passive investors: Depreciation is non-cash, so a rental often shows a tax loss while cash-flowing — sheltering income. Rental losses are passive: they offset passive income freely, and up to $25,000/yr can offset ordinary (W-2) income if you actively participate and your MAGI is under $100k (phasing out to $0 by $150k); unused losses carry forward. On sale, claimed depreciation is recaptured at up to 25%, and gains may owe capital-gains tax (a 1031 exchange can defer both). Figures are a year-1 estimate at your 24.0% rate — not tax advice; consult a CPA.
Schools (NCES district)
- District
- Dekalb County Ctl United School District
- NCES district ID
- 1801590
- Math proficiency
- 42% ▼ -7.00%
- Reading proficiency
- 50% ▼ -7.00%
- Median HH income
- $48,100
- Composite
- 39.26/100
- National rank
- #4000
- State rank
- #91 of 301 in IN
Livability — Corunna
- Score
- 59/100
- State rank
- #563
- US rank
- #20215
Category grades
Schools grade is shown separately in the Schools card above.
Census & demographics
- Census place
- Corunna, IN
- Population (ZIP)
- 1,183
Population outlook (DeKalb County) Hauer SSP2
- Today (2025)
- 42,875 people
- By 2030
- 42,678 · -0.5%
- By 2040
- 41,494 · -3.2%
- By 2050
- 38,939 · -9.2%
- By 2075
- 31,457 · -26.6%
- By 2100
- 20,780 · -51.5%
Race, ethnicity, and origin ACS 2023
- Neighborhood character
- Predominantly White (98%)
- Race & ethnicity
- White 98% Hispanic / Latino 1% Two or more races 1%
- Common ancestry
- Italian 4% Iranian 2% Romanian 2%
- Foreign-born
- 1%
- Languages at home
- 99% English-only · Arabic 1%
Political lean MEDSL · DeKalb
- 2024 margin
- Solid R (+47.1) · D 25.6% · R 72.7% · Other 1.7%
- 2008→2024 swing
- -31.9pp toward R · 2008: -15.2pp · 2024: -47.1pp
- All cycles
- 2024: R+47.1 2020: R+47.2 2016: R+48.2 2012: R+31.7 2008: R+15.2
Not yet ingested
- Civics
- —
Market trends
- HPI YoY
- ▲ 25.25%
- Current HPI
- 259.5444
- Rent YoY
- —
- Metro
- —
- State GDP YoY
- ▲ 2.90%
- F500 in state
- 18
Industry mix (Fortune 500 HQ in IN)
| Industry | F500 HQs | Revenue |
|---|---|---|
| Industrial Machinery | 2 | $37B |
|
||
| Healthcare | 1 | $177B |
|
||
| Pharmaceuticals | 1 | $45B |
|
||
| Metals / Steel | 1 | $18B |
|
||
| Agriculture | 1 | $17B |
|
||
| Packaging | 1 | $12B |
|
||
Price history
1 event — show timeline
- 2026-05-20 Listed $110,000 IRMLS
Property tax history
-0.7%/yrLatest (2024): $1,816 · -0.9% YoY. Source: county tax records.
Cash-flow waterfall
monthlySold comps — $/sqft
last 12 mo · ≤1 miLoading sold comps…