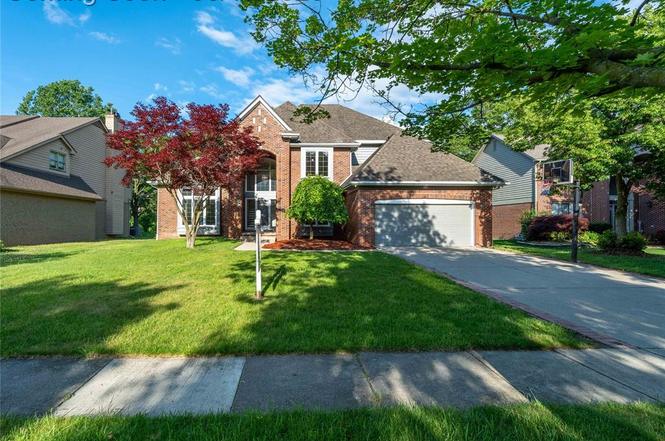
7386 Woodlore Dr · West Bloomfield, MI
Flood risk 1/10 · Minimal
- FEMA flood zone
- X (unshaded)
- Chance of flooding over 30 yrs
- 0.0%
- Est. flood insurance / yr
- $473 – $860
Fire risk 1/10 · Minimal
- Est. fire insurance / yr
- $784 – $1,456
Heat risk 2/10 · Minimal
- Hot days now (above 96°F)
- 7 days/yr
- Hot days in 30 yrs
- 15 days/yr
Wind risk 2/10 · Minimal
- Chance of severe wind over 30 yrs
- —
Air-quality risk 3/10 · Minor
- Unhealthy air days now
- 2 days/yr
- Unhealthy air days in 30 yrs
- 4 days/yr
Risk factors via First Street. Map © Google.
Why this score? — see what drove the F grade
The composite is a weighted blend of 9 inputs, each scored 0–100. Each bar is that input's sub-score; the figure is the points it added to the 100-point composite (weight × sub-score).
- ARV discount +11.9/15.0
- Appreciation +5.0/10.0
- Schools +5.0/10.0
- Rent growth +2.5/5.0
- Livability +2.5/5.0
- Condition / age +2.5/5.0
- Cash flow +0.0/30.0
- 1% rule +0.0/10.0
- DSCR +0.0/10.0
$599,900
🖨 Deal sheet 📄 Offer letter ✓ Due diligence
Listing remarks
Nestled in the highly sought after Parkridge community and served by the award winning Walled Lake School District, this exceptional home offers the perfect combination of elegance and everyday comfort. Featuring 4 spacious bedrooms, 3 full bathrooms, and 1 half bath, the thoughtfully designed layout welcomes you with a dramatic foyer and entryway highlighted by soaring ceilings that create a bright and grand first impression. The open concept main level showcases beautiful large format tile flooring throughout, while the spacious kitchen flows seamlessly into the inviting family room, highlighted by a cozy gas fireplace, creating the perfect space for gathering and entertaining. Upstairs,
Key facts
- Cozy gas fireplace
- Soaring ceilings
- Walk in closet
Tags
Property features AI
Finance
- Other: Lot about 0.32 acres
Exterior
- Parking: Attached 2-car garage
- Utilities: Natural gas heat fuel; Public water; Public sewer (implied by public water and typical utilities)
- Home design: Residential 2-story home; Built in 1994; Entry-level main living areas
- Construction: Basement foundation
- Exterior features: Brick exterior; Paved street frontage; Frontage approximately 80 feet
Interior
- Kitchen: Kitchen on entry level (approximate dimension 13 x 11)
- Bedrooms: Four bedrooms located on the second floor (approximate dimensions: 22 x 15; 14 x 11; 12 x 11; one listed as 12 wide)
- Bathrooms: Three full bathrooms and one lavatory (total 4); at least one full bath in the basement; lavatory at entry; additional baths on the second floor
- Heating & cooling: Forced air heating; Central air conditioning
- Interior features: Finished basement
- Laundry & utility: Basement present (finished) — likely houses utilities/laundry
Neighborhood map
What this means for you Summary
Snapshot
- This is a 4-bed/3.5-bath single-family listed at $600k.
Deal economics
- At list price, monthly cash flow is $-3k ($-36k/yr) — negative.
- To cash-flow at today's rent, offer at most $158k (73.7% below list).
- To meet the 1% rule (rent ≥ 1% of price), the offer needs to be $138k (77.0% below list).
- Recommended offer: $138k (77.0% below list) — sets the bar for 1% rule.
Location & tenants
- Location reads: area grade F — affects rentability + tenant quality, not the cash-flow math above.
- Walled Lake Consolidated Schools (suburban): math 52% / reading 60% proficiency, ranked #58 of 540 in MI (top 11%) — acceptable for families but not a draw, mixed tenant base, ~2y average lease; only 20% free/reduced lunch — higher-income household profile.
- Market conditions: 1 active listings in the ZIP; 2,614 units permitted in Oakland County in 2024 (721 in 5+ unit buildings).
Forward outlook
- In year one you build about $22k of equity ($4k loan paydown + $18k appreciation (3.0% local appreciation)).
- Oakland County population projected at +10% by 2050 — modest demand growth; plan on rents tracking national, not racing it.
- By year 2, paydown + projected appreciation supports a ~$36k cash-out refi (75% LTV) — recoverable capital for the next deal without selling this one.
Negotiation context
- Only 1 days on market — expect competitive offers; lowballing is unlikely to land.
- Current owner paid $445k; 35% above their basis — modest negotiation headroom, anchor on the comps not their cost.
Questions for the listing agent
- What do current leases actually rent for vs. the listed asking? Can we see a recent rent roll and the last 12 months of T-12 income?
- Is there a deadline driving the sale (1031 exchange, divorce, estate, relocation)? That informs how much negotiation room exists.
- The area grade is low — what's the realistic commute time and amenity access for the typical tenant pool here? Any planned neighborhood developments (good or bad) we should know about?
- What's the average days-on-market for RENTAL listings here right now (not sales)? A rising rental-DOM trend means longer vacancies and softer asking-rent achievability than the comps imply.
- What's the recent tenant-quality profile in this submarket — average credit score on applications, eviction rate, late-payment / NSF rate, and stable-employment percentage? A property-management company in the area should have these aggregated.
- How much new for-sale + rental construction is in the pipeline within 1–3 miles? Heavy new supply typically softens prices + rents 12–24 months out; constrained supply supports both.
Investment metrics
- 1% rule
- 0.23% ✗
- Cap rate
- 0.30%
- Cash-on-cash
- -21.40%
- DSCR
- 0.05
- GRM
- 36.2
CMA / ARV
- ARV (on-the-fly)
- $665,160
- Comps found
- 10
Show comp detail 10 sales within ~0.75 mi
| Address | Dist | Beds/Ba | Sqft | Sold | Price | $/sf | Match |
|---|---|---|---|---|---|---|---|
| 7359 Woodlore Dr | 0.06mi | 4/3.0 | 4,905 (+2%) | 6mo | $600,000 | $122 | 88 |
| 4651 Rosewood Ln | 0.18mi | 4/3.5 | 4,783 (-1%) | 12mo | $658,000 | $138 | 80 |
| 7240 Silverbeech Ln | 0.05mi | 4/3.5 | 5,093 (+6%) | 10mo | $640,000 | $126 | 80 |
| 7565 Windgate Cir | 0.47mi | 4/4.0 | 4,904 (+2%) | 7mo | $800,000 | $163 | 68 |
| 7080 Colony Dr | 0.61mi | 4/4.5 | 4,846 (+0%) | 1mo | $1,750,000 | $361 | 66 |
| 7850 Timberlane Trl | 0.39mi | 4/3.5 | 4,523 (-6%) | 13mo | $599,000 | $132 | 60 |
| 7549 Acorn Hill Ct | 0.34mi | 4/3.0 | 4,408 (-8%) | 13mo | $550,000 | $125 | 57 |
| 7657 Windgate Cir | 0.49mi | 4/3.5 | 4,198 (-13%) | 0mo | $450,000 | $107 | 55 |
| 7092 S Oak Ct E | 0.61mi | 4/4.0 | 5,075 (+5%) | 12mo | $850,000 | $167 | 51 |
| 7555 Windgate Cir | 0.45mi | 5/4.5 (+1) | 4,167 (-14%) | 1mo | $640,000 | $154 | 46 |
Match score weights: distance 35% · size 25% · config 20% · recency 20%. Top-matched comps best support the ARV.
Projected returns pro-forma
3.0% appreciation · 3.0% rent growth · sell at horizon
- IRR
- -12.1%
- Equity multiple
- 0.29×
- Total profit
- $-118,511
- Equity at exit
- $269,741
- IRR
- -5.8%
- Equity multiple
- 0.08×
- Total profit
- $-154,469
- Equity at exit
- $415,703
Cash invested: $167,972 (down + closing). Projections, not guarantees.
Landlord ↔ Tenant lean methodology
- Overall (STATE)
- 62 Landlord-Friendly
- State Michigan
- 62 Landlord-Friendly · EVEN
- County
- — inherits STATE
- City
- — inherits STATE
ZIP-level market 48323 1390
- Active inventory
- 1
- Price-to-rent
- 36.2×
Monthly cashflow live
- Estimated rent
- $1,382 medium interval (Pro) →
- Mortgage (P&I)
- −$3,146
- Tax from tax record
- −$691 /mo · $8,288/yr
- Insurance
- −$250
- HOA
- −$0
- Vacancy / Maint / Mgmt
- −$290
- Net cashflow
- $-2,995
Break-even live
UW: 25.0% down · 7.5% · 30yr · 1.5% tax · 5.0% vac · 8.0% maint · 8.0% mgmt
Financing live
Cash to close
- Down payment
- $149,975
- Closing costs
- $17,997
- Reserves months
- —
- Total cash needed
- —
Loan-product check · same deal, 3 products live
Conventional
25% down · 7.5% · 30yr
- Down + closing
- —
- Monthly P&I
- —
- Monthly cashflow
- —
- DSCR
- —
- Eligible?
- —
Personal DTI + credit; lowest rate.
DSCR
20% down · 8.5% · 30yr
- Down + closing
- —
- Monthly P&I
- —
- Monthly cashflow
- —
- DSCR
- —
- Eligible?
- —
No personal income docs; deal must DSCR.
Hard money
10% down · 12.0% · 12mo
- Down + closing
- —
- Monthly P&I
- —
- Monthly cashflow
- —
- DSCR
- —
- Eligible?
- —
Short-term bridge; refi at stabilization.
Listing history 2 events
-
2026-06-17remarks 699-char remark
-
2026-06-17$599,900 Coming Soon 1 DOM
ⓘ Source: listings_history table (triggers on properties + properties_extension) + one-shot
backfill from property_details.listing_events for pre-trigger history.
Tax reassessment forecast MI · Partial reset (capped growth)
- Current annual tax
- $8,288 · $691/mo
- Projected year-2 tax
- $8,763 · $730/mo
- Expected delta
- +$475/yr (+$40/mo · 5.7%)
ⓘ Screening estimate from a state-policy table — verify with the county assessor before closing.
Climate risk First Street
- Flood 1/10 Low FEMA zone X (unshaded) · 0% chance over 30 yrs
- Wildfire 1/10 Low
- Heat 2/10 Low 7 d/yr ≥96°F today · 15 d/yr by 30 yrs out
- Wind 2/10 Low
- Air quality 3/10 Moderate 2 unhealthy d/yr today · 4 by 30 yrs out
Nearby sold comps map
Loading sold comps map…
Walkable amenities ~0.75 mi
Loading nearby amenities…
Taxation est. · year 1
- Rental income
- $16,578
- − Mortgage interest
- −$33,604
- − Property taxes
- −$8,288
- − Insurance
- −$3,000
- − Repairs & maintenance
- −$1,326
- − Management
- −$1,326
- − Depreciation
- −$17,452
- Taxable loss
- −$48,417
- Est. tax savings @ 24.0%
- +$11,620
- After-tax cash flow
- $-24,322/yr
For passive investors: Depreciation is non-cash, so a rental often shows a tax loss while cash-flowing — sheltering income. Rental losses are passive: they offset passive income freely, and up to $25,000/yr can offset ordinary (W-2) income if you actively participate and your MAGI is under $100k (phasing out to $0 by $150k); unused losses carry forward. On sale, claimed depreciation is recaptured at up to 25%, and gains may owe capital-gains tax (a 1031 exchange can defer both). Figures are a year-1 estimate at your 24.0% rate — not tax advice; consult a CPA.
Schools (NCES district)
- District
- Walled Lake Consolidated Schools
- NCES district ID
- 2635160
- Math proficiency
- 52% ▼ -4.00%
- Reading proficiency
- 60% ▼ -1.00%
- Median HH income
- $69,184
- Composite
- 49.57/100
- National rank
- #1987
- State rank
- #58 of 540 in MI
Livability — West Bloomfield
No livability data for this city. (Only ~50 U.S. cities are tracked.)
Census & demographics
No demographic data for this ZIP.
Market trends
- HPI YoY
- —
- Current HPI
- —
- Rent YoY
- —
- Metro
- —
- State GDP YoY
- ▲ 1.37%
- F500 in state
- 28
Industry mix (Fortune 500 HQ in MI)
| Industry | F500 HQs | Revenue |
|---|---|---|
| Automotive Parts | 3 | $48B |
|
||
| Automotive | 2 | $372B |
|
||
| Chemicals | 1 | $45B |
|
||
| Automotive Retail | 1 | $29B |
|
||
| Healthcare / Medical Devices | 1 | $23B |
|
||
| Automotive Technology | 1 | $20B |
|
||
Price history
+46.3% since first listed5 events — show timeline
- 2026-06-17 Coming Soon $599,900 MiRealSource-MiMLS
- 2022-03-31 Sold (Public Records) $445,000 Public Records
- 2009-04-30 Listing Removed — REALCOMP
- 2009-02-26 Listed $385,000 REALCOMP
- 2000-08-11 Sold (Public Records) $410,000 Public Records
Property tax history
-0.2%/yrLatest (2025): $8,288 · +3.2% YoY. Source: county tax records.
Cash-flow waterfall
monthlySold comps — $/sqft
last 12 mo · ≤1 miLoading sold comps…