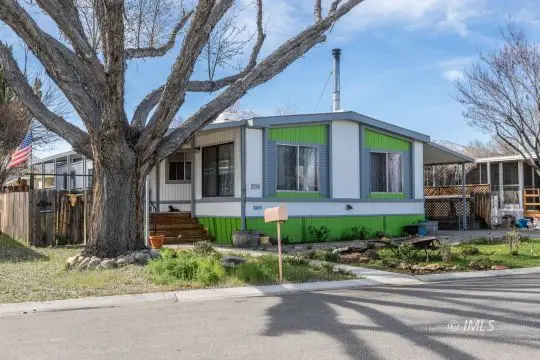
2268 Mcgalliard Ave · Dixon Lane-MeadowCreek, CA
Flood risk No data
- FEMA flood zone
- —
- Chance of flooding over 30 yrs
- —
- Est. flood insurance / yr
- —
Fire risk No data
- Est. fire insurance / yr
- —
Heat risk No data
- Hot days now (above threshold)
- —
- Hot days in 30 yrs
- —
Wind risk No data
- Chance of severe wind over 30 yrs
- —
Air-quality risk No data
- Unhealthy air days now
- —
- Unhealthy air days in 30 yrs
- —
Risk factors via First Street. Map © Google.
Why this score? — see what drove the B grade
The composite is a weighted blend of 9 inputs, each scored 0–100. Each bar is that input's sub-score; the figure is the points it added to the 100-point composite (weight × sub-score).
- Cash flow +30.0/30.0
- ARV discount +11.7/15.0
- 1% rule +10.0/10.0
- DSCR +10.0/10.0
- Schools +2.7/10.0
- Rent growth +2.5/5.0
- Livability +2.5/5.0
- Condition / age +2.5/5.0
- Appreciation +0.0/10.0
$125,000
🖨 Deal sheet 📄 Offer letter ✓ Due diligence
Listing remarks MLS
Welcome to this beautifully maintained 2-bedroom, 2-bathroom mobile home nestled in the desirable Highlands Senior Park community. This inviting home features fresh new paint throughout, giving it a bright and refreshed feel from the moment you step inside. Enjoy a cozy and comfortable living space with both a wood-burning stove and a pellet stove-perfect for staying warm and creating a relaxing atmosphere year-round. Step outside to a cute, well-kept yard filled with flowers and mature trees, offering a peaceful outdoor retreat. The home also includes a covered patio, ideal for enjoying your morning coffee or entertaining guests in any season. Additional features include: Covered carport for convenient parking and a storage shed for extra space and organization.
Key facts
- Covered patio
- Storage shed
- Pellet stove
Tags
Neighborhood map
What this means for you Summary
Snapshot
- This is a 2-bed/2.0-bath manufactured listed at $125k.
Deal economics
- At list price, monthly cash flow is $773 ($9k/yr) — positive.
- The deal already cash-flows at list — no discount required.
- Meets the 1% rule at list price ($2k rent vs $125k).
- Recommended offer: $114k (9.0% below list) — sets the bar for market timing.
Location & tenants
- Location reads: area grade B — affects rentability + tenant quality, not the cash-flow math above.
- Bishop Unified (town): math 25% / reading 36% proficiency, ranked #337 of 517 in CA (top 65%) — families likely to look elsewhere, expect single-tenant / working-renter base with shorter leases.
- Market conditions: 74 active listings in the ZIP; 18 units permitted in Inyo County in 2024 (0 in 5+ unit buildings).
Forward outlook
- Local home prices are declining (-3.0%/yr); year-one equity from $864 of loan paydown is wiped out by about $4k of value loss. Plan a longer hold.
- Inyo County population projected at -18% by 2050 — secular population decline; favor cash flow + early exit over multi-decade hold.
- At projected returns (-3.0% appreciation + 3.0% rent growth), your $35k cash investment doubles in ~5 years — after that, you're playing with house money.
Negotiation context
- It's been on market 92 days — a 9% lower offer ($114k) is reasonable based on typical stale-listing flexibility.
Questions for the listing agent
- It's been on market 92 days. Have you received any prior offers? Is the seller open to a 9% concession, seller financing, or rate buy-down credit?
- Built in 1978 — when were the roof, HVAC, electrical panel, plumbing, and water heater last replaced?
- Why hasn't it sold? Are there any deal-killer items the seller is aware of (foundation, flood, title, zoning, code violations)?
- Is there a deadline driving the sale (1031 exchange, divorce, estate, relocation)? That informs how much negotiation room exists.
- What's the average days-on-market for RENTAL listings here right now (not sales)? A rising rental-DOM trend means longer vacancies and softer asking-rent achievability than the comps imply.
- What's the recent tenant-quality profile in this submarket — average credit score on applications, eviction rate, late-payment / NSF rate, and stable-employment percentage? A property-management company in the area should have these aggregated.
- How much new for-sale + rental construction is in the pipeline within 1–3 miles? Heavy new supply typically softens prices + rents 12–24 months out; constrained supply supports both.
Investment metrics
- 1% rule
- 1.66% ✓
- Cap rate
- 13.71%
- Cash-on-cash
- 26.50%
- DSCR
- 2.18
- GRM
- 5.0
CMA / ARV
- ARV (median comp)
- $138,000
- List price
- $125,000
- Delta
- -9.42%
- Verdict
- FAIR
- Comps
- 15 within 1.0 mi
Show comp detail 12 sales within ~0.75 mi
| Address | Dist | Beds/Ba | Sqft | Sold | Price | $/sf | Match |
|---|---|---|---|---|---|---|---|
| 2293 Galloway Ave | 0.08mi | 2/2.0 | 1,334 (-1%) | 11mo | $55,000 | $41 | 86 |
| 2272 Brigadoon Ave | 0.16mi | 2/2.0 | 1,344 (0%) | 10mo | $62,500 | $47 | 84 |
| 1495 Argyle Ln | 0.07mi | 2/2.0 | 1,248 (-7%) | 6mo | $105,000 | $84 | 80 |
| 2323 Grazide Cir | 0.44mi | 2/2.0 | 1,344 (0%) | 1mo | $480,000 | $357 | 78 |
| 2269 Galloway Ave | 0.06mi | 2/2.0 | 1,440 (+7%) | 11mo | $160,000 | $111 | 76 |
| 2291 Baskerville Ave | 0.07mi | 2/2.0 | 1,248 (-7%) | 11mo | $60,000 | $48 | 75 |
| 2360 Brigadoon Ave | 0.17mi | 3/2.0 (+1) | 1,440 (+7%) | 3mo | $132,000 | $92 | 73 |
| 1513 Dunbar Ln | 0.15mi | 2/2.0 | 1,440 (+7%) | 12mo | $90,000 | $63 | 71 |
| 2308 Loch Lomond Ave | 0.13mi | 3/2.0 (+1) | 1,493 (+11%) | 1mo | $195,000 | $131 | 70 |
| 1519 Glenwood Ln | 0.24mi | 3/2.0 (+1) | 1,440 (+7%) | 3mo | $138,000 | $96 | 69 |
| 2293 Darby Ave | 0.10mi | 3/2.0 (+1) | 1,440 (+7%) | 12mo | $88,000 | $61 | 68 |
| 2307 Grazide Cir | 0.44mi | 2/2.0 | 1,440 (+7%) | 6mo | $480,000 | $333 | 62 |
Match score weights: distance 35% · size 25% · config 20% · recency 20%. Top-matched comps best support the ARV.
Projected returns pro-forma
-3.0% appreciation · 3.0% rent growth · sell at horizon
- IRR
- 20.3%
- Equity multiple
- 1.83×
- Total profit
- $29,007
- Equity at exit
- $18,638
- IRR
- 28.6%
- Equity multiple
- 3.54×
- Total profit
- $88,779
- Equity at exit
- $10,808
Cash invested: $35,000 (down + closing). Projections, not guarantees.
Landlord ↔ Tenant lean methodology
- Overall (STATE)
- 18 Strongly Tenant-Friendly
- State California
- 18 Strongly Tenant-Friendly · D+13
- County
- — inherits STATE
- City
- — inherits STATE
ZIP-level market 93514
- Active inventory
- 74
- Price-to-rent
- 5.0×
Monthly cashflow live
- Estimated rent
- $2,072 medium interval (Pro) →
- Mortgage (P&I)
- −$656
- Tax est. 1.5%
- −$156 /mo · $1,875/yr
- Insurance
- −$52
- HOA
- −$0
- Vacancy / Maint / Mgmt
- −$435
- Net cashflow
- $773
Break-even live
UW: 25.0% down · 7.5% · 30yr · 1.5% tax · 5.0% vac · 8.0% maint · 8.0% mgmt
Financing live
Cash to close
- Down payment
- $31,250
- Closing costs
- $3,750
- Reserves months
- —
- Total cash needed
- —
Loan-product check · same deal, 3 products live
Conventional
25% down · 7.5% · 30yr
- Down + closing
- —
- Monthly P&I
- —
- Monthly cashflow
- —
- DSCR
- —
- Eligible?
- —
Personal DTI + credit; lowest rate.
DSCR
20% down · 8.5% · 30yr
- Down + closing
- —
- Monthly P&I
- —
- Monthly cashflow
- —
- DSCR
- —
- Eligible?
- —
No personal income docs; deal must DSCR.
Hard money
10% down · 12.0% · 12mo
- Down + closing
- —
- Monthly P&I
- —
- Monthly cashflow
- —
- DSCR
- —
- Eligible?
- —
Short-term bridge; refi at stabilization.
Listing history 18 events
-
2026-06-18days on market $125,000 Active 92 DOM
-
2026-06-17days on market $125,000 Active 91 DOM
-
2026-06-16days on market $125,000 Active 90 DOM
-
2026-06-15days on market $125,000 Active 89 DOM
-
2026-06-14days on market $125,000 Active 87 DOM
-
2026-06-13pricedays on market $125,000 Active 86 DOM
-
2026-06-10days on market $129,900 Active 84 DOM
-
2026-06-09days on market $129,900 Active 83 DOM
-
2026-06-08days on market $129,900 Active 82 DOM
-
2026-06-07days on market $129,900 Active 81 DOM
-
2026-06-05days on market $129,900 Active 78 DOM
-
2026-06-03days on market $129,900 Active 77 DOM
-
2026-06-02pricedays on market $129,900 Active 76 DOM
-
2026-06-01days on market $135,000 Active 75 DOM
-
2026-05-31days on market $135,000 Active 74 DOM
-
2026-05-31days on market $135,000 Active 73 DOM
-
2026-05-04price $135,000 773-char remark
Show marketing remark (773 chars)
Welcome to this beautifully maintained 2-bedroom, 2-bathroom mobile home nestled in the desirable Highlands Senior Park community. This inviting home features fresh new paint throughout, giving it a bright and refreshed feel from the moment you step inside. Enjoy a cozy and comfortable living space with both a wood-burning stove and a pellet stove-perfect for staying warm and creating a relaxing atmosphere year-round. Step outside to a cute, well-kept yard filled with flowers and mature trees, offering a peaceful outdoor retreat. The home also includes a covered patio, ideal for enjoying your morning coffee or entertaining guests in any season. Additional features include: Covered carport for convenient parking and a storage shed for extra space and organization.
-
2026-03-18$139,000 Active 773-char remark
Show marketing remark (773 chars)
Welcome to this beautifully maintained 2-bedroom, 2-bathroom mobile home nestled in the desirable Highlands Senior Park community. This inviting home features fresh new paint throughout, giving it a bright and refreshed feel from the moment you step inside. Enjoy a cozy and comfortable living space with both a wood-burning stove and a pellet stove-perfect for staying warm and creating a relaxing atmosphere year-round. Step outside to a cute, well-kept yard filled with flowers and mature trees, offering a peaceful outdoor retreat. The home also includes a covered patio, ideal for enjoying your morning coffee or entertaining guests in any season. Additional features include: Covered carport for convenient parking and a storage shed for extra space and organization.
ⓘ Source: listings_history table (triggers on properties + properties_extension) + one-shot
backfill from property_details.listing_events for pre-trigger history.
Nearby sold comps map
Loading sold comps map…
Walkable amenities ~0.75 mi
Loading nearby amenities…
Taxation est. · year 1
- Rental income
- $24,863
- − Mortgage interest
- −$7,002
- − Property taxes
- −$1,875
- − Insurance
- −$625
- − Repairs & maintenance
- −$1,989
- − Management
- −$1,989
- − Depreciation
- −$3,636
- Taxable income
- $7,747
- Est. tax owed @ 24.0%
- −$1,859
- After-tax cash flow
- $7,417/yr
For passive investors: Depreciation is non-cash, so a rental often shows a tax loss while cash-flowing — sheltering income. Rental losses are passive: they offset passive income freely, and up to $25,000/yr can offset ordinary (W-2) income if you actively participate and your MAGI is under $100k (phasing out to $0 by $150k); unused losses carry forward. On sale, claimed depreciation is recaptured at up to 25%, and gains may owe capital-gains tax (a 1031 exchange can defer both). Figures are a year-1 estimate at your 24.0% rate — not tax advice; consult a CPA.
Schools (NCES district)
- District
- Bishop Unified
- NCES district ID
- 0601409
- Math proficiency
- 25% ▼ -9.00%
- Reading proficiency
- 36% ▼ -6.00%
- Median HH income
- $49,430
- Composite
- 26.52/100
- National rank
- #7197
- State rank
- #337 of 517 in CA
Livability — Dixon Lane-MeadowCreek
No livability data for this city. (Only ~50 U.S. cities are tracked.)
Census & demographics
- Census place
- Dixon Lane-MeadowCreek, CA
- Population (ZIP)
- 14,961
Population outlook (Inyo County) Hauer SSP2
- Today (2025)
- 17,399 people
- By 2030
- 16,824 · -3.3%
- By 2040
- 15,543 · -10.7%
- By 2050
- 14,332 · -17.6%
- By 2075
- 12,213 · -29.8%
- By 2100
- 9,997 · -42.5%
Race, ethnicity, and origin ACS 2023
- Neighborhood character
- Diverse neighborhood (Simpson 0.58)
- Race & ethnicity
- White 60% Hispanic / Latino 25% Two or more races 14% Native American 9% Asian 2%
- Hispanic origin (detail)
- Mexican 20%
- Common ancestry
- Slovak 4% Italian 3% Romanian 2%
- Foreign-born
- 9% · Canada, Jamaica
- Languages at home
- 85% English-only · Spanish 12% Other Indo-European 1% Tagalog/Filipino 1%
Political lean MEDSL · Inyo
- 2024 margin
- Toss-up / Even · D 46.9% · R 49.9% · Other 3.1%
- 2008→2024 swing
- +6.2pp toward D · 2008: -9.2pp · 2024: -3.0pp
- All cycles
- 2024: R+3.0 2020: D+0.1 2016: R+13.7 2012: R+11.8 2008: R+9.2
Not yet ingested
- Civics
- —
Market trends
- HPI YoY
- ▼ -387.39%
- Current HPI
- 231.287
- Rent YoY
- —
- Metro
- —
- State GDP YoY
- ▲ 3.21%
- F500 in state
- 116
Industry mix (Fortune 500 HQ in CA)
| Industry | F500 HQs | Revenue |
|---|---|---|
| Technology | 27 | $1,492B |
|
||
| Financial Services | 3 | $174B |
|
||
| Retail | 3 | $44B |
|
||
| Insurance | 3 | $26B |
|
||
| Media / Entertainment | 2 | $115B |
|
||
| Pharmaceuticals / Biotech | 2 | $62B |
|
||
Price history
-2.9% since first listed2 events — show timeline
- 2026-05-04 Price Changed $135,000 IMLS
- 2026-03-18 Listed $139,000 IMLS
Property tax history
-1.0%/yrLatest (2025): $212 · +9.4% YoY. Source: county tax records.
Cash-flow waterfall
monthlySold comps — $/sqft
last 12 mo · ≤1 miLoading sold comps…