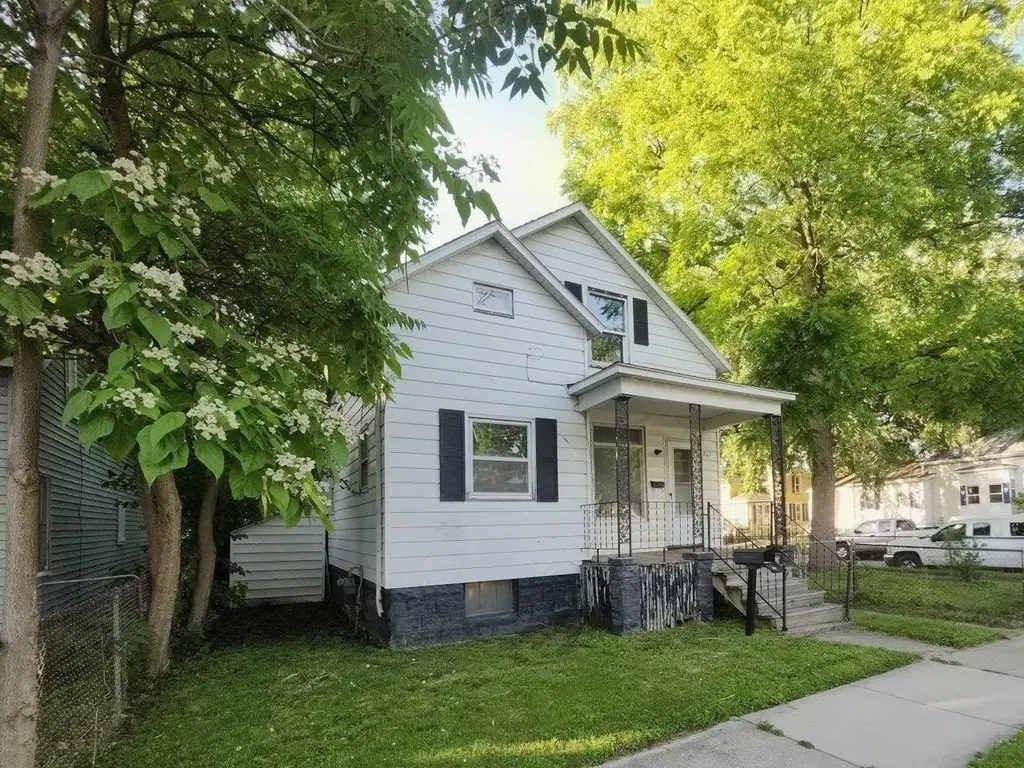
807 E North Union St · Bay City, MI
Flood risk 1/10 · Minimal
- FEMA flood zone
- X (unshaded)
- Chance of flooding over 30 yrs
- 0.0%
- Est. flood insurance / yr
- $473 – $860
Fire risk 1/10 · Minimal
- Est. fire insurance / yr
- $784 – $1,456
Heat risk 2/10 · Minimal
- Hot days now (above 96°F)
- 7 days/yr
- Hot days in 30 yrs
- 14 days/yr
Wind risk 1/10 · Minimal
- Chance of severe wind over 30 yrs
- —
Air-quality risk 2/10 · Minimal
- Unhealthy air days now
- 1 days/yr
- Unhealthy air days in 30 yrs
- 2 days/yr
Risk factors via First Street. Map © Google.
Why this score? — see what drove the B+ grade
The composite is a weighted blend of 9 inputs, each scored 0–100. Each bar is that input's sub-score; the figure is the points it added to the 100-point composite (weight × sub-score).
- Cash flow +30.0/30.0
- ARV discount +15.0/15.0
- 1% rule +10.0/10.0
- DSCR +10.0/10.0
- Livability +3.4/5.0
- Schools +2.8/10.0
- Rent growth +2.5/5.0
- Condition / age +2.5/5.0
- Appreciation +0.0/10.0
$75,000
🖨 Deal sheet 📄 Offer letter ✓ Due diligence
Listing remarks MLS
Possible Land Contract Available - Bay City Investment Opportunity! Looking for an affordable home in Bay City, Michigan with investment potential? This 4-bedroom, 1-bath home offers a rare opportunity for first-time home-buyers, investors, landlords, or anyone looking to build instant sweat equity. Situated on a desirable corner lot with a fenced yard, this property features a full basement, carport, spacious floor plan, and solid construction with plenty of room for updates and customization. Inside, you'll find four bedrooms, including two large upstairs bedrooms, generous living space, and a full basement ideal for storage, a workshop, or future finished living area. The home's strong bones provide an excellent foundation for renovation, making it a great fixer-upper, rental property, flip opportunity, or affordable primary residence. Located in Bay City, you'll enjoy convenient access to schools, parks, shopping, restaurants, medical facilities, and major commuter routes. Whether you're searching for a starter home, investment property, income-producing rental, or a home to personalize and make your own, this property checks all the boxes. Property Highlights: Possible Land Contract Terms Available 4 Bedrooms \ 1 Bathroom Corner Lot Location Fenced Backyard Full Basement Two Large Upstairs Bedrooms Strong Structural Bones Excellent Sweat Equity Potential Ideal Investment Property or Starter Home Convenient Bay City Location Don't miss this affordable Bay City real estate opportunity with flexible financing options and unlimited potential. Schedule your showing today and discover the value this property has to offer.
Key facts
- Full basement
- Fenced backyard
- Corner lot
Tags
Property features AI
Exterior
- Parking: Carport
- Utilities: Public water; Community sewer; Natural gas available; Cable available
- Home design: Residential property; 1 1/2-story structure; Built in 1910
- Construction: Aluminum exterior
- Exterior features: Fenced yard; Porch; Sidewalks; Corner lot; Pool on property
Interior
- Kitchen: Range/oven; Kitchen on main level (approx. 13 x 10); Kitchen with laminate flooring
- Bedrooms: First-floor bedrooms present; Bedroom on main level (approx. 10 x 10); Second bedroom on main level (approx. 10 x 9); Upper-level bedroom (approx. 11 wide); Upper-level bedroom (approx. 22 x 10)
- Flooring: Carpet in dining and living areas; Laminate in kitchen
- Bathrooms: One full bathroom (main level)
- Heating & cooling: Forced air heating; Exhaust fan for cooling
- Interior features: Bay window; Great room; Workshop
- Laundry & utility: Laundry room on lower level (approx. 8 x 7); Basement with interior access and egress/daylight windows (unfinished)
Neighborhood map
What this means for you Summary
Snapshot
- This is a 3-bed/1.0-bath single-family listed at $75k.
Deal economics
- At list price, monthly cash flow is $506 ($6k/yr) — positive.
- The deal already cash-flows at list — no discount required.
- Meets the 1% rule at list price ($1k rent vs $75k).
- Cap rate 14.4% vs local median 5.5% in Bay City — top-decile yield for the area; either an underpriced asset or a hidden risk that comps aren't pricing in. Stress-test before assuming the spread holds.
Location & tenants
- Location reads 68/100 on livability (#360 in MI) — a middle-class / working-renter tenant base. Strengths: cost of living A+, housing A+, health & safety A+; Watch: amenities D, crime F, commute F.
- Bay City School District (urban): math 27% / reading 40% proficiency, ranked #317 of 540 in MI (top 59%) — families likely to look elsewhere, expect single-tenant / working-renter base with shorter leases.
- Zoned schools: Kolb Elementary School (math 37% / reading 42%, grade F, #606 of 1,397 statewide, top 48%, 477 students, 72% FRL); Bay City Central High School (math 22% / reading 47%, grade F, #372 of 713 statewide, top 56%, 1,033 students, 64% FRL) — zoned schools average 68% FRL vs 44% district-wide (24 pts higher); higher-poverty schools than district average — tighter screening recommended.
- Market conditions: 246 active listings in the ZIP; 2 comparable units currently listed for rent nearby; 39 units permitted in Bay County in 2024 (0 in 5+ unit buildings).
Forward outlook
- Local home prices are declining (-3.0%/yr); year-one equity from $519 of loan paydown is wiped out by about $2k of value loss. Plan a longer hold.
- Bay County population projected at -21% by 2050 — secular population decline; favor cash flow + early exit over multi-decade hold.
- At projected returns (-3.0% appreciation + 3.0% rent growth), your $21k cash investment doubles in ~5 years — after that, you're playing with house money.
Negotiation context
- Only 3 days on market — expect competitive offers; lowballing is unlikely to land.
- 2 sale attempts with the ask held roughly flat each time — persistent listings suggest the price (not the market) is what's stuck; bring a comps-based counter.
Risks & watch-outs
- Watch-outs: property tax is 2.7% of price; built in 1910 — expect roof / HVAC / electrical / plumbing capex.
Questions for the listing agent
- Built in 1910 — when were the roof, HVAC, electrical panel, plumbing, and water heater last replaced?
- Property tax is high relative to price — has the assessment been appealed recently, and will the sale trigger a re-assessment?
- Is there a deadline driving the sale (1031 exchange, divorce, estate, relocation)? That informs how much negotiation room exists.
- Schools are D-rated, which usually means shorter tenancies and higher turnover. Who's the typical renter profile here, and what's been the actual vacancy rate?
- Crime grade is F in this area — have there been break-ins, vandalism, or insurance claims at this property in the last 3 years? What carrier currently insures it and at what premium?
- What's the average days-on-market for RENTAL listings here right now (not sales)? A rising rental-DOM trend means longer vacancies and softer asking-rent achievability than the comps imply.
- What's the recent tenant-quality profile in this submarket — average credit score on applications, eviction rate, late-payment / NSF rate, and stable-employment percentage? A property-management company in the area should have these aggregated.
- How much new for-sale + rental construction is in the pipeline within 1–3 miles? Heavy new supply typically softens prices + rents 12–24 months out; constrained supply supports both.
Investment metrics
- 1% rule
- 1.85% ✓
- Cap rate
- 14.40%
- Cash-on-cash
- 28.94%
- DSCR
- 2.29
- GRM
- 4.5
CMA / ARV
- ARV (on-the-fly)
- $123,120
- Comps found
- 12
Show comp detail 12 sales within ~0.75 mi
| Address | Dist | Beds/Ba | Sqft | Sold | Price | $/sf | Match |
|---|---|---|---|---|---|---|---|
| 809 N LINN St | 0.11mi | 3/1.5 | 1,029 (+0%) | 2mo | $92,500 | $90 | 91 |
| 402 State St | 0.15mi | 3/1.0 | 1,000 (-2%) | 3mo | $109,000 | $109 | 86 |
| 1115 Litchfield St | 0.32mi | 3/1.0 | 1,012 (-1%) | 3mo | $122,000 | $121 | 81 |
| 202 Elm St | 0.44mi | 3/1.0 | 1,040 (+1%) | 1mo | $72,000 | $69 | 76 |
| 1004 N Williams St | 0.33mi | 4/1.0 (+1) | 1,020 (-1%) | 4mo | $126,000 | $124 | 76 |
| 905 N Dewitt St | 0.36mi | 2/1.0 (-1) | 1,018 (-1%) | 3mo | $130,000 | $128 | 74 |
| 427 James St | 0.68mi | 3/1.0 | 1,088 (+6%) | 3mo | $131,000 | $120 | 56 |
| 305 Marston St | 0.53mi | 2/1.0 (-1) | 948 (-8%) | 4mo | $80,000 | $84 | 55 |
| 705 Frost Dr | 0.73mi | 3/1.5 | 960 (-6%) | 0mo | $175,000 | $182 | 53 |
| 403 Bradley St | 0.46mi | 2/1.0 (-1) | 912 (-11%) | 2mo | $80,000 | $88 | 53 |
| 118 AUSABLE STATE Rd | 0.72mi | 3/1.5 | 1,131 (+10%) | 3mo | $155,000 | $137 | 45 |
| 201 N Warner St | 0.73mi | 3/1.0 | 902 (-12%) | 4mo | $95,000 | $105 | 43 |
Match score weights: distance 35% · size 25% · config 20% · recency 20%. Top-matched comps best support the ARV.
Projected returns pro-forma
-3.0% appreciation · 3.0% rent growth · sell at horizon
- IRR
- 23.3%
- Equity multiple
- 1.96×
- Total profit
- $20,166
- Equity at exit
- $11,183
- IRR
- 31.3%
- Equity multiple
- 3.83×
- Total profit
- $59,360
- Equity at exit
- $6,485
Cash invested: $21,000 (down + closing). Projections, not guarantees.
Landlord ↔ Tenant lean methodology
- Overall (STATE)
- 62 Landlord-Friendly
- State Michigan
- 62 Landlord-Friendly · EVEN
- County
- — inherits STATE
- City
- — inherits STATE
ZIP-level market 48706
- Active inventory
- 246
- Price-to-rent
- 4.5×
Monthly cashflow live
- Estimated rent
- $1,390 medium interval (Pro) →
- Mortgage (P&I)
- −$393
- Tax from tax record
- −$167 /mo · $2,004/yr
- Insurance
- −$31
- HOA
- −$0
- Vacancy / Maint / Mgmt
- −$292
- Net cashflow
- $506
Break-even live
UW: 25.0% down · 7.5% · 30yr · 1.5% tax · 5.0% vac · 8.0% maint · 8.0% mgmt
Financing live
Cash to close
- Down payment
- $18,750
- Closing costs
- $2,250
- Reserves months
- —
- Total cash needed
- —
Loan-product check · same deal, 3 products live
Conventional
25% down · 7.5% · 30yr
- Down + closing
- —
- Monthly P&I
- —
- Monthly cashflow
- —
- DSCR
- —
- Eligible?
- —
Personal DTI + credit; lowest rate.
DSCR
20% down · 8.5% · 30yr
- Down + closing
- —
- Monthly P&I
- —
- Monthly cashflow
- —
- DSCR
- —
- Eligible?
- —
No personal income docs; deal must DSCR.
Hard money
10% down · 12.0% · 12mo
- Down + closing
- —
- Monthly P&I
- —
- Monthly cashflow
- —
- DSCR
- —
- Eligible?
- —
Short-term bridge; refi at stabilization.
Rent comps 2 comps
| Address | Beds | Baths | Sqft | Rent | $/sqft | DOM | Units | Dist |
|---|---|---|---|---|---|---|---|---|
| 1305 Washington Ave Bay City, MI | 2.0 | 1.0 | 635 | $1,675 | $2.64 | 43d | 1 | 0.61mi |
| 800 McKinley St Bay City, MI | 2.0 | 1.0 | 796 | $925 | $1.16 | 43d | 1 | 1.24mi |
Listing history 6 events
-
2026-06-19days on market $75,000 Active 3 DOM
-
2026-06-18days on market $75,000 Active 2 DOM
-
2026-06-17remarks 699-char remark
-
2026-06-17$75,000 Active 1 DOM
-
2026-06-17remarks 682-char remark
-
2026-06-17$75,000 Active 1 DOM
ⓘ Source: listings_history table (triggers on properties + properties_extension) + one-shot
backfill from property_details.listing_events for pre-trigger history.
Tax reassessment forecast MI · Partial reset (capped growth)
- Current annual tax
- $2,004 · $167/mo
- Projected year-2 tax
- $2,004 · $167/mo
- Expected delta
- $0/yr ($0/mo · 0.0%)
ⓘ Screening estimate from a state-policy table — verify with the county assessor before closing.
Climate risk First Street
- Flood 1/10 Low FEMA zone X (unshaded) · 0% chance over 30 yrs
- Wildfire 1/10 Low
- Heat 2/10 Low 7 d/yr ≥96°F today · 14 d/yr by 30 yrs out
- Wind 1/10 Low
- Air quality 2/10 Low 1 unhealthy d/yr today · 2 by 30 yrs out
Nearby sold comps map
Loading sold comps map…
Walkable amenities ~0.75 mi
Loading nearby amenities…
Taxation est. · year 1
- Rental income
- $16,678
- − Mortgage interest
- −$4,201
- − Property taxes
- −$2,004
- − Insurance
- −$375
- − Repairs & maintenance
- −$1,334
- − Management
- −$1,334
- − Depreciation
- −$2,182
- Taxable income
- $5,248
- Est. tax owed @ 24.0%
- −$1,259
- After-tax cash flow
- $4,818/yr
For passive investors: Depreciation is non-cash, so a rental often shows a tax loss while cash-flowing — sheltering income. Rental losses are passive: they offset passive income freely, and up to $25,000/yr can offset ordinary (W-2) income if you actively participate and your MAGI is under $100k (phasing out to $0 by $150k); unused losses carry forward. On sale, claimed depreciation is recaptured at up to 25%, and gains may owe capital-gains tax (a 1031 exchange can defer both). Figures are a year-1 estimate at your 24.0% rate — not tax advice; consult a CPA.
Schools (NCES district)
- District
- Bay City School District
- NCES district ID
- 2604260
- Math proficiency
- 27% ▼ -8.00%
- Reading proficiency
- 40% ▼ -4.00%
- Median HH income
- $43,833
- Composite
- 28.47/100
- National rank
- #6743
- State rank
- #317 of 540 in MI
Livability — Bay City
- Score
- 68/100
- State rank
- #360
- US rank
- #8912
Category grades
Schools grade is shown separately in the Schools card above.
Census & demographics
- Census place
- Bay City, MI
- City population
- 25,635
- Population (ZIP)
- 38,756
Population outlook (Bay County) Hauer SSP2
- Today (2025)
- 101,476 people
- By 2030
- 98,152 · -3.3%
- By 2040
- 89,711 · -11.6%
- By 2050
- 80,614 · -20.6%
- By 2075
- 60,544 · -40.3%
- By 2100
- 41,603 · -59.0%
Race, ethnicity, and origin ACS 2023
- Neighborhood character
- Predominantly White (90%)
- Race & ethnicity
- White 90% Hispanic / Latino 5% Two or more races 4%
- Common ancestry
- Romanian 16% Lithuanian 9% Slovak 2%
- Foreign-born
- 1%
- Languages at home
- 98% English-only · Spanish 1%
Political lean MEDSL · Bay
- 2024 margin
- R (+14.7) · D 42.0% · R 56.7% · Other 1.3%
- 2008→2024 swing
- -30.0pp toward R · 2008: 15.3pp · 2024: -14.7pp
- All cycles
- 2024: R+14.7 2020: R+11.6 2016: R+12.6 2012: D+6.0 2008: D+15.3
Not yet ingested
- Civics
- —
Market trends
- HPI YoY
- ▼ -133.29%
- Current HPI
- 203.6444
- Rent YoY
- —
- Metro
- —
- State GDP YoY
- ▲ 1.37%
- F500 in state
- 28
Industry mix (Fortune 500 HQ in MI)
| Industry | F500 HQs | Revenue |
|---|---|---|
| Automotive Parts | 3 | $48B |
|
||
| Automotive | 2 | $372B |
|
||
| Chemicals | 1 | $45B |
|
||
| Automotive Retail | 1 | $29B |
|
||
| Healthcare / Medical Devices | 1 | $23B |
|
||
| Automotive Technology | 1 | $20B |
|
||
Price history
+0.0% since first listed2 events — show timeline
- 2026-06-16 Listed $75,000 REALCOMP
- 2026-06-16 Listed $75,000 MiRealSource-MiMLS
Property tax history
+3.7%/yrLatest (2025): $2,004 · +15.5% YoY. Source: county tax records.
Cash-flow waterfall
monthlySold comps — $/sqft
last 12 mo · ≤1 miLoading sold comps…