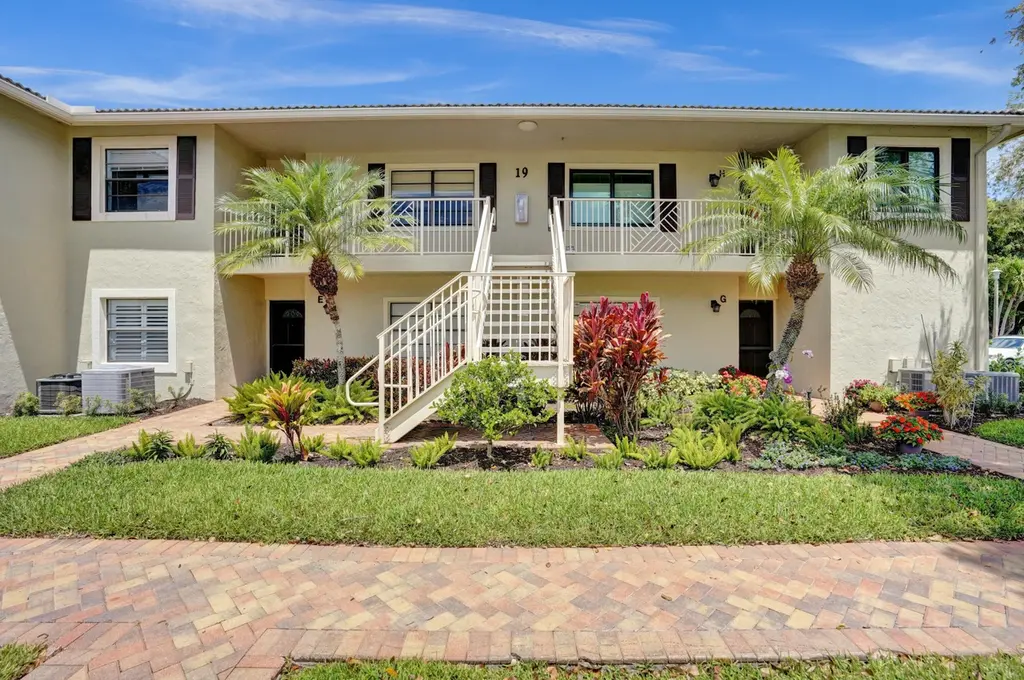
19 Stratford Dr E Unit F · Boynton Beach, FL
Flood risk 4/10 · Minor
- FEMA flood zone
- X (unshaded)
- Chance of flooding over 30 yrs
- 0.21%
- Est. flood insurance / yr
- $507 – $1,088
Fire risk 1/10 · Minimal
- Est. fire insurance / yr
- $947 – $1,759
Heat risk 9/10 · Severe
- Hot days now (above 106°F)
- 5 days/yr
- Hot days in 30 yrs
- 17 days/yr
Wind risk 10/10 · Severe
- Chance of severe wind over 30 yrs
- 99.0%
Air-quality risk 2/10 · Minimal
- Unhealthy air days now
- 1 days/yr
- Unhealthy air days in 30 yrs
- 2 days/yr
Risk factors via First Street. Map © Google.
Why this score? — see what drove the D+ grade
The composite is a weighted blend of 9 inputs, each scored 0–100. Each bar is that input's sub-score; the figure is the points it added to the 100-point composite (weight × sub-score).
- Cash flow +15.0/30.0
- ARV discount +7.5/15.0
- 1% rule +5.0/10.0
- DSCR +5.0/10.0
- Schools +4.3/10.0
- Livability +3.6/5.0
- Condition / age +2.5/5.0
- Rent growth +2.4/5.0
- Appreciation +0.0/10.0
$20,000
🖨 Deal sheet 📄 Offer letter ✓ Due diligence
Listing remarks
Bright and spacious two bedroom/ two bath condo with great golf course views. Relax on your screened in balcony and enjoy the balmy Florida weather. A fabulous country club with 3 championship golf courses to choose from. State of the art Top tracer Driving Range, and an amazing short game area to hone in on your skills. Renovated club house, 6 fabulous restaurants to choose from, state of the art fitness center and a whole lot more activities and clubs to enjoy. When you sit by the Resort pool with Splash bar, you will feel like you travelled to the Carribean. This is the lifestyle you always dreamed of. This condo is ready to make it yours. Mandatory membership required. Initiation fee,
Key facts
- Resort pool
- Fitness center
- Screened in balcony
Tags
Property features AI
Finance
- Other: Directions: Congress between Lake Ida and Golf Road on the west side. Enter South Gate with water fountain. Take the third left past the guard house into Stratford east.
- HOA & community: Association: Stratford (has HOA); Quarterly association fee; Association amenities include clubhouse, fitness center, golf course, jogging path, pool, sauna, spa/hot tub, tennis courts, pickleball courts, putting green, sidewalks, street lights, cafe/restaurant, library, manager on site, on-site management; Association fee covers insurance, grounds maintenance, pest control, security, sewer, trash, common areas, common real estate tax, and pool service; Community of 304 units; Pets allowed with restrictions and possible limits
Exterior
- Parking: 2 parking spaces; Open guest parking
- Security: Gated community with guard; Security patrol
- Utilities: Public water; Public sewer; Three-phase electric available; Cable available; Electricity available
- Home design: Condominium, one level; One-story building; Second-floor entry (entry level 2); Faces south; Resale condition
- Construction: Concrete and stucco construction; Concrete/tile roof with wood truss/rafter; Built as part of building identified as 19
- Exterior features: On golf course; Paved road frontage; Not waterfront
Interior
- Kitchen: Dishwasher; Electric range; Refrigerator; Trash compactor; Electric water heater
- Bedrooms: 2 main-level bedrooms
- Flooring: Carpet; Ceramic tile
- Bathrooms: 2 full bathrooms (main level)
- Heating & cooling: Central electric heating; Central electric air conditioning with humidity control
- Interior features: Walk-in closets; Stacked bedroom layout; Blinds and drapes; Furnished status negotiable
- Laundry & utility: Laundry inside the unit
Neighborhood map
What this means for you Summary
Snapshot
- This is a 2-bed/2.0-bath condo listed at $20k.
Deal economics
- At list price, monthly cash flow is $540 ($6k/yr) — positive.
- The deal already cash-flows at list — no discount required.
- Meets the 1% rule at list price ($3k rent vs $20k).
- Recommended offer: $19k (3.0% below list) — sets the bar for market timing.
- Cap rate 38.7% vs local median 4.3% in Boynton Beach — top-decile yield for the area; either an underpriced asset or a hidden risk that comps aren't pricing in. Stress-test before assuming the spread holds.
Location & tenants
- Location reads 72/100 on livability (#351 in FL) — a middle-class / working-renter tenant base. Strengths: housing A+, health & safety B+, cost of living B; Watch: amenities D+, crime D-, commute F.
- Palm Beach (suburban): math 46% / reading 53% proficiency, ranked #34 of 73 in FL (top 47%) — families likely to look elsewhere, expect single-tenant / working-renter base with shorter leases.
- Zoned schools: Crosspointe Elementary School (math 36% / reading 45%, grade F, #1,471 of 2,144 statewide, top 69%, 652 students, 75% FRL); Atlantic High School (math 28% / reading 52%, grade F, #296 of 667 statewide, top 45%, 1,889 students, 59% FRL) — zoned schools average 67% FRL vs 52% district-wide (15 pts higher); higher-poverty schools than district average — tighter screening recommended.
- Market conditions: Rents soft (-0.6%/yr); 445 active listings in the ZIP; 40 comparable units currently listed for rent nearby; rentals at typical pace (median 25d on market — plan ~3-4 weeks tenant-placement turnaround); solid renter incomes; 3,974 units permitted in Palm Beach County in 2024 (1,012 in 5+ unit buildings).
- At $2,911/mo this rent would consume 46% of the median local household income ($76k/yr) (locally 1813% of renters already pay >50% of income on rent) — very limited rent-growth headroom before tenants either downsize or default.
Forward outlook
- Local home prices are declining (-3.0%/yr); year-one equity from $138 of loan paydown is wiped out by about $600 of value loss. Plan a longer hold.
- Palm Beach County population projected at +30% by 2050 — long-run rental-demand tailwind backs the buy-and-hold thesis.
- At projected returns (-3.0% appreciation + 0.0% rent growth), your $6k cash investment doubles in ~1 year — after that, you're playing with house money.
Negotiation context
- It's been on market 58 days — a 3% lower offer ($19k) is reasonable based on typical stale-listing flexibility.
- 10 sale attempts since 27y ago with the ask held roughly flat each time — persistent listings suggest the price (not the market) is what's stuck; bring a comps-based counter.
Risks & watch-outs
- Watch-outs: property tax is 4.2% of price; HOA is 54% of rent.
- Climate carrying-cost: severe wind risk, 99% chance of damaging wind over 30y; extreme-heat days projected 5→17/yr by 2055 (HVAC capex compounding) — expect insurance premiums to compound above CPI over the hold.
Questions for the listing agent
- It's been on market 58 days. Have you received any prior offers? Is the seller open to a 3% concession, seller financing, or rate buy-down credit?
- Property tax is high relative to price — has the assessment been appealed recently, and will the sale trigger a re-assessment?
- What does the HOA fee cover, when was the last increase, and are there any pending special assessments or reserve-fund shortfalls?
- Any open or pending special assessments — roof, HVAC, plumbing, elevator, façade? What's the per-unit balance and payoff schedule, and is the seller paying it off at close or rolling it to the buyer?
- Is there a deadline driving the sale (1031 exchange, divorce, estate, relocation)? That informs how much negotiation room exists.
- Crime grade is D in this area — have there been break-ins, vandalism, or insurance claims at this property in the last 3 years? What carrier currently insures it and at what premium?
- The area grade is low — what's the realistic commute time and amenity access for the typical tenant pool here? Any planned neighborhood developments (good or bad) we should know about?
- What's the average days-on-market for RENTAL listings here right now (not sales)? A rising rental-DOM trend means longer vacancies and softer asking-rent achievability than the comps imply.
- What's the recent tenant-quality profile in this submarket — average credit score on applications, eviction rate, late-payment / NSF rate, and stable-employment percentage? A property-management company in the area should have these aggregated.
- How much new apartment / multifamily construction is in the pipeline within 1–3 miles? Heavy new supply (>2% of stock underway) typically softens rents 12–24 months out; light construction supports rent growth.
Investment metrics
- 1% rule
- 14.56% ✓
- Cap rate
- 38.70%
- Cash-on-cash
- 115.75%
- DSCR
- 6.15
- GRM
- 0.6
CMA / ARV
No comps found within radius.
Projected returns pro-forma
-3.0% appreciation · 0.0% rent growth · sell at horizon
- IRR
- —
- Equity multiple
- 5.23×
- Total profit
- $23,672
- Equity at exit
- $2,982
- IRR
- —
- Equity multiple
- 7.46×
- Total profit
- $36,168
- Equity at exit
- $1,729
Cash invested: $5,600 (down + closing). Projections, not guarantees.
Landlord ↔ Tenant lean methodology
- Overall (STATE)
- 87 Strongly Landlord-Friendly
- State Florida
- 87 Strongly Landlord-Friendly · R+3
- County
- — inherits STATE
- City
- — inherits STATE
ZIP-level market 33436
- Home prices YoY
- -26.0%
- Rents YoY
- -0.6%
- Active inventory
- 445
- Price-to-rent
- 0.6×
Monthly cashflow live
- Estimated rent
- $2,911 high interval (Pro) →
- Mortgage (P&I)
- −$105
- Tax from tax record
- −$71 /mo · $847/yr
- Insurance
- −$8
- HOA
- −$1,576
- Vacancy / Maint / Mgmt
- −$611
- Net cashflow
- $540
Break-even live
UW: 25.0% down · 7.5% · 30yr · 1.5% tax · 5.0% vac · 8.0% maint · 8.0% mgmt
Financing live
Cash to close
- Down payment
- $5,000
- Closing costs
- $600
- Reserves months
- —
- Total cash needed
- —
Loan-product check · same deal, 3 products live
Conventional
25% down · 7.5% · 30yr
- Down + closing
- —
- Monthly P&I
- —
- Monthly cashflow
- —
- DSCR
- —
- Eligible?
- —
Personal DTI + credit; lowest rate.
DSCR
20% down · 8.5% · 30yr
- Down + closing
- —
- Monthly P&I
- —
- Monthly cashflow
- —
- DSCR
- —
- Eligible?
- —
No personal income docs; deal must DSCR.
Hard money
10% down · 12.0% · 12mo
- Down + closing
- —
- Monthly P&I
- —
- Monthly cashflow
- —
- DSCR
- —
- Eligible?
- —
Short-term bridge; refi at stabilization.
Rent comps 40 comps
| Address | Beds | Baths | Sqft | Rent | $/sqft | DOM | Units | Dist |
|---|---|---|---|---|---|---|---|---|
| 61 Eastgate Dr Unit A Boynton Beach, FL | 2.0 | 2.0 | 1572 | $7,000 | $4.45 | 24d | 1 | 0.45mi |
| 20 Westgate Ln Unit 20G Boynton Beach, FL | 2.0 | 2.0 | 1712 | $7,990 | $4.67 | 11d | 1 | 0.49mi |
| 1770 NW 22nd Ave Delray Beach, FL | 3.0 | 2.0 | 1850 | $7,000 | $3.78 | 17d | 1 | 0.57mi |
| 2915 NW 12th St Unit D Delray Beach, FL | 2.0 | 2.0 | 1499 | $3,200 | $2.13 | 8d | 1 | 0.63mi |
| 1630 NW 22nd Ave Delray Beach, FL | 3.0 | 2.0 | 1560 | $4,200 | $2.69 | 24d | 1 | 0.64mi |
| 2583 NW 13th St Delray Beach, FL | 2.0 | 2.0 | 1466 | $2,600 | $1.77 | 17d | 1 | 0.65mi |
| 4311 N Magnolia Cir Delray Beach, FL | 3.0 | 2.0 | 1705 | $3,100 | $1.82 | 24d | 1 | 0.68mi |
| 4574 Danson Way Delray Beach, FL | 3.0 | 2.5 | 1654 | $3,300 | $2.00 | 24d | 1 | 0.71mi |
| 1225 E Magnolia Cir Delray Beach, FL | 3.0 | 2.0 | 1705 | $3,700 | $2.17 | 24d | 1 | 0.71mi |
| 945 Sunflower Ave Delray Beach, FL | 3.0 | 2.0 | 1755 | $4,500 | $2.56 | 8d | 1 | 0.80mi |
| 872 NW 29th Ave Unit A Delray Beach, FL | 2.0 | 2.0 | 1188 | $2,700 | $2.27 | 24d | 1 | 0.82mi |
| 4110 NW 10th St Delray Beach, FL | 3.0 | 2.5 | 1839 | $4,500 | $2.45 | 24d | 1 | 0.84mi |
| 797 NW 32nd Ave Delray Beach, FL | 2.0 | 2.0 | 1480 | $2,800 | $1.89 | 17d | 1 | 0.84mi |
| 797 NW 32nd Ave Delray Beach, FL | 2.0 | 2.0 | 1480 | $2,800 | $1.89 | 24d | 1 | 0.84mi |
| 1440 NW 20th Ave #104 Delray Beach, FL | 2.0 | 2.0 | 1335 | $2,650 | $1.99 | 14d | 1 | 0.86mi |
| 1640 NW 19th Ter #103 Delray Beach, FL | 2.0 | 2.0 | 1148 | $1,950 | $1.70 | 22d | 1 | 0.87mi |
| 1640 NW 19th Ter #103 Delray Beach, FL | 2.0 | 2.0 | 1148 | $1,950 | $1.70 | 8d | 1 | 0.87mi |
| 1551 NW 20th Ave #102 Delray Beach, FL | 2.0 | 2.0 | 1148 | $1,995 | $1.74 | 24d | 1 | 0.89mi |
| 13487 Barwick Rd Unit B Delray Beach, FL | 2.0 | 1.5 | 1092 | $3,900 | $3.57 | 24d | 1 | 0.89mi |
| 1641 NW 19th Ter Unit 46A Delray Beach, FL | 2.0 | 2.0 | 1104 | $2,000 | $1.81 | 19d | 1 | 0.90mi |
| 1914 Palmland Dr Unit C Boynton Beach, FL | 2.0 | 2.0 | 1026 | $2,300 | $2.24 | 15d | 1 | 0.90mi |
| 1916 Palmland Dr Unit D Boynton Beach, FL | 3.0 | 2.0 | 1080 | $3,200 | $2.96 | 24d | 1 | 0.92mi |
| 1860 NW 13th St #201 Delray Beach, FL | 2.0 | 2.0 | 1335 | $2,800 | $2.10 | 24d | 1 | 0.94mi |
| 1520 NW 19th Ter #203 Delray Beach, FL | 2.0 | 2.0 | 1335 | $2,200 | $1.65 | 24d | 1 | 0.94mi |
| 3996 NW 7th Ct Delray Beach, FL | 3.0 | 2.0 | 1480 | $5,000 | $3.38 | 24d | 1 | 0.95mi |
| 1441 NW 19th Ter #201 Delray Beach, FL | 2.0 | 2.0 | 1148 | $2,250 | $1.96 | 24d | 1 | 0.95mi |
| 1560 NW 18th Ave #104 Delray Beach, FL | 2.0 | 2.0 | 1148 | $2,100 | $1.83 | 22d | 1 | 0.95mi |
| 1560 NW 18th Ave #104 Delray Beach, FL | 2.0 | 2.0 | 1148 | $2,100 | $1.83 | 21d | 1 | 0.95mi |
| 2622 NW 7th Ct Delray Beach, FL | 2.0 | 2.5 | 1384 | $2,750 | $1.99 | 24d | 1 | 0.97mi |
| 2712 Lake Ida Rd Delray Beach, FL | 3.0 | 2.0 | 1604 | $4,000 | $2.49 | 8d | 1 | 1.00mi |
| 2941 Angler Dr Delray Beach, FL | 3.0 | 2.0 | 1578 | $5,000 | $3.17 | 24d | 1 | 1.01mi |
| 340 Lake Monterey Cir Boynton Beach, FL | 2.0 | 2.5 | 1188 | $2,350 | $1.98 | 24d | 1 | 1.04mi |
| 1631 NW 18th Ave #201 Delray Beach, FL | 2.0 | 2.0 | 1148 | $3,300 | $2.87 | 24d | 1 | 1.05mi |
| 400 Lake Monterey Cir Boynton Beach, FL | 2.0 | 2.5 | 1144 | $2,400 | $2.10 | 11d | 1 | 1.05mi |
| 161 Monterey Bay Dr Boynton Beach, FL | 2.0 | 2.5 | 1188 | $2,300 | $1.94 | 18d | 1 | 1.07mi |
| 161 Monterey Bay Dr Boynton Beach, FL | 2.0 | 2.5 | 1188 | $2,300 | $1.94 | 3d | 1 | 1.07mi |
| 161 Monterey Bay Dr #161 Boynton Beach, FL | 2.0 | 2.5 | 1188 | $2,200 | $1.85 | 3d | 1 | 1.07mi |
| 161 Monterey Bay Dr #161 Boynton Beach, FL | 2.0 | 2.5 | 1188 | $2,250 | $1.89 | 14d | 1 | 1.07mi |
| 161 Monterey Bay Dr #161 Boynton Beach, FL | 2.0 | 2.5 | 1188 | $2,300 | $1.94 | 24d | 1 | 1.07mi |
| 169 Monterey Bay Dr Boynton Beach, FL | 3.0 | 2.5 | 1389 | $2,800 | $2.02 | 24d | 1 | 1.07mi |
HOA detail condo
- Monthly dues
- $1,576 · $18,912/yr
- Likely covers
- poolgym
- Assessments
- None detected in remarks — confirm with the listing agent.
Listing history 39 events
-
2026-06-18days on market $20,000 Active 58 DOM
-
2026-06-17days on market $20,000 Active 57 DOM
-
2026-06-16days on market $20,000 Active 56 DOM
-
2026-06-15days on market $20,000 Active 55 DOM
-
2026-06-13days on market $20,000 Active 53 DOM
-
2026-06-09days on market $20,000 Active 49 DOM
-
2026-06-08days on market $20,000 Active 48 DOM
-
2026-06-07days on market $20,000 Active 47 DOM
-
2026-06-04days on market $20,000 Active 44 DOM
-
2026-06-03days on market $20,000 Active 43 DOM
-
2026-06-02days on market $20,000 Active 42 DOM
-
2026-06-01days on market $20,000 Active 41 DOM
-
2026-05-31days on market $20,000 Active 40 DOM
-
2026-04-20$20,000 Active
-
2026-01-01historical
-
2025-08-24historical $4,500
-
2025-05-14$4,500
-
2025-05-14historical $4,500
-
2025-05-14$4,500
-
2025-04-16$10,000 Active
-
2025-01-23historical
-
2024-09-14price $9,499
-
2024-09-14status Active
-
2024-09-05historical
-
2024-06-11status Active
-
2024-06-05historical
-
2024-04-12price $9,500
-
2024-01-05status Active
-
2024-01-01historical
-
2023-07-31status Active
-
2023-07-31historical
-
2023-07-05price $49,900
-
2023-06-20price $59,900
-
2023-03-27price $66,900
-
2023-02-03$84,900 Active
-
2004-05-27soldstatus $77,000
-
2001-08-09soldstatus $60,000
-
2000-07-06historical
-
1999-05-10$55,000
ⓘ Source: listings_history table (triggers on properties + properties_extension) + one-shot
backfill from property_details.listing_events for pre-trigger history.
Tax reassessment forecast FL · Resets to sale price
- Current annual tax
- $847 · $71/mo
- Projected year-2 tax
- $847 · $71/mo
- Expected delta
- $0/yr ($0/mo · 0.0%)
ⓘ Screening estimate from a state-policy table — verify with the county assessor before closing.
Climate risk First Street
- Flood 4/10 Moderate FEMA zone X (unshaded) · 21% chance over 30 yrs
- Wildfire 1/10 Low
- Heat 9/10 Extreme 5 d/yr ≥106°F today · 17 d/yr by 30 yrs out
- Wind 10/10 Extreme 99% chance of damaging wind over 30 yrs
- Air quality 2/10 Low 1 unhealthy d/yr today · 2 by 30 yrs out
Nearby sold comps map
Loading sold comps map…
Walkable amenities ~0.75 mi
Loading nearby amenities…
Taxation est. · year 1
- Rental income
- $34,936
- − Mortgage interest
- −$1,120
- − Property taxes
- −$847
- − Insurance
- −$100
- − Repairs & maintenance
- −$2,795
- − Management
- −$2,795
- − HOA
- −$18,912
- − Depreciation
- −$582
- Taxable income
- $7,785
- Est. tax owed @ 24.0%
- −$1,868
- After-tax cash flow
- $4,614/yr
For passive investors: Depreciation is non-cash, so a rental often shows a tax loss while cash-flowing — sheltering income. Rental losses are passive: they offset passive income freely, and up to $25,000/yr can offset ordinary (W-2) income if you actively participate and your MAGI is under $100k (phasing out to $0 by $150k); unused losses carry forward. On sale, claimed depreciation is recaptured at up to 25%, and gains may owe capital-gains tax (a 1031 exchange can defer both). Figures are a year-1 estimate at your 24.0% rate — not tax advice; consult a CPA.
Schools (NCES district)
- District
- Palm Beach
- NCES district ID
- 1201500
- Math proficiency
- 46% ▼ -16.00%
- Reading proficiency
- 53% ▼ -4.00%
- Median HH income
- $53,943
- Composite
- 42.72/100
- National rank
- #3160
- State rank
- #34 of 73 in FL
Livability — Boynton Beach
- Score
- 72/100
- State rank
- #351
- US rank
- #6098
Category grades
Schools grade is shown separately in the Schools card above.
Census & demographics
- Census place
- Boynton Beach, FL
- County
- Palm Beach County · 1,438,312 people
- City population
- 148,060
- Metro
- Miami-Fort Lauderdale-Pompano Beach, FL
- Population (ZIP)
- 48,743
- Household income
- $75,789
- Rent vs Own
- Severe rent burden
- 1813.0
Population outlook (Palm Beach County) Hauer SSP2
- Today (2025)
- 1,637,487 people
- By 2030
- 1,743,255 · +6.5%
- By 2040
- 1,948,712 · +19.0%
- By 2050
- 2,132,979 · +30.3%
- By 2075
- 2,530,027 · +54.5%
- By 2100
- 2,706,979 · +65.3%
Race, ethnicity, and origin ACS 2023
- Neighborhood character
- Diverse neighborhood (Simpson 0.64)
- Race & ethnicity
- White 52% Black 24% Hispanic / Latino 19% Two or more races 10% Asian 2%
- Hispanic origin (detail)
- Mexican 2% Puerto Rican 4% Cuban 3% Dominican 1%
- Common ancestry
- Hispanic 12% Romanian 3% Scotch-Irish 2%
- Foreign-born
- 27% · Canada, Jamaica, Vietnam
- Languages at home
- 64% English-only · Spanish 14% French/Haitian/Cajun 13% Other Indo-European 2%
Political lean MEDSL · Palm Beach
- 2024 margin
- Toss-up / Even · D 50.0% · R 49.2%
- 2008→2024 swing
- -22.1pp toward R · 2008: 22.9pp · 2024: 0.8pp
- All cycles
- 2024: D+0.8 2020: D+12.8 2016: D+15.3 2012: D+17.0 2008: D+22.9
Not yet ingested
- Civics
- —
Market trends
- HPI YoY
- ▼ -109.59%
- Current HPI
- 311.7742
- Rent YoY
- ▼ -0.57%
- Metro
- Miami-Fort Lauderdale-Pompano Beach, FL
- State GDP YoY
- ▲ 3.28%
- F500 in state
- 36
Industry mix (Fortune 500 HQ in FL)
| Industry | F500 HQs | Revenue |
|---|---|---|
| Industrial Technology | 2 | $29B |
|
||
| Insurance | 2 | $17B |
|
||
| Retail | 1 | $60B |
|
||
| Technology Distribution | 1 | $58B |
|
||
| Homebuilding | 1 | $35B |
|
||
| Technology Manufacturing | 1 | $35B |
|
||
Price history
-63.6% since first listed26 events — show timeline
- 2026-04-20 Listed $20,000 Beaches MLS
- 2026-01-01 Listing Removed — Beaches MLS
- 2025-08-24 Rental Removed $4,500 RMLSFL
- 2025-05-14 Listed for Rent $4,500 RMLSFL
- 2025-05-14 Rental Removed $4,500 GFLMLS
- 2025-05-14 Listed for Rent $4,500 GFLMLS
- 2025-04-16 Listed $10,000 Beaches MLS
- 2025-01-23 Listing Removed — Beaches MLS
- 2024-09-14 Price Changed $9,499 Beaches MLS
- 2024-09-14 Relisted — Beaches MLS
- 2024-09-05 Listing Removed — Beaches MLS
- 2024-06-11 Relisted — Beaches MLS
- 2024-06-05 Listing Removed — Beaches MLS
- 2024-04-12 Price Changed $9,500 Beaches MLS
- 2024-01-05 Relisted — Beaches MLS
- 2024-01-01 Listing Removed — Beaches MLS
- 2023-07-31 Relisted — Beaches MLS
- 2023-07-31 Listing Removed — Beaches MLS
- 2023-07-05 Price Changed $49,900 Beaches MLS
- 2023-06-20 Price Changed $59,900 Beaches MLS
- 2023-03-27 Price Changed $66,900 Beaches MLS
- 2023-02-03 Listed $84,900 Beaches MLS
- 2004-05-27 Sold (Public Records) $77,000 Public Records
- 2001-08-09 Sold (Public Records) $60,000 Public Records
- 2000-07-06 Listing Removed — Beaches MLS
- 1999-05-10 Listed $55,000 Beaches MLS
Property tax history
-0.9%/yrLatest (2025): $847 · -18.3% YoY. Source: county tax records.
Cash-flow waterfall
monthlySold comps — $/sqft
last 12 mo · ≤1 miLoading sold comps…