3529 Cleveland St · Dallas, TX
Flood risk No data
- FEMA flood zone
- —
- Chance of flooding over 30 yrs
- —
- Est. flood insurance / yr
- —
Fire risk No data
- Est. fire insurance / yr
- —
Heat risk No data
- Hot days now (above threshold)
- —
- Hot days in 30 yrs
- —
Wind risk No data
- Chance of severe wind over 30 yrs
- —
Air-quality risk No data
- Unhealthy air days now
- —
- Unhealthy air days in 30 yrs
- —
Risk factors via First Street. Map © Google.
Why this score? — see what drove the B grade
The composite is a weighted blend of 9 inputs, each scored 0–100. Each bar is that input's sub-score; the figure is the points it added to the 100-point composite (weight × sub-score).
- Cash flow +23.2/30.0
- ARV discount +15.0/15.0
- DSCR +7.5/10.0
- 1% rule +6.1/10.0
- Appreciation +5.4/10.0
- Rent growth +4.3/5.0
- Livability +4.0/5.0
- Condition / age +4.0/5.0
- Schools +2.8/10.0
$245,000
🖨 Deal sheet 📄 Offer letter ✓ Due diligence
Listing remarks
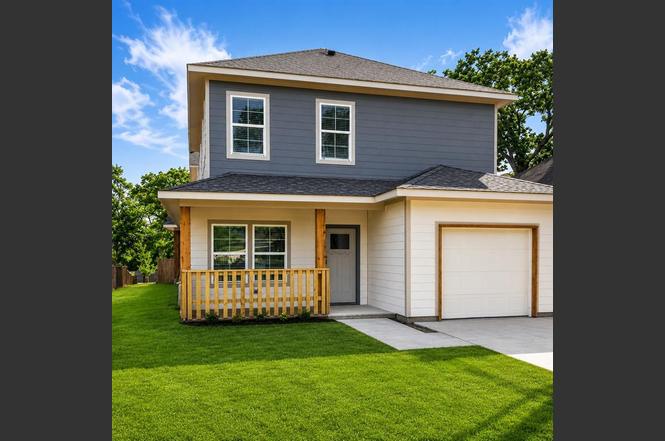
This is a must see picture perfect purchase opportunity! This newly constructed home is only minutes from downtown Dallas and Fair Park and is part of a major revitalization project in south Dallas. This well crafted home features a large well appointed primary suite downstairs with an ensuite bathroom and spacious walk-in closet. The home features four bedrooms and three full bathrooms and one half bathroom. The kitchen is large and bright with a large granite top island, granite counters and tile backsplash with plenty of cabinet space. The build quality is apparent from the moment you drive and enter the property. The home was built to supply a need for quality affordable housing. Specia
Key facts
- Tile backsplash
- 8,364 sq ft lot
- Garage
Tags
Property features AI
Finance
- Other: Builder special listing condition; Possession at closing/funding
- Financial info: Listing accepts Cash, Conventional and FHA financing
- HOA & community: No association
Exterior
- Parking: Attached garage (1 space, approximately 10' x 20'); Covered parking / carport (1 space); Garage faces front
- Security: Burglar alarm; Smoke detector(s); Audio and video surveillance present
- Utilities: City water; City sewer; Asphalt access; Cable available; Not in a municipal utility district
- Home design: Single family residence; Two levels; Property attached (yes); New construction completed in 2026; Smart home features
- Construction: Composition roof; Slab foundation; New construction - complete (2026)
- Exterior features: Covered porch(es); Metal fencing; Lot less than 0.5 acre
Interior
- Kitchen: Dishwasher; Garbage disposal; Electric cooktop; Electric oven; Built-in cabinets; Granite countertops; Kitchen island; Eat-in kitchen
- Bedrooms: Primary bedroom on level 1 with ensuite bath, separate shower, and walk-in closet; Bedroom on level 2 with ensuite bath and walk-in closet; Two additional bedrooms on level 2, each with walk-in closet(s)
- Flooring: Carpet; Laminate
- Bathrooms: 3 full bathrooms; 1 half bathroom
- Heating & cooling: Central heating (electric); Central air (electric); Ceiling fan(s)
- Interior features: Cable TV available; Eat-in kitchen; Granite counters; Kitchen island; Walk-in closet(s); Other
- Laundry & utility: Washer hookup in hall
Neighborhood map
What this means for you Summary
Snapshot
- This is a 4-bed/3.5-bath single-family listed at $245k. Condition is rated good.
Deal economics
- At list price, monthly cash flow is $446 ($5k/yr) — positive.
- The deal already cash-flows at list — no discount required.
- Meets the 1% rule at list price ($3k rent vs $245k).
- Cap rate 8.5% vs local median 2.3% in Dallas — top-decile yield for the area; either an underpriced asset or a hidden risk that comps aren't pricing in. Stress-test before assuming the spread holds.
Location & tenants
- Location reads 81/100 on livability (#24 in TX, #1,380 nationally) — a professional / high-income tenant draw. Strengths: amenities A+, commute A+, housing A+; Watch: crime F.
- Dallas ISD (urban): math 31% / reading 36% proficiency, ranked #559 of 826 in TX (top 68%) — families likely to look elsewhere, expect single-tenant / working-renter base with shorter leases; 83% free/reduced lunch — lower-income household profile, screen leases tightly.
- Zoned schools: Paul L Dunbar Learning Center (math 27% / reading 22%, grade F, #3,052 of 4,322 statewide, top 74%, 531 students, 95% FRL).
- Market conditions: Rents rising fast (+7.2%/yr); 248 active listings in the ZIP; 29 comparable units currently listed for rent nearby; rentals at typical pace (median 25d on market — plan ~3-4 weeks tenant-placement turnaround); 41% of comp listings sitting > 30 days — soft ceiling on asking rent; 12,577 units permitted in Dallas County in 2024 (6,829 in 5+ unit buildings).
- At $2,707/mo this rent would consume 71% of the median local household income ($46k/yr) (locally 1464% of renters already pay >50% of income on rent) — very limited rent-growth headroom before tenants either downsize or default.
Forward outlook
- In year one you build about $4k of equity ($2k loan paydown + $2k appreciation (0.8% local appreciation)).
- Dallas County population projected at +35% by 2050 — long-run rental-demand tailwind backs the buy-and-hold thesis.
- At projected returns (0.8% appreciation + 7.2% rent growth), your $69k cash investment doubles in ~6 years — after that, you're playing with house money.
- By year 9, paydown + projected appreciation supports a ~$34k cash-out refi (75% LTV) — recoverable capital for the next deal without selling this one.
Negotiation context
- Only 1 days on market — expect competitive offers; lowballing is unlikely to land.
Questions for the listing agent
- Is there a deadline driving the sale (1031 exchange, divorce, estate, relocation)? That informs how much negotiation room exists.
- Crime grade is F in this area — have there been break-ins, vandalism, or insurance claims at this property in the last 3 years? What carrier currently insures it and at what premium?
- What's the average days-on-market for RENTAL listings here right now (not sales)? A rising rental-DOM trend means longer vacancies and softer asking-rent achievability than the comps imply.
- What's the recent tenant-quality profile in this submarket — average credit score on applications, eviction rate, late-payment / NSF rate, and stable-employment percentage? A property-management company in the area should have these aggregated.
- How much new for-sale + rental construction is in the pipeline within 1–3 miles? Heavy new supply typically softens prices + rents 12–24 months out; constrained supply supports both.
Investment metrics
- 1% rule
- 1.11% ✓
- Cap rate
- 8.48%
- Cash-on-cash
- 7.80%
- DSCR
- 1.35
- GRM
- 7.5
CMA / ARV
- ARV (on-the-fly)
- $352,586
- Comps found
- 12
Show comp detail 12 sales within ~0.75 mi
| Address | Dist | Beds/Ba | Sqft | Sold | Price | $/sf | Match |
|---|---|---|---|---|---|---|---|
| 1310 Coleman Ave | 0.13mi | 3/2.5 (-1) | 1,750 (-5%) | 7mo | $335,000 | $191 | 70 |
| 1312 Coleman Ave | 0.14mi | 3/2.5 (-1) | 1,750 (-5%) | 7mo | $335,000 | $191 | 70 |
| 3900 Colonial Ave | 0.43mi | 4/2.0 | 1,792 (-3%) | 2mo | $126,000 | $70 | 68 |
| 3604 Wendelkin St | 0.31mi | 4/3.0 | 2,000 (+8%) | 3mo | $388,500 | $194 | 67 |
| 1717 Poplar St | 0.53mi | 4/2.0 | 1,826 (-1%) | 7mo | $339,900 | $186 | 62 |
| 2317 Peabody Ave | 0.61mi | 4/2.5 | 1,792 (-3%) | 4mo | $314,500 | $176 | 60 |
| 3835 Spence St | 0.38mi | 4/3.0 | 2,064 (+12%) | 2mo | $420,000 | $203 | 59 |
| 3615 Atlanta St | 0.69mi | 4/2.5 | 1,976 (+7%) | 6mo | $309,900 | $157 | 47 |
| 2512 Peabody Ave | 0.73mi | 3/3.5 (-1) | 1,700 (-8%) | 2mo | $355,000 | $209 | 46 |
| 2326 Dathe St | 0.58mi | 3/2.0 (-1) | 1,728 (-6%) | 7mo | $365,000 | $211 | 46 |
| 1629 Pine St | 0.53mi | 3/3.0 (-1) | 1,628 (-12%) | 4mo | $245,000 | $150 | 45 |
| 3516 Booker St | 0.71mi | 4/2.0 | 1,606 (-13%) | 1mo | $268,500 | $167 | 39 |
Match score weights: distance 35% · size 25% · config 20% · recency 20%. Top-matched comps best support the ARV.
Projected returns pro-forma
0.79% appreciation · 7.19% rent growth · sell at horizon
- IRR
- 11.9%
- Equity multiple
- 1.62×
- Total profit
- $42,387
- Equity at exit
- $80,962
- IRR
- 18.5%
- Equity multiple
- 3.48×
- Total profit
- $169,786
- Equity at exit
- $105,551
Cash invested: $68,600 (down + closing). Projections, not guarantees.
Landlord ↔ Tenant lean methodology
- Overall (STATE)
- 87 Strongly Landlord-Friendly
- State Texas
- 87 Strongly Landlord-Friendly · R+5
- County
- — inherits STATE
- City
- — inherits STATE
ZIP-level market 75215
- Home prices YoY
- 0.3%
- Rents YoY
- 7.2%
- Active inventory
- 248
- Price-to-rent
- 7.5×
Monthly cashflow live
- Estimated rent
- $2,707 high interval (Pro) →
- Mortgage (P&I)
- −$1,285
- Tax est. 1.5%
- −$306 /mo · $3,675/yr
- Insurance
- −$102
- HOA
- −$0
- Vacancy / Maint / Mgmt
- −$569
- Net cashflow
- $446
Break-even live
UW: 25.0% down · 7.5% · 30yr · 1.5% tax · 5.0% vac · 8.0% maint · 8.0% mgmt
Financing live
Cash to close
- Down payment
- $61,250
- Closing costs
- $7,350
- Reserves months
- —
- Total cash needed
- —
Loan-product check · same deal, 3 products live
Conventional
25% down · 7.5% · 30yr
- Down + closing
- —
- Monthly P&I
- —
- Monthly cashflow
- —
- DSCR
- —
- Eligible?
- —
Personal DTI + credit; lowest rate.
DSCR
20% down · 8.5% · 30yr
- Down + closing
- —
- Monthly P&I
- —
- Monthly cashflow
- —
- DSCR
- —
- Eligible?
- —
No personal income docs; deal must DSCR.
Hard money
10% down · 12.0% · 12mo
- Down + closing
- —
- Monthly P&I
- —
- Monthly cashflow
- —
- DSCR
- —
- Eligible?
- —
Short-term bridge; refi at stabilization.
Rent comps 29 comps
| Address | Beds | Baths | Sqft | Rent | $/sqft | DOM | Units | Dist |
|---|---|---|---|---|---|---|---|---|
| 3609 Cleveland St Dallas, TX | 4.0 | 2.5 | 1500 | $2,700 | $1.80 | 7d | 1 | 0.04mi |
| 3413 Wendelkin St Dallas, TX | 3.0 | 2.5 | 1724 | $2,650 | $1.54 | 2d | 1 | 0.28mi |
| 3521 S Harwood St Dallas, TX | 3.0 | 2.5 | 1750 | $2,700 | $1.54 | 3d | 1 | 0.34mi |
| 4024 Colonial Ave Dallas, TX | 4.0 | 2.0 | 1560 | $2,400 | $1.54 | 24d | 1 | 0.50mi |
| 3502 Edgewood St Dallas, TX | 4.0 | 2.0 | 1866 | $2,523 | $1.35 | 2d | 1 | 0.52mi |
| 2507 Birmingham Ave Dallas, TX | 3.0 | 2.5 | 1516 | $2,500 | $1.65 | 24d | 1 | 0.67mi |
| 2312 Stoneman St Dallas, TX | 4.0 | 3.0 | 2106 | $3,100 | $1.47 | 4d | 1 | 0.82mi |
| 1713 Herald St Dallas, TX | 3.0 | 2.5 | 2142 | $2,300 | $1.07 | 7d | 1 | 0.94mi |
| 1711 Herald St Dallas, TX | 3.0 | 2.5 | 2140 | $2,350 | $1.10 | 43d | 1 | 0.94mi |
| 2618 Carpenter Ave Dallas, TX | 4.0 | 3.0 | 2050 | $3,200 | $1.56 | 43d | 1 | 1.01mi |
| 1100 Corinth St Dallas, TX | 2.0–3.0 | 2.5–3.5 | 1572 | $3,595 | $2.29 | 43d | 10 | 1.03mi |
| 2847 Metropolitan Ave Dallas, TX | 3.0 | 1.0 | 1344 | $2,050 | $1.53 | 22d | 1 | 1.03mi |
| 1512 Seegar St Unit 1508 Dallas, TX | 3.0 | 3.5 | 2003 | $3,250 | $1.62 | 43d | 1 | 1.09mi |
| 1508 Seegar St Dallas, TX | 3.0 | 3.5 | 1966 | $3,124 | $1.59 | 14d | 9 | 1.09mi |
| 512 Avenue L Dallas, TX | 3.0 | 4.0 | 2551 | $3,400 | $1.33 | 7d | 1 | 1.11mi |
| 1805 Browder St Unit 1019612P Dallas, TX | 3.0 | 3.5 | 2357 | $6,830 | $2.90 | 6d | 1 | 1.18mi |
| 1805 Browder St #103 Dallas, TX | 3.0 | 3.5 | 2358 | $8,000 | $3.39 | 43d | 1 | 1.18mi |
| 1874 Beaumont St Dallas, TX | 4.0 | 5.0 | 2578 | $4,900 | $1.90 | 43d | 1 | 1.26mi |
| 2246 Hooper St Dallas, TX | 3.0 | 3.0 | 1870 | $2,400 | $1.28 | 43d | 1 | 1.28mi |
| 2207 Anderson St Dallas, TX | 3.0 | 2.5 | 1419 | $2,300 | $1.62 | 7d | 1 | 1.29mi |
| 2406 Merlin St Dallas, TX | 3.0 | 2.5 | 2004 | $2,500 | $1.25 | 7d | 1 | 1.33mi |
| 3915 Coolidge St Dallas, TX | 4.0 | 2.0 | 1416 | $2,100 | $1.48 | 43d | 1 | 1.36mi |
| 5000 Linder Ave Dallas, TX | 3.0 | 2.0 | 1327 | $1,950 | $1.47 | 43d | 1 | 1.39mi |
| 2521 Bethurum Ave Dallas, TX | 3.0 | 2.5 | 1600 | $2,300 | $1.44 | 43d | 1 | 1.41mi |
| 4934 Echo Ave Dallas, TX | 5.0 | 4.0 | 1815 | $2,900 | $1.60 | 43d | 1 | 1.41mi |
| 519 High St Dallas, TX | 4.0 | 2.0 | 1869 | $6,000 | $3.21 | 43d | 1 | 1.43mi |
| 2216 Dyson St Dallas, TX | 3.0 | 2.0 | 2500 | $2,000 | $0.80 | 11d | 1 | 1.44mi |
| 3331 Spring Ave Dallas, TX | 3.0 | 2.0 | 1652 | $2,200 | $1.33 | 7d | 1 | 1.50mi |
| 3331 Spring Ave Dallas, TX | 3.0 | 2.0 | 1652 | $2,200 | $1.33 | 24d | 1 | 1.50mi |
Listing history 2 events
-
2026-06-17remarks 699-char remark
-
2026-06-17$245,000 Active 1 DOM
ⓘ Source: listings_history table (triggers on properties + properties_extension) + one-shot
backfill from property_details.listing_events for pre-trigger history.
Nearby sold comps map
Loading sold comps map…
Walkable amenities ~0.75 mi
Loading nearby amenities…
Taxation est. · year 1
- Rental income
- $32,489
- − Mortgage interest
- −$13,724
- − Property taxes
- −$3,675
- − Insurance
- −$1,225
- − Repairs & maintenance
- −$2,599
- − Management
- −$2,599
- − Depreciation
- −$7,127
- Taxable income
- $1,539
- Est. tax owed @ 24.0%
- −$369
- After-tax cash flow
- $4,979/yr
For passive investors: Depreciation is non-cash, so a rental often shows a tax loss while cash-flowing — sheltering income. Rental losses are passive: they offset passive income freely, and up to $25,000/yr can offset ordinary (W-2) income if you actively participate and your MAGI is under $100k (phasing out to $0 by $150k); unused losses carry forward. On sale, claimed depreciation is recaptured at up to 25%, and gains may owe capital-gains tax (a 1031 exchange can defer both). Figures are a year-1 estimate at your 24.0% rate — not tax advice; consult a CPA.
Condition & rehab AI · 1 photo
This newly constructed single-family home in Dallas is in excellent condition with a good condition score of 80. It features a large kitchen, three full bathrooms, and is well-maintained both inside and out. The property is ideal for both resale and rental due to its location and quality build.
Value-add opportunities
- Both Painting the exterior and interior — Fresh paint enhances curb appeal and interior aesthetics.
- Both Landscaping improvements — Enhanced landscaping can increase curb appeal and property value.
- Resale Kitchen appliances — Upgrading to high-end appliances can attract more buyers.
- Resale Bathroom fixtures — Modernizing bathrooms can increase appeal to potential buyers.
- Rental HVAC system maintenance — A well-maintained HVAC system ensures comfort and reduces utility costs for renters.
Renovation cost estimate screening
Value-add ROI direction
- Both Painting the exterior and interior — Fresh paint enhances curb appeal and interior aesthetics. ↑
- Both Landscaping improvements — Enhanced landscaping can increase curb appeal and property value. ↑
- Resale Kitchen appliances — Upgrading to high-end appliances can attract more buyers. ↑
- Resale Bathroom fixtures — Modernizing bathrooms can increase appeal to potential buyers. ↑
- Rental HVAC system maintenance — A well-maintained HVAC system ensures comfort and reduces utility costs for renters. ↑
ⓘ Cost ranges are severity-bucket heuristics (US national rule-of-thumb). Get contractor quotes + a written scope before underwriting a rehab budget.
Schools (NCES district)
- District
- Dallas ISD
- NCES district ID
- 4816230
- Math proficiency
- 31% ▼ -16.00%
- Reading proficiency
- 36% ▼ -4.00%
- Median HH income
- $42,881
- Composite
- 28.41/100
- National rank
- #6763
- State rank
- #559 of 826 in TX
Livability — Dallas
- Score
- 81/100
- State rank
- #24
- US rank
- #1380
Category grades
Schools grade is shown separately in the Schools card above.
Census & demographics
- Census place
- Dallas, TX
- County
- Dallas County · 2,612,404 people
- City population
- 1,168,437
- Metro
- Dallas-Fort Worth-Arlington, TX
- Population (ZIP)
- 18,895
- Household income
- $45,557
- Rent vs Own
- Severe rent burden
- 1464.0
Population outlook (Dallas County) Hauer SSP2
- Today (2025)
- 2,979,839 people
- By 2030
- 3,191,823 · +7.1%
- By 2040
- 3,619,611 · +21.5%
- By 2050
- 4,026,915 · +35.1%
- By 2075
- 4,957,073 · +66.4%
- By 2100
- 5,508,725 · +84.9%
Race, ethnicity, and origin ACS 2023
- Neighborhood character
- Diverse neighborhood (Simpson 0.58)
- Race & ethnicity
- Black 59% Hispanic / Latino 25% White 11% Two or more races 10%
- Hispanic origin (detail)
- Mexican 21%
- Common ancestry
- Italian 1% Hispanic 1%
- Foreign-born
- 16% · Canada
- Languages at home
- 74% English-only · Spanish 26%
Political lean MEDSL · Dallas
- 2024 margin
- Strong D (+22.2) · D 60.2% · R 38.0% · Other 1.8%
- 2008→2024 swing
- +6.9pp toward D · 2008: 15.3pp · 2024: 22.2pp
- All cycles
- 2024: D+22.2 2020: D+31.6 2016: D+26.2 2012: D+15.4 2008: D+15.3
Not yet ingested
- Civics
- —
Market trends
- HPI YoY
- ▲ 0.79%
- Current HPI
- 224.2955
- Rent YoY
- ▲ 7.19%
- Metro
- Dallas-Fort Worth-Arlington, TX
- State GDP YoY
- ▲ 3.95%
- F500 in state
- 110
Industry mix (Fortune 500 HQ in TX)
| Industry | F500 HQs | Revenue |
|---|---|---|
| Energy | 16 | $1,198B |
|
||
| Technology | 5 | $198B |
|
||
| Engineering / Construction | 4 | $72B |
|
||
| Energy Services | 3 | $60B |
|
||
| Utilities | 3 | $41B |
|
||
| Healthcare | 2 | $330B |
|
||
Price history
1 event — show timeline
- 2026-06-17 Listed $245,000 NTREIS
Cash-flow waterfall
monthlySold comps — $/sqft
last 12 mo · ≤1 miLoading sold comps…