 🌊 Lakefront
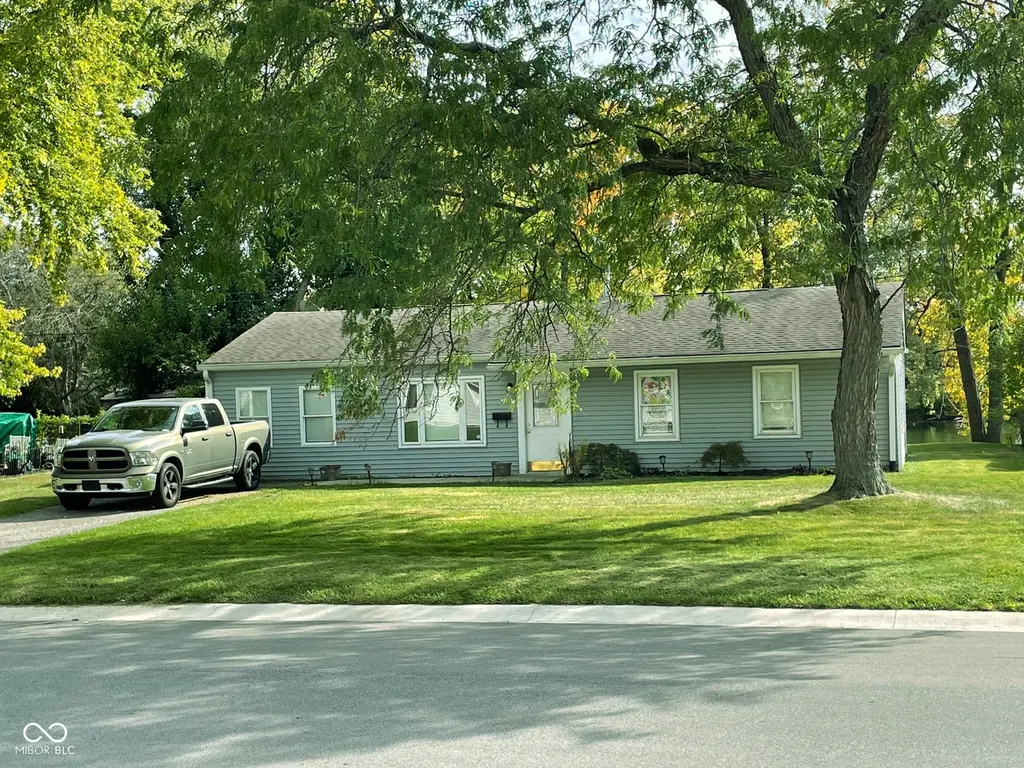
661 E Pearl St · Greenwood, IN
Flood risk 1/10 · Minimal
- FEMA flood zone
- X (unshaded)
- Chance of flooding over 30 yrs
- 0.0%
- Est. flood insurance / yr
- $507 – $1,088
Fire risk 1/10 · Minimal
- Est. fire insurance / yr
- $717 – $1,331
Heat risk 3/10 · Minor
- Hot days now (above 100°F)
- 7 days/yr
- Hot days in 30 yrs
- 19 days/yr
Wind risk 2/10 · Minimal
- Chance of severe wind over 30 yrs
- 1.0%
Air-quality risk 2/10 · Minimal
- Unhealthy air days now
- 2 days/yr
- Unhealthy air days in 30 yrs
- 2 days/yr
Risk factors via First Street. Map © Google.
Why this score? — see what drove the C- grade
The composite is a weighted blend of 9 inputs, each scored 0–100. Each bar is that input's sub-score; the figure is the points it added to the 100-point composite (weight × sub-score).
- Cash flow +15.1/30.0
- ARV discount +15.0/15.0
- DSCR +4.6/10.0
- Schools +4.0/10.0
- Livability +3.7/5.0
- 1% rule +3.1/10.0
- Rent growth +3.0/5.0
- Condition / age +2.5/5.0
- Appreciation +0.0/10.0
$209,000
🖨 Deal sheet (PDF) 📄 Offer letter ✓ Due diligence
Listing remarks MLS
What a hidden secret in the heart of Greenwood! Great condition, convenient location, plus a secluded & private lot on lake. Three bedroom ranch, complete remodel, two separate living areas, huge great room 25x13 with b eautiful bay window view of water, spacious kitchen with open pass through to great room, all new appliances inc. washer, dryer, refrigerator, oven/range, separate laundry room, new carpet & flooring, newer windows. Just a lovely place to call home!
Key facts
- Lakefront
- Water views
- Eat-in kitchen
Tags
Property features AI
Finance
- HOA & community: Not a low-maintenance lifestyle community
Exterior
- Parking: Asphalt parking
- Utilities: Public water; Municipal sewer connected; Cable available
- Home design: Single family residence; One level
- Construction: Vinyl siding; Slab foundation
- Exterior features: Patio; Porch; Storage shed; Mature trees; Street lights; Lakefront location with waterfront view; Lot under 1/4 acre
Interior
- Kitchen: Electric oven; Range hood; Microwave; Dishwasher; Refrigerator; Kitchen island; Eat-in kitchen; Breakfast bar
- Bedrooms: Three bedrooms on the main level
- Bathrooms: One full bathroom (main level)
- Interior features: Attic access; Woodwork painted; Eat-in kitchen; Breakfast bar; Kitchen island; Smoke alarm
- Laundry & utility: Washer and dryer; Gas water heater
Neighborhood map
What this means for you Summary
Snapshot
- This is a 3-bed/1.0-bath single-family listed at $209k.
Deal economics
- At list price, monthly cash flow is $70 ($843/yr) — positive.
- The deal already cash-flows at list — no discount required.
- To meet the 1% rule (rent ≥ 1% of price), the offer needs to be $169k (19.0% below list).
- Recommended offer: $169k (19.0% below list) — sets the bar for 1% rule.
- Cap rate 6.7% vs local median 4.5% in Greenwood — top-decile yield for the area; either an underpriced asset or a hidden risk that comps aren't pricing in. Stress-test before assuming the spread holds.
Location & tenants
- Location reads 73/100 on livability (#91 in IN) — a middle-class / working-renter tenant base. Strengths: cost of living A+, housing A+, crime A; Watch: amenities F, commute F, health & safety F.
- Greenwood Community School Corporation (suburban): math 41% / reading 52% proficiency, ranked #88 of 301 in IN (top 29%) — families likely to look elsewhere, expect single-tenant / working-renter base with shorter leases.
- Zoned schools: V O Isom Central Elem School (math 42% / reading 37%, grade F, #500 of 994 statewide, top 53%, 361 students, 70% FRL); Greenwood Middle School (math 36% / reading 52%, grade D, #87 of 330 statewide, top 27%, 948 students, 53% FRL); Greenwood Community High Sch (math 37% / reading 79%, grade C, #62 of 369 statewide, top 17%, 1,175 students, 43% FRL) — zoned schools average 56% FRL vs 38% district-wide (18 pts higher); higher-poverty schools than district average — tighter screening recommended.
- Market conditions: Rents rising (+1.9%/yr); 80 active listings in the ZIP; 20 comparable units currently listed for rent nearby; rentals leasing fast (median 4d on market — plan ~1-2 weeks tenant-placement turnaround); solid renter incomes; 1,133 units permitted in Johnson County in 2024 (0 in 5+ unit buildings).
Forward outlook
- Local home prices are declining (-3.0%/yr); year-one equity from $1k of loan paydown is wiped out by about $6k of value loss. Plan a longer hold.
- Johnson County population projected at +26% by 2050 — long-run rental-demand tailwind backs the buy-and-hold thesis.
Negotiation context
- Only 7 days on market — expect competitive offers; lowballing is unlikely to land.
- 3 sale attempts since 20y ago with the ask held roughly flat each time — persistent listings suggest the price (not the market) is what's stuck; bring a comps-based counter.
- Current owner paid $98k; list at $209k implies a 113% gain — meaningful room to come down on a strong offer.
Risks & watch-outs
- Watch-outs: built in 1958 — expect roof / HVAC / electrical / plumbing capex.
Questions for the listing agent
- Built in 1958 — when were the roof, HVAC, electrical panel, plumbing, and water heater last replaced?
- Is there a deadline driving the sale (1031 exchange, divorce, estate, relocation)? That informs how much negotiation room exists.
- Schools are B-rated — typically a magnet for longer-tenancy family renters. What's the average tenant stay here, and is there a school-zone premium baked into asking?
- This sits on a lake — are riparian / water-frontage rights deeded with the parcel? Any dock permits, shoreline easements, or HOA water-use restrictions?
- What's the documented flood / surge / shoreline-erosion history here (FEMA AND non-FEMA — e.g., storm surge, creek backup, septic-field saturation)?
- Any water-quality or seasonal algae-bloom issues that affect tenant satisfaction or short-term-rental demand?
- What's the average days-on-market for RENTAL listings here right now (not sales)? A rising rental-DOM trend means longer vacancies and softer asking-rent achievability than the comps imply.
- What's the recent tenant-quality profile in this submarket — average credit score on applications, eviction rate, late-payment / NSF rate, and stable-employment percentage? A property-management company in the area should have these aggregated.
- How much new for-sale + rental construction is in the pipeline within 1–3 miles? Heavy new supply typically softens prices + rents 12–24 months out; constrained supply supports both.
Investment metrics
- 1% rule
- 0.81% ✗
- Cap rate
- 6.70%
- Cash-on-cash
- 1.44%
- DSCR
- 1.06
- GRM
- 10.3
CMA / ARV
- ARV (on-the-fly)
- $285,525
- Comps found
- 12
Show comp detail 12 sales within ~0.75 mi
| Address | Dist | Beds/Ba | Sqft | Sold | Price | $/sf | Match |
|---|---|---|---|---|---|---|---|
| 706 Alexander St | 0.17mi | 3/1.0 | 1,206 (+3%) | 22mo | $152,000 | $126 | 69 |
| 235 N Meridian St | 0.74mi | 3/1.0 | 1,176 (+0%) | 1mo | $155,000 | $132 | 64 |
| 196 Spring Meadow Ln | 0.45mi | 3/2.0 | 1,202 (+2%) | 10mo | $249,900 | $208 | 63 |
| 582 Park Ave | 0.34mi | 3/2.0 | 1,200 (+2%) | 17mo | $215,000 | $179 | 63 |
| 394 Polk Village Rd | 0.49mi | 3/2.0 | 1,133 (-4%) | 7mo | $225,000 | $199 | 61 |
| 454 E Broadway St | 0.33mi | 3/1.5 | 1,264 (+8%) | 12mo | $225,000 | $178 | 60 |
| 966 Marcy Ln | 0.49mi | 3/2.0 | 1,218 (+4%) | 15mo | $255,000 | $209 | 54 |
| 440 Southgate Dr | 0.60mi | 3/1.0 | 1,224 (+4%) | 20mo | $167,850 | $137 | 49 |
| 476 Southgate Dr | 0.69mi | 4/1.0 (+1) | 1,149 (-2%) | 13mo | $150,000 | $131 | 48 |
| 470 Park Dr | 0.62mi | 3/1.0 | 1,116 (-5%) | 19mo | $230,000 | $206 | 47 |
| 453 Carol Dr | 0.64mi | 3/1.0 | 1,291 (+10%) | 12mo | $232,000 | $180 | 43 |
| 290 Polk Manor Dr | 0.51mi | 3/2.0 | 1,332 (+13%) | 8mo | $251,000 | $188 | 43 |
Match score weights: distance 35% · size 25% · config 20% · recency 20%. Top-matched comps best support the ARV.
Projected returns pro-forma
-3.0% appreciation · 1.95% rent growth · sell at horizon
- IRR
- -15.1%
- Equity multiple
- 0.47×
- Total profit
- $-31,247
- Equity at exit
- $31,163
- IRR
- -8.2%
- Equity multiple
- 0.51×
- Total profit
- $-28,900
- Equity at exit
- $18,071
Cash invested: $58,520 (down + closing). Projections, not guarantees.
Landlord ↔ Tenant lean methodology
- Overall (STATE)
- 90 Strongly Landlord-Friendly
- State Indiana
- 90 Strongly Landlord-Friendly · R+11
- County
- — inherits STATE
- City
- — inherits STATE
ZIP-level market 46143
- Rents YoY
- 1.9%
- Active inventory
- 80
- Price-to-rent
- 10.3×
Monthly cashflow live
- Estimated rent
- $1,694 high interval (Pro) →
- Mortgage (P&I)
- −$1,096
- Tax from tax record
- −$85 /mo · $1,018/yr
- Insurance
- −$87
- HOA
- −$0
- Vacancy / Maint / Mgmt
- −$356
- Net cashflow
- $70
Break-even live
Sensitivity live
| Price | -10% $189 | -5% $129 | +0% $70 | +5% $11 | +10% $-48 |
|---|---|---|---|---|---|
| Rent | -10% $-64 | -5% $3 | +0% $70 | +5% $137 | +10% $204 |
| Rate | -1.0pp $176 | -0.5pp $123 | base $70 | +0.5pp $16 | +1.0pp $-39 |
UW: 25.0% down · 7.5% · 30yr · 1.5% tax · 5.0% vac · 8.0% maint · 8.0% mgmt
Financing live
Cash to close
- Down payment
- $52,250
- Closing costs
- $6,270
- Reserves months
- —
- Total cash needed
- —
Loan-product check · same deal, 3 products live
Conventional
25% down · 7.5% · 30yr
- Down + closing
- —
- Monthly P&I
- —
- Monthly cashflow
- —
- DSCR
- —
- Eligible?
- —
Personal DTI + credit; lowest rate.
DSCR
20% down · 8.5% · 30yr
- Down + closing
- —
- Monthly P&I
- —
- Monthly cashflow
- —
- DSCR
- —
- Eligible?
- —
No personal income docs; deal must DSCR.
Hard money
10% down · 12.0% · 12mo
- Down + closing
- —
- Monthly P&I
- —
- Monthly cashflow
- —
- DSCR
- —
- Eligible?
- —
Short-term bridge; refi at stabilization.
Rent comps 20 comps
| Address | Beds | Baths | Sqft | Rent | $/sqft | DOM | Units | Dist |
|---|---|---|---|---|---|---|---|---|
| 714 Connors Dr Greenwood, IN | 1.0–2.0 | 1.0 | 750 | $1,254 | $1.67 | 3d | 15 | 0.24mi |
| 501 E Main St Greenwood, IN | 2.0 | 1.0 | 968 | $1,395 | $1.44 | 45d | 1 | 0.30mi |
| 464 Carol Dr Greenwood, IN | 3.0 | 1.0 | 888 | $1,550 | $1.75 | 45d | 1 | 0.68mi |
| 610 Paradise Ct Greenwood, IN | 1.0–2.0 | 1.0–2.5 | 868 | $1,699 | $1.96 | 0d | 27 | 0.70mi |
| 370 Homestead Ave Greenwood, IN | 1.0–3.0 | 1.0–2.0 | 1135 | $2,275 | $2.00 | 0d | 29 | 0.75mi |
| 1201 Carson Way Greenwood, IN | 2.0 | 1.0–2.0 | 740 | $1,410 | $1.91 | 25d | 20 | 0.80mi |
| 700 Bexley Pl Greenwood, IN | 1.0–2.0 | 1.0–2.0 | 908 | $2,703 | $2.98 | 0d | 11 | 0.87mi |
| 514 Carol Dr Greenwood, IN | 3.0 | 1.0 | 864 | $1,483 | $1.72 | 0d | 1 | 0.88mi |
| 1180 Emerald Lks Greenwood, IN | 1.0–2.0 | 1.0–2.0 | 1056 | $1,830 | $1.73 | 0d | 16 | 0.97mi |
| 88 Keran Manor Ct Greenwood, IN | 2.0 | 1.0 | 945 | $1,450 | $1.53 | 45d | 1 | 1.07mi |
| 1043 Mikes Way Greenwood, IN | 3.0 | 2.0 | 1090 | $1,650 | $1.51 | 45d | 1 | 1.12mi |
| 614 Park Madison Dr Greenwood, IN | 2.0 | 2.0 | 1150 | $1,250 | $1.09 | 12d | 1 | 1.15mi |
| 49 Trails End Unit 1 Greenwood, IN | 2.0 | 1.5 | 1088 | $1,450 | $1.33 | 0d | 1 | 1.28mi |
| 902 Wallington Cir Greenwood, IN | 1.0–3.0 | 1.0–1.5 | 899 | $1,687 | $1.88 | 0d | 23 | 1.29mi |
| 764 Greenwood Springs Dr Greenwood, IN | 1.0–2.0 | 1.0–2.0 | 663 | $1,950 | $2.94 | 0d | 13 | 1.29mi |
| 968 Greenwood Trl W Greenwood, IN | 2.0 | 2.0 | 1088 | $1,475 | $1.36 | 14d | 1 | 1.32mi |
| 14 Greenwood Trl N Greenwood, IN | 2.0 | 1.5 | 1088 | $1,275 | $1.17 | 16d | 1 | 1.33mi |
| 4545 Scarlet Oak Way Indianapolis, IN | 1.0–3.0 | 1.0–2.0 | 1101 | $1,767 | $1.60 | 0d | 15 | 1.44mi |
| 1039 N Paz Dr Greenwood, IN | 1.0–3.0 | 1.0–2.0 | 925 | $1,434 | $1.55 | 0d | 9 | 1.48mi |
| 1285 Kenwood Dr Greenwood, IN | 3.0 | 2.5 | 1470 | $1,755 | $1.19 | 25d | 1 | 1.48mi |
Listing history 6 events
-
2026-06-10status $209,000 Pending 7 DOM
-
2026-06-09days on market $209,000 Active 7 DOM
-
2026-06-08days on market $209,000 Active 6 DOM
-
2026-06-07days on market $209,000 Active 5 DOM
-
2026-06-03remarks 681-char remark
-
2026-06-03$209,000 Active 1 DOM
ⓘ Source: listings_history table (triggers on properties + properties_extension) + one-shot
backfill from property_details.listing_events for pre-trigger history.
Tax reassessment forecast IN · Partial reset (capped growth)
- Current annual tax
- $1,018 · $85/mo
- Projected year-2 tax
- $1,397 · $116/mo
- Expected delta
- +$379/yr (+$32/mo · 37.3%)
ⓘ Screening estimate from a state-policy table — verify with the county assessor before closing.
Climate risk First Street
- Flood 1/10 Low FEMA zone X (unshaded) · 0% chance over 30 yrs
- Wildfire 1/10 Low
- Heat 3/10 Moderate 7 d/yr ≥100°F today · 19 d/yr by 30 yrs out
- Wind 2/10 Low 100% chance of damaging wind over 30 yrs
- Air quality 2/10 Low 2 unhealthy d/yr today · 2 by 30 yrs out
Nearby sold comps map
Loading sold comps map…
Walkable amenities ~0.75 mi
Loading nearby amenities…
Taxation est. · year 1
- Rental income
- $20,327
- − Mortgage interest
- −$11,707
- − Property taxes
- −$1,018
- − Insurance
- −$1,045
- − Repairs & maintenance
- −$1,626
- − Management
- −$1,626
- − Depreciation
- −$6,080
- Taxable loss
- −$2,776
- Est. tax savings @ 24.0%
- +$666
- After-tax cash flow
- $1,509/yr
For passive investors: Depreciation is non-cash, so a rental often shows a tax loss while cash-flowing — sheltering income. Rental losses are passive: they offset passive income freely, and up to $25,000/yr can offset ordinary (W-2) income if you actively participate and your MAGI is under $100k (phasing out to $0 by $150k); unused losses carry forward. On sale, claimed depreciation is recaptured at up to 25%, and gains may owe capital-gains tax (a 1031 exchange can defer both). Figures are a year-1 estimate at your 24.0% rate — not tax advice; consult a CPA.
Schools (NCES district)
- District
- Greenwood Community School Corporation
- NCES district ID
- 1804110
- Math proficiency
- 41% ▼ -12.00%
- Reading proficiency
- 52% ▼ -7.00%
- Median HH income
- $48,589
- Composite
- 39.71/100
- National rank
- #3902
- State rank
- #88 of 301 in IN
Livability — Greenwood
- Score
- 73/100
- State rank
- #91
- US rank
- #5255
Category grades
Schools grade is shown separately in the Schools card above.
Census & demographics
- Census place
- Greenwood, IN
- County
- Johnson County · 154,261 people
- City population
- 96,151
- Metro
- Indianapolis-Carmel-Anderson, IN
- Population (ZIP)
- 61,803
- Household income
- $91,496
- Rent vs Own
- Severe rent burden
- 1513.0
Population outlook (Johnson County) Hauer SSP2
- Today (2025)
- 170,080 people
- By 2030
- 179,983 · +5.8%
- By 2040
- 198,580 · +16.8%
- By 2050
- 214,661 · +26.2%
- By 2075
- 247,990 · +45.8%
- By 2100
- 257,821 · +51.6%
Race, ethnicity, and origin ACS 2023
- Neighborhood character
- Predominantly White (79%)
- Race & ethnicity
- White 79% Asian 8% Black 5% Two or more races 5% Hispanic / Latino 5%
- Common ancestry
- Slovak 3% Romanian 2% Lithuanian 1%
- Foreign-born
- 8% · Canada, Jamaica
- Languages at home
- 88% English-only · Other Indo-European 6% Spanish 3% Other Asian/Pacific 1%
Political lean MEDSL · Johnson
- 2024 margin
- Solid R (+34.3) · D 32.0% · R 66.3% · Other 1.7%
- 2008→2024 swing
- -8.9pp toward R · 2008: -25.5pp · 2024: -34.3pp
- All cycles
- 2024: R+34.3 2020: R+34.1 2016: R+42.5 2012: R+38.5 2008: R+25.5
Not yet ingested
- Civics
- —
Market trends
- HPI YoY
- ▼ -206.72%
- Current HPI
- 204.3161
- Rent YoY
- ▲ 1.95%
- Metro
- Indianapolis-Carmel-Anderson, IN
- State GDP YoY
- ▲ 2.90%
- F500 in state
- 18
Industry mix (Fortune 500 HQ in IN)
| Industry | F500 HQs | Revenue |
|---|---|---|
| Industrial Machinery | 2 | $37B |
|
||
| Healthcare | 1 | $177B |
|
||
| Pharmaceuticals | 1 | $45B |
|
||
| Metals / Steel | 1 | $18B |
|
||
| Agriculture | 1 | $17B |
|
||
| Packaging | 1 | $12B |
|
||
Price history
+110.1% since first listed5 events — show timeline
- 2026-06-02 Listed $209,000 MIBOR as Distributed by MLS Grid
- 2022-10-30 Listing Removed — MIBOR as Distributed by MLS Grid
- 2022-05-12 Listed $165,000 MIBOR as Distributed by MLS Grid
- 2006-09-15 Sold (MLS) $98,000 MIBOR as Distributed by MLS Grid
- 2006-05-17 Listed $99,500 MIBOR as Distributed by MLS Grid
Property tax history
+10.8%/yrLatest (2024): $1,018 · +32.6% YoY. Source: county tax records.
Cash-flow waterfall
monthlySold comps — $/sqft
last 12 mo · ≤1 miLoading sold comps…