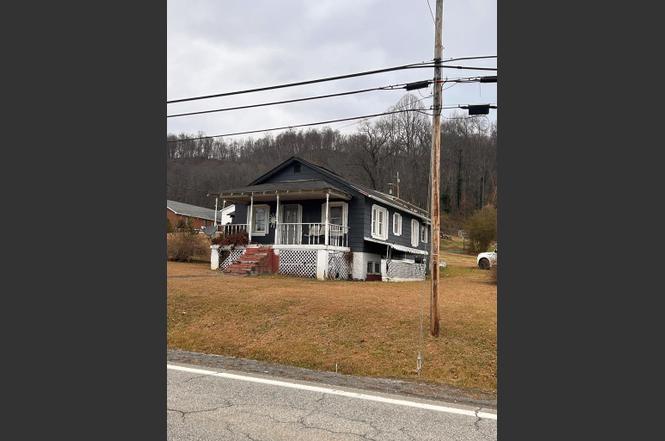
18585 Midland Trl · Ansted, WV
Flood risk 1/10 · Minimal
- FEMA flood zone
- X (unshaded)
- Chance of flooding over 30 yrs
- 0.0%
- Est. flood insurance / yr
- $473 – $860
Fire risk 5/10 · Moderate
- Est. fire insurance / yr
- $787 – $1,461
Heat risk 4/10 · Minor
- Hot days now (above 97°F)
- 8 days/yr
- Hot days in 30 yrs
- 23 days/yr
Wind risk 1/10 · Minimal
- Chance of severe wind over 30 yrs
- 0.0%
Air-quality risk 1/10 · Minimal
- Unhealthy air days now
- 0 days/yr
- Unhealthy air days in 30 yrs
- 0 days/yr
Risk factors via First Street. Map © Google.
Why this score? — see what drove the B grade
The composite is a weighted blend of 9 inputs, each scored 0–100. Each bar is that input's sub-score; the figure is the points it added to the 100-point composite (weight × sub-score).
- Cash flow +29.4/30.0
- DSCR +10.0/10.0
- 1% rule +7.5/10.0
- ARV discount +7.5/15.0
- Appreciation +7.1/10.0
- Livability +2.8/5.0
- Rent growth +2.5/5.0
- Condition / age +2.5/5.0
- Schools +2.0/10.0
$85,000
🖨 Deal sheet 📄 Offer letter ✓ Due diligence
Listing remarks
Prime location near WV's Top Outdoor Attractions! Unlock the protentional of this 3-bedroom, 1-bath property. Ideally situated in a prime location near West Virginia's most sough-after outdoor destinations. Boasting a spacious living room and a large dining or family room, this home offers ample space for relaxion and entertainment. Located within walking distance of Hawks Nest State Park and just 15 minutes from the New River Park and Preserve, adventure awaits at every turn. Enjoy easy access to rock climbing, bike and walking trails, rafting and breathtaking sightseeing opportunities in the beautiful mountains of WV. Nestled on nearly half an acre of flat land, this property presents end
Key facts
- 0.48 acre lot
- Built 1948
- Listed 168 days
Tags
Property features AI
Exterior
- Parking: Gravel parking; No garage; Open parking available
- Security: No specific security features listed
- Utilities: Public water; Public sewer
- Home design: Residential property; Vinyl siding; Shingle roof
- Construction: Vinyl siding construction
- Exterior features: Covered patio/porch; Level lot
Interior
- Kitchen: No specific kitchen appliance list provided
- Bedrooms: 3 main-level bedrooms
- Flooring: Carpet; Laminate
- Bathrooms: 1 full bathroom
- Heating & cooling: Electric heating; Central air conditioning
- Interior features: Electric water heater; Unfinished basement; Has view
- Laundry & utility: No specific laundry appliances listed
Neighborhood map
What this means for you Summary
Snapshot
- This is a 3-bed/1.0-bath single-family listed at $85k.
Deal economics
- At list price, monthly cash flow is $302 ($4k/yr) — positive.
- The deal already cash-flows at list — no discount required.
- Meets the 1% rule at list price ($1k rent vs $85k).
- Recommended offer: $75k (12.0% below list) — sets the bar for market timing.
Location & tenants
- Location reads 56/100 on livability (#270 in WV) — a working-class tenant base; expect higher turnover. Strengths: crime A+, cost of living A+, health & safety A-; Watch: amenities F, commute F, employment F.
- Fayette County Schools (suburban): math 17% / reading 31% proficiency, ranked #51 of 55 in WV (top 93%) — low school quality limits family demand, transient renter base, plan for 1-2y turnover.
- Zoned schools: Ansted Elementary (math 32% / reading 37%, grade F, #148 of 377 statewide, top 49%, 190 students, 0% FRL); Midland Trail High (math 15% / reading 38%, grade F, #87 of 110 statewide, top 79%, 623 students, 0% FRL) — zoned schools average 0% FRL vs 54% district-wide (54 pts lower); this property's tenant base skews higher-income than the district average.
- Market conditions: 3 active listings in the ZIP; 26 units permitted in Fayette County in 2024 (0 in 5+ unit buildings).
Forward outlook
- In year one you build about $4k of equity ($588 loan paydown + $3k appreciation (4.1% local appreciation)).
- Fayette County population projected at -23% by 2050 — secular population decline; favor cash flow + early exit over multi-decade hold.
- At projected returns (4.1% appreciation + 3.0% rent growth), your $24k cash investment doubles in ~3 years — after that, you're playing with house money.
- By year 8, paydown + projected appreciation supports a ~$30k cash-out refi (75% LTV) — recoverable capital for the next deal without selling this one.
Negotiation context
- It's been on market 169 days — a 12% lower offer ($75k) is reasonable based on typical stale-listing flexibility.
- 3 sale attempts since 3y ago with the ask held roughly flat each time — persistent listings suggest the price (not the market) is what's stuck; bring a comps-based counter.
- Current owner paid $46k; list at $85k implies a 87% gain — meaningful room to come down on a strong offer.
Risks & watch-outs
- Watch-outs: built in 1948 — expect roof / HVAC / electrical / plumbing capex.
- Climate carrying-cost: moderate wildfire risk — expect insurance premiums to compound above CPI over the hold.
Questions for the listing agent
- It's been on market 169 days. Have you received any prior offers? Is the seller open to a 12% concession, seller financing, or rate buy-down credit?
- Built in 1948 — when were the roof, HVAC, electrical panel, plumbing, and water heater last replaced?
- Why hasn't it sold? Are there any deal-killer items the seller is aware of (foundation, flood, title, zoning, code violations)?
- Is there a deadline driving the sale (1031 exchange, divorce, estate, relocation)? That informs how much negotiation room exists.
- Schools are F-rated, which usually means shorter tenancies and higher turnover. Who's the typical renter profile here, and what's been the actual vacancy rate?
- What's the average days-on-market for RENTAL listings here right now (not sales)? A rising rental-DOM trend means longer vacancies and softer asking-rent achievability than the comps imply.
- What's the recent tenant-quality profile in this submarket — average credit score on applications, eviction rate, late-payment / NSF rate, and stable-employment percentage? A property-management company in the area should have these aggregated.
- How much new for-sale + rental construction is in the pipeline within 1–3 miles? Heavy new supply typically softens prices + rents 12–24 months out; constrained supply supports both.
Investment metrics
- 1% rule
- 1.25% ✓
- Cap rate
- 10.55%
- Cash-on-cash
- 15.20%
- DSCR
- 1.68
- GRM
- 6.7
CMA / ARV
No comps found within radius.
Projected returns pro-forma
4.11% appreciation · 3.0% rent growth · sell at horizon
- IRR
- 24.2%
- Equity multiple
- 2.45×
- Total profit
- $34,549
- Equity at exit
- $43,666
- IRR
- 24.1%
- Equity multiple
- 4.78×
- Total profit
- $90,038
- Equity at exit
- $71,877
Cash invested: $23,800 (down + closing). Projections, not guarantees.
Landlord ↔ Tenant lean methodology
- Overall (STATE)
- 83 Strongly Landlord-Friendly
- State West Virginia
- 83 Strongly Landlord-Friendly · R+22
- County
- — inherits STATE
- City
- — inherits STATE
ZIP-level market 25812
- Home prices YoY
- 2.6%
- Active inventory
- 3
- Price-to-rent
- 6.7×
Monthly cashflow live
- Estimated rent
- $1,058 medium interval (Pro) →
- Mortgage (P&I)
- −$446
- Tax from tax record
- −$53 /mo · $642/yr
- Insurance
- −$35
- HOA
- −$0
- Vacancy / Maint / Mgmt
- −$222
- Net cashflow
- $302
Break-even live
UW: 25.0% down · 7.5% · 30yr · 1.5% tax · 5.0% vac · 8.0% maint · 8.0% mgmt
Financing live
Cash to close
- Down payment
- $21,250
- Closing costs
- $2,550
- Reserves months
- —
- Total cash needed
- —
Loan-product check · same deal, 3 products live
Conventional
25% down · 7.5% · 30yr
- Down + closing
- —
- Monthly P&I
- —
- Monthly cashflow
- —
- DSCR
- —
- Eligible?
- —
Personal DTI + credit; lowest rate.
DSCR
20% down · 8.5% · 30yr
- Down + closing
- —
- Monthly P&I
- —
- Monthly cashflow
- —
- DSCR
- —
- Eligible?
- —
No personal income docs; deal must DSCR.
Hard money
10% down · 12.0% · 12mo
- Down + closing
- —
- Monthly P&I
- —
- Monthly cashflow
- —
- DSCR
- —
- Eligible?
- —
Short-term bridge; refi at stabilization.
Listing history 20 events
-
2026-06-19days on market $85,000 Active 169 DOM
-
2026-06-18days on market $85,000 Active 168 DOM
-
2026-06-17days on market $85,000 Active 167 DOM
-
2026-06-16days on market $85,000 Active 166 DOM
-
2026-06-15days on market $85,000 Active 165 DOM
-
2026-06-14days on market $85,000 Active 163 DOM
-
2026-06-12days on market $85,000 Active 162 DOM
-
2026-06-09days on market $85,000 Active 159 DOM
-
2026-06-08days on market $85,000 Active 158 DOM
-
2026-06-07days on market $85,000 Active 157 DOM
-
2026-06-05days on market $85,000 Active 154 DOM
-
2026-06-03days on market $85,000 Active 153 DOM
-
2026-06-02days on market $85,000 Active 152 DOM
-
2026-06-01days on market $85,000 Active 151 DOM
-
2026-05-31days on market $85,000 Active 150 DOM
-
2026-05-30days on market $85,000 Active 149 DOM
-
2026-01-01$85,000 Active
-
2024-08-08$77,000 Active
-
2023-12-14$79,900 Active
-
1996-12-18soldstatus $45,500
ⓘ Source: listings_history table (triggers on properties + properties_extension) + one-shot
backfill from property_details.listing_events for pre-trigger history.
Tax reassessment forecast WV · Resets to sale price
- Current annual tax
- $642 · $53/mo
- Projected year-2 tax
- $642 · $53/mo
- Expected delta
- $0/yr ($0/mo · 0.0%)
ⓘ Screening estimate from a state-policy table — verify with the county assessor before closing.
Climate risk First Street
- Flood 1/10 Low FEMA zone X (unshaded) · 0% chance over 30 yrs
- Wildfire 5/10 Major
- Heat 4/10 Moderate 8 d/yr ≥97°F today · 23 d/yr by 30 yrs out
- Wind 1/10 Low 0% chance of damaging wind over 30 yrs
- Air quality 1/10 Low 0 unhealthy d/yr today · 0 by 30 yrs out
Nearby sold comps map
Loading sold comps map…
Walkable amenities ~0.75 mi
Loading nearby amenities…
Taxation est. · year 1
- Rental income
- $12,702
- − Mortgage interest
- −$4,761
- − Property taxes
- −$642
- − Insurance
- −$425
- − Repairs & maintenance
- −$1,016
- − Management
- −$1,016
- − Depreciation
- −$2,473
- Taxable income
- $2,369
- Est. tax owed @ 24.0%
- −$569
- After-tax cash flow
- $3,050/yr
For passive investors: Depreciation is non-cash, so a rental often shows a tax loss while cash-flowing — sheltering income. Rental losses are passive: they offset passive income freely, and up to $25,000/yr can offset ordinary (W-2) income if you actively participate and your MAGI is under $100k (phasing out to $0 by $150k); unused losses carry forward. On sale, claimed depreciation is recaptured at up to 25%, and gains may owe capital-gains tax (a 1031 exchange can defer both). Figures are a year-1 estimate at your 24.0% rate — not tax advice; consult a CPA.
Schools (NCES district)
- District
- Fayette County Schools
- NCES district ID
- 5400300
- Math proficiency
- 17% ▼ -12.00%
- Reading proficiency
- 31% ▼ -4.00%
- Median HH income
- $35,293
- Composite
- 19.77/100
- National rank
- #8706
- State rank
- #51 of 55 in WV
Livability — Ansted
- Score
- 56/100
- State rank
- #270
- US rank
- #22730
Category grades
Schools grade is shown separately in the Schools card above.
Census & demographics
- Census place
- Ansted, WV
- Population (ZIP)
- 1,317
Population outlook (Fayette County) Hauer SSP2
- Today (2025)
- 41,745 people
- By 2030
- 39,758 · -4.8%
- By 2040
- 35,751 · -14.4%
- By 2050
- 32,223 · -22.8%
- By 2075
- 24,307 · -41.8%
- By 2100
- 16,671 · -60.1%
Race, ethnicity, and origin ACS 2023
- Neighborhood character
- Predominantly White (98%)
- Race & ethnicity
- White 98% Hispanic / Latino 1% Two or more races 1%
- Common ancestry
- Serbian 5% Iranian 4% Lithuanian 3%
Political lean MEDSL · Fayette
- 2024 margin
- Solid R (+41.8) · D 28.1% · R 69.8% · Other 2.1%
- 2008→2024 swing
- -39.0pp toward R · 2008: -2.7pp · 2024: -41.8pp
- All cycles
- 2024: R+41.8 2020: R+38.6 2016: R+39.6 2012: R+21.0 2008: R+2.7
Not yet ingested
- Civics
- —
Market trends
- HPI YoY
- ▲ 4.11%
- Current HPI
- 164.3241
- Rent YoY
- —
- Metro
- —
- State GDP YoY
- —
- F500 in state
- 0
Price history
+86.8% since first listed4 events — show timeline
- 2026-01-01 Listed $85,000 BBOR
- 2024-08-08 Listed $77,000 KVBOR
- 2023-12-14 Listed $79,900 KVBOR
- 1996-12-18 Sold (Public Records) $45,500 Public Records
Property tax history
-4.5%/yrLatest (2025): $642 · +0.2% YoY. Source: county tax records.
Cash-flow waterfall
monthlySold comps — $/sqft
last 12 mo · ≤1 miLoading sold comps…