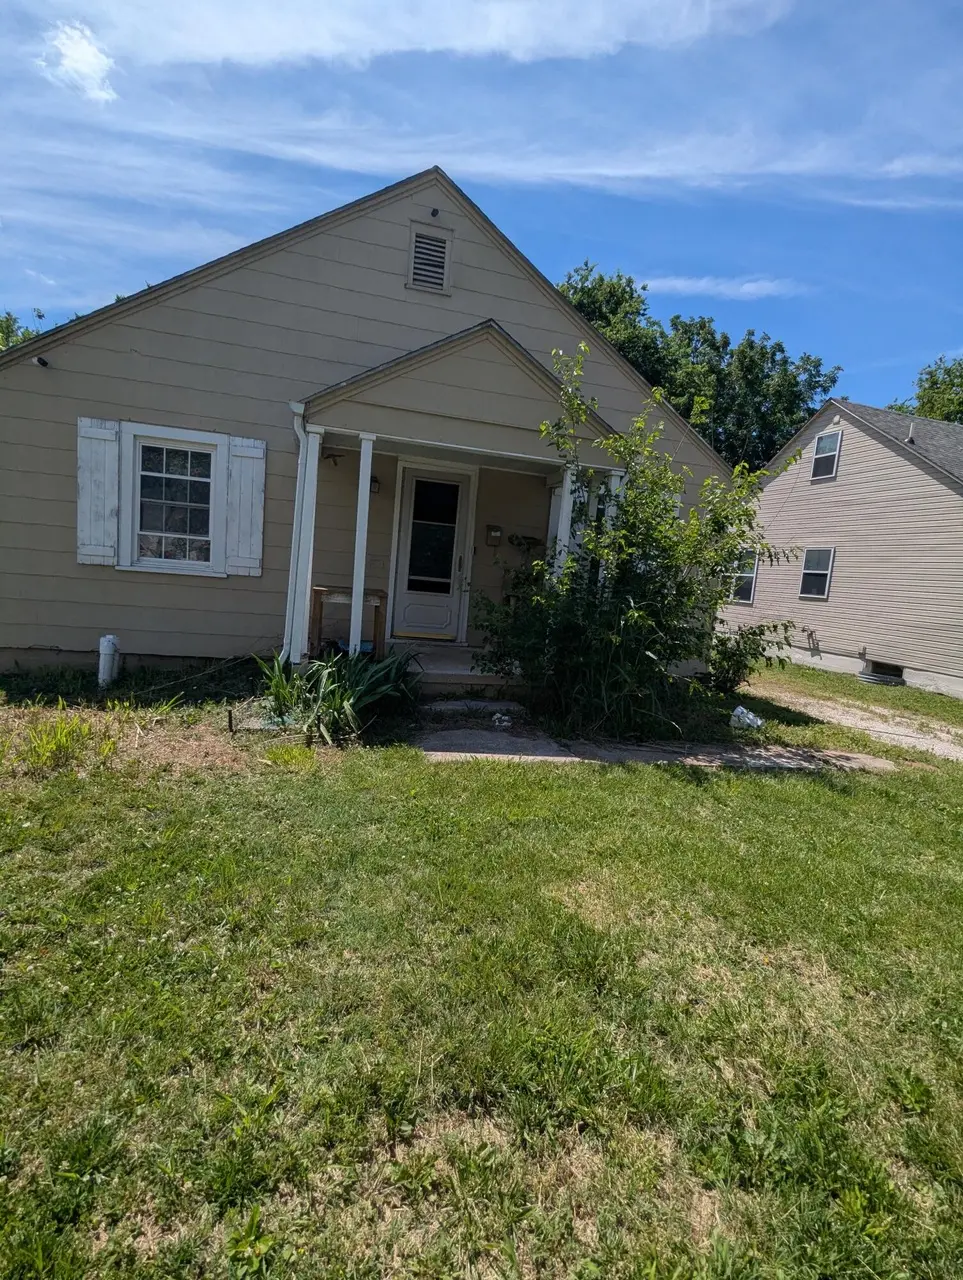
421 S West Ave · Springfield, MO
Flood risk 1/10 · Minimal
- FEMA flood zone
- X (unshaded)
- Chance of flooding over 30 yrs
- 0.0%
- Est. flood insurance / yr
- $473 – $860
Fire risk 1/10 · Minimal
- Est. fire insurance / yr
- $1,054 – $1,958
Heat risk 5/10 · Moderate
- Hot days now (above 104°F)
- 7 days/yr
- Hot days in 30 yrs
- 20 days/yr
Wind risk 2/10 · Minimal
- Chance of severe wind over 30 yrs
- —
Air-quality risk 2/10 · Minimal
- Unhealthy air days now
- 1 days/yr
- Unhealthy air days in 30 yrs
- 2 days/yr
Risk factors via First Street. Map © Google.
Why this score? — see what drove the B grade
The composite is a weighted blend of 9 inputs, each scored 0–100. Each bar is that input's sub-score; the figure is the points it added to the 100-point composite (weight × sub-score).
- Cash flow +30.0/30.0
- 1% rule +10.0/10.0
- DSCR +10.0/10.0
- ARV discount +7.5/15.0
- Livability +3.8/5.0
- Rent growth +3.5/5.0
- Schools +3.2/10.0
- Condition / age +2.5/5.0
- Appreciation +0.0/10.0
$50,000
🖨 Deal sheet 📄 Offer letter ✓ Due diligence
Listing remarks MLS
FOUR BEDS, TWO FULL BATHS under 100k! Upgrades include roof, flooring, kitchen cabinets, light fixtures, laminate floors and a wood privacy fence. The basement has been finished into 2 bedrooms and 1 full bath. The house also has a security system installed.
Key facts
- 7,405 sq ft lot
- Built 1941
- Listed 21 days
Property features AI
Exterior
- Parking: Private driveway
- Utilities: Public water; Public sewer
- Home design: Single-family residence; Two levels
- Construction: Lap siding construction
- Exterior features: Composition roof; Lap siding; Has a view; Asphalt road frontage on a public-maintained city street; Lot approximately 0.17 acres
Interior
- Flooring: Carpet; Tile
- Bathrooms: 2 full bathrooms
- Heating & cooling: Central heating (natural gas); Central air; Ceiling fans
- Interior features: Insulated double-pane windows; Storm door(s)
- Laundry & utility: Laundry in basement; Basement is full, partially finished with concrete floor
Neighborhood map
What this means for you Summary
Snapshot
- This is a 4-bed/2.0-bath single-family listed at $50k.
Deal economics
- At list price, monthly cash flow is $662 ($8k/yr) — positive.
- The deal already cash-flows at list — no discount required.
- Meets the 1% rule at list price ($1k rent vs $50k).
- Recommended offer: $49k (1.5% below list) — sets the bar for market timing.
- Cap rate 22.2% vs local median 4.6% in Springfield — top-decile yield for the area; either an underpriced asset or a hidden risk that comps aren't pricing in. Stress-test before assuming the spread holds.
Location & tenants
- Location reads 75/100 on livability (#57 in MO, #4,121 nationally) — a middle-class / working-renter tenant base. Strengths: commute A+, cost of living A+, housing A+; Watch: crime F, employment F.
- Springfield R-XII (urban): math 32% / reading 46% proficiency, ranked #174 of 324 in MO (top 54%) — families likely to look elsewhere, expect single-tenant / working-renter base with shorter leases.
- Zoned schools: Westport Elem. (math 8% / reading 17%, grade F, #1,007 of 1,115 statewide, top 91%, 384 students, 88% FRL); Central High (math 42% / reading 62%, grade D+, #92 of 521 statewide, top 20%, 1,464 students, 51% FRL) — zoned schools average 69% FRL vs 46% district-wide (23 pts higher); higher-poverty schools than district average — tighter screening recommended.
- Market conditions: Rents rising fast (+4.2%/yr); 86 active listings in the ZIP; 13 comparable units currently listed for rent nearby; rentals at typical pace (median 21d on market — plan ~3-4 weeks tenant-placement turnaround); lower-income renter base — watch delinquency; 1,302 units permitted in Greene County in 2024 (250 in 5+ unit buildings).
- At $1,308/mo this rent would consume 56% of the median local household income ($28k/yr) (locally 1966% of renters already pay >50% of income on rent) — very limited rent-growth headroom before tenants either downsize or default.
Forward outlook
- Local home prices are declining (-3.0%/yr); year-one equity from $346 of loan paydown is wiped out by about $2k of value loss. Plan a longer hold.
- Greene County population projected at +25% by 2050 — long-run rental-demand tailwind backs the buy-and-hold thesis.
- At projected returns (-3.0% appreciation + 4.2% rent growth), your $14k cash investment doubles in ~2 years — after that, you're playing with house money.
Negotiation context
- It's been on market 21 days — a 2% lower offer ($49k) is reasonable based on typical stale-listing flexibility.
- 5 sale attempts since 9y ago with the ask held roughly flat each time — persistent listings suggest the price (not the market) is what's stuck; bring a comps-based counter.
Risks & watch-outs
- Watch-outs: built in 1941 — expect roof / HVAC / electrical / plumbing capex.
- Climate carrying-cost: extreme-heat days projected 7→20/yr by 2055 (HVAC capex compounding) — expect insurance premiums to compound above CPI over the hold.
Questions for the listing agent
- Built in 1941 — when were the roof, HVAC, electrical panel, plumbing, and water heater last replaced?
- Is there a deadline driving the sale (1031 exchange, divorce, estate, relocation)? That informs how much negotiation room exists.
- Crime grade is F in this area — have there been break-ins, vandalism, or insurance claims at this property in the last 3 years? What carrier currently insures it and at what premium?
- What's the average days-on-market for RENTAL listings here right now (not sales)? A rising rental-DOM trend means longer vacancies and softer asking-rent achievability than the comps imply.
- What's the recent tenant-quality profile in this submarket — average credit score on applications, eviction rate, late-payment / NSF rate, and stable-employment percentage? A property-management company in the area should have these aggregated.
- How much new for-sale + rental construction is in the pipeline within 1–3 miles? Heavy new supply typically softens prices + rents 12–24 months out; constrained supply supports both.
Investment metrics
- 1% rule
- 2.62% ✓
- Cap rate
- 22.19%
- Cash-on-cash
- 56.76%
- DSCR
- 3.53
- GRM
- 3.2
CMA / ARV
- ARV (on-the-fly)
- $159,645
- Comps found
- 12
Show comp detail 12 sales within ~0.75 mi
| Address | Dist | Beds/Ba | Sqft | Sold | Price | $/sf | Match |
|---|---|---|---|---|---|---|---|
| 300 S Clifton Ave | 0.13mi | 3/1.0 (-1) | 1,080 (-2%) | 8mo | $143,999 | $133 | 75 |
| 427 N Park Ave | 0.46mi | 3/1.0 (-1) | 1,102 (+0%) | 6mo | $210,000 | $191 | 64 |
| 418 N West Ave | 0.39mi | 3/1.0 (-1) | 1,056 (-4%) | 8mo | $155,000 | $147 | 60 |
| 2919 W Page St | 0.73mi | 3/2.0 (-1) | 1,096 (-0%) | 2mo | $176,500 | $161 | 59 |
| 2634 W Phelps St | 0.48mi | 3/1.0 (-1) | 1,038 (-6%) | 3mo | $135,000 | $130 | 56 |
| 2134 W Olive St | 0.34mi | 3/1.0 (-1) | 992 (-10%) | 6mo | $139,900 | $141 | 53 |
| 2940 W Walnut St | 0.58mi | 3/2.0 (-1) | 1,008 (-8%) | 3mo | $135,000 | $134 | 51 |
| 3036 W Water St | 0.73mi | 3/1.5 (-1) | 1,040 (-6%) | 1mo | $135,000 | $130 | 49 |
| 2756 W Lincoln St | 0.38mi | 3/2.0 (-1) | 1,250 (+14%) | 9mo | $219,000 | $175 | 48 |
| 735 N Brown Ave | 0.66mi | 3/2.0 (-1) | 1,209 (+10%) | 1mo | $115,000 | $95 | 47 |
| 3035 W College St | 0.69mi | 3/2.0 (-1) | 1,205 (+9%) | 4mo | $179,999 | $149 | 43 |
| 2200 W Phelps St | 0.48mi | 3/1.0 (-1) | 936 (-15%) | 0mo | $135,900 | $145 | 43 |
Match score weights: distance 35% · size 25% · config 20% · recency 20%. Top-matched comps best support the ARV.
Projected returns pro-forma
-3.0% appreciation · 4.17% rent growth · sell at horizon
- IRR
- 56.6%
- Equity multiple
- 3.55×
- Total profit
- $35,664
- Equity at exit
- $7,455
- IRR
- 62.0%
- Equity multiple
- 7.57×
- Total profit
- $92,050
- Equity at exit
- $4,323
Cash invested: $14,000 (down + closing). Projections, not guarantees.
Landlord ↔ Tenant lean methodology
- Overall (STATE)
- 81 Strongly Landlord-Friendly
- State Missouri
- 81 Strongly Landlord-Friendly · R+10
- County
- — inherits STATE
- City
- — inherits STATE
ZIP-level market 65806
- Home prices YoY
- -11.7%
- Rents YoY
- 4.2%
- Active inventory
- 86
- Price-to-rent
- 3.2×
Monthly cashflow live
- Estimated rent
- $1,308 high interval (Pro) →
- Mortgage (P&I)
- −$262
- Tax from tax record
- −$88 /mo · $1,055/yr
- Insurance
- −$21
- HOA
- −$0
- Vacancy / Maint / Mgmt
- −$275
- Net cashflow
- $662
Break-even live
UW: 25.0% down · 7.5% · 30yr · 1.5% tax · 5.0% vac · 8.0% maint · 8.0% mgmt
Financing live
Cash to close
- Down payment
- $12,500
- Closing costs
- $1,500
- Reserves months
- —
- Total cash needed
- —
Loan-product check · same deal, 3 products live
Conventional
25% down · 7.5% · 30yr
- Down + closing
- —
- Monthly P&I
- —
- Monthly cashflow
- —
- DSCR
- —
- Eligible?
- —
Personal DTI + credit; lowest rate.
DSCR
20% down · 8.5% · 30yr
- Down + closing
- —
- Monthly P&I
- —
- Monthly cashflow
- —
- DSCR
- —
- Eligible?
- —
No personal income docs; deal must DSCR.
Hard money
10% down · 12.0% · 12mo
- Down + closing
- —
- Monthly P&I
- —
- Monthly cashflow
- —
- DSCR
- —
- Eligible?
- —
Short-term bridge; refi at stabilization.
Rent comps 13 comps
| Address | Beds | Baths | Sqft | Rent | $/sqft | DOM | Units | Dist |
|---|---|---|---|---|---|---|---|---|
| 2412 W Lincoln St Springfield, MO | 3.0 | 1.0 | 1260 | $1,295 | $1.03 | 23d | 1 | 0.11mi |
| 2204 W Madison St Springfield, MO | 3.0 | 1.0 | 960 | $1,095 | $1.14 | 13d | 1 | 0.50mi |
| 2854 W Walnut St Springfield, MO | 3.0 | 1.0 | 945 | $995 | $1.05 | 21d | 1 | 0.50mi |
| 1740 W Olive St Springfield, MO | 3.0 | 1.0 | 736 | $1,195 | $1.62 | 13d | 1 | 0.61mi |
| 3002 W Elm St Springfield, MO | 3.0 | 2.0 | 1128 | $1,295 | $1.15 | 21d | 1 | 0.64mi |
| 740 N West Ave Springfield, MO | 3.0 | 1.0 | 900 | $995 | $1.11 | 23d | 1 | 0.68mi |
| 547 S Hilton Ave Springfield, MO | 3.0 | 1.0 | 1008 | $1,175 | $1.17 | 43d | 1 | 0.95mi |
| 1152 S Hillcrest Ave Springfield, MO | 3.0 | 1.5 | 1240 | $1,300 | $1.05 | 43d | 1 | 1.09mi |
| 1500 W Grand St Springfield, MO | 2.0–3.0 | 1.0–1.5 | 1365 | $1,395 | $1.02 | 13d | 3 | 1.10mi |
| 1365 S Scenic Ave Springfield, MO | 3.0 | 2.0 | 1328 | $1,550 | $1.17 | 13d | 1 | 1.15mi |
| 930 W Harrison St Springfield, MO | 3.0 | 2.0 | 1046 | $1,150 | $1.10 | 13d | 1 | 1.30mi |
| 3016 W Hovey St Springfield, MO | 3.0 | 2.0 | 1059 | $1,350 | $1.27 | 43d | 1 | 1.37mi |
| 710 W Walnut St Springfield, MO | 3.0 | 2.0 | 1350 | $1,695 | $1.26 | 43d | 1 | 1.48mi |
Listing history 25 events
-
2026-06-18days on market $50,000 Active 21 DOM
-
2026-06-17days on market $50,000 Active 20 DOM
-
2026-06-16days on market $50,000 Active 19 DOM
-
2026-06-15days on market $50,000 Active 18 DOM
-
2026-06-14days on market $50,000 Active 16 DOM
-
2026-06-10days on market $50,000 Active 13 DOM
-
2026-06-09days on market $50,000 Active 12 DOM
-
2026-06-08days on market $50,000 Active 11 DOM
-
2026-06-07days on market $50,000 Active 10 DOM
-
2026-06-03days on market $50,000 Active 6 DOM
-
2026-06-02days on market $50,000 Active 5 DOM
-
2026-06-01days on market $50,000 Active 4 DOM
-
2026-05-31days on market $50,000 Active 3 DOM
-
2026-05-30days on market $50,000 Active 2 DOM
-
2026-05-28$50,000 Active
-
2020-03-11soldstatus 258-char remark
Show marketing remark (258 chars)
FOUR BEDS, TWO FULL BATHS under 100k! Upgrades include roof, flooring, kitchen cabinets, light fixtures, laminate floors and a wood privacy fence. The basement has been finished into 2 bedrooms and 1 full bath. The house also has a security system installed.
-
2020-03-11soldstatus
Show marketing remark (258 chars)
FOUR BEDS, TWO FULL BATHS under 100k! Upgrades include roof, flooring, kitchen cabinets, light fixtures, laminate floors and a wood privacy fence. The basement has been finished into 2 bedrooms and 1 full bath. The house also has a security system installed.
-
2020-02-06$97,250 258-char remark
Show marketing remark (258 chars)
FOUR BEDS, TWO FULL BATHS under 100k! Upgrades include roof, flooring, kitchen cabinets, light fixtures, laminate floors and a wood privacy fence. The basement has been finished into 2 bedrooms and 1 full bath. The house also has a security system installed.
-
2019-05-31soldstatus
-
2019-05-30soldstatus 390-char remark
Show marketing remark (390 chars)
Come see this COMPLETELY REMODELED HOME! Updates include a NEW ROOF, new flooring, completely new kitchen, newer windows, plumbing, brand new wood privacy fence with a large back yard, light fixtures, paint, interior doors, and more! Most of the basement has been finished to include 2 large bedrooms and a full bathroom! The home is also equipped with a security system. Come see it today!
-
2019-03-28$95,000 390-char remark
Show marketing remark (390 chars)
Come see this COMPLETELY REMODELED HOME! Updates include a NEW ROOF, new flooring, completely new kitchen, newer windows, plumbing, brand new wood privacy fence with a large back yard, light fixtures, paint, interior doors, and more! Most of the basement has been finished to include 2 large bedrooms and a full bathroom! The home is also equipped with a security system. Come see it today!
-
2018-11-30soldstatus
-
2018-11-29soldstatus
-
2018-06-21$49,000
-
2017-07-05$59,500
ⓘ Source: listings_history table (triggers on properties + properties_extension) + one-shot
backfill from property_details.listing_events for pre-trigger history.
Tax reassessment forecast MO · Resets to sale price
- Current annual tax
- $1,055 · $88/mo
- Projected year-2 tax
- $1,055 · $88/mo
- Expected delta
- $0/yr ($0/mo · 0.0%)
ⓘ Screening estimate from a state-policy table — verify with the county assessor before closing.
Climate risk First Street
- Flood 1/10 Low FEMA zone X (unshaded) · 0% chance over 30 yrs
- Wildfire 1/10 Low
- Heat 5/10 Major 7 d/yr ≥104°F today · 20 d/yr by 30 yrs out
- Wind 2/10 Low
- Air quality 2/10 Low 1 unhealthy d/yr today · 2 by 30 yrs out
Nearby sold comps map
Loading sold comps map…
Walkable amenities ~0.75 mi
Loading nearby amenities…
Taxation est. · year 1
- Rental income
- $15,693
- − Mortgage interest
- −$2,801
- − Property taxes
- −$1,055
- − Insurance
- −$250
- − Repairs & maintenance
- −$1,255
- − Management
- −$1,255
- − Depreciation
- −$1,455
- Taxable income
- $7,622
- Est. tax owed @ 24.0%
- −$1,829
- After-tax cash flow
- $6,117/yr
For passive investors: Depreciation is non-cash, so a rental often shows a tax loss while cash-flowing — sheltering income. Rental losses are passive: they offset passive income freely, and up to $25,000/yr can offset ordinary (W-2) income if you actively participate and your MAGI is under $100k (phasing out to $0 by $150k); unused losses carry forward. On sale, claimed depreciation is recaptured at up to 25%, and gains may owe capital-gains tax (a 1031 exchange can defer both). Figures are a year-1 estimate at your 24.0% rate — not tax advice; consult a CPA.
Schools (NCES district)
- District
- Springfield R-XII
- NCES district ID
- 2928860
- Math proficiency
- 32% ▼ -2.00%
- Reading proficiency
- 46% ▼ -3.00%
- Median HH income
- $37,886
- Composite
- 32.45/100
- National rank
- #5717
- State rank
- #174 of 324 in MO
Livability — Springfield
- Score
- 75/100
- State rank
- #57
- US rank
- #4121
Category grades
Schools grade is shown separately in the Schools card above.
Census & demographics
- Census place
- Springfield, MO
- County
- Greene County · 244,327 people
- City population
- 223,044
- Metro
- Springfield, MO
- Population (ZIP)
- 13,692
- Household income
- $28,165
- Rent vs Own
- Severe rent burden
- 1966.0
Population outlook (Greene County) Hauer SSP2
- Today (2025)
- 319,054 people
- By 2030
- 335,135 · +5.0%
- By 2040
- 366,186 · +14.8%
- By 2050
- 397,431 · +24.6%
- By 2075
- 477,035 · +49.5%
- By 2100
- 520,828 · +63.2%
Race, ethnicity, and origin ACS 2023
- Neighborhood character
- Predominantly White (75%)
- Race & ethnicity
- White 75% Two or more races 8% Hispanic / Latino 7% Black 6% Asian 3%
- Hispanic origin (detail)
- Mexican 4%
- Common ancestry
- Slovak 2% Italian 1% Scotch-Irish 1%
- Foreign-born
- 7% · Canada, China, Vietnam
- Languages at home
- 91% English-only · Spanish 4% Other Indo-European 2% Other Asian/Pacific 1%
Political lean MEDSL · Greene
- 2024 margin
- Strong R (+20.8) · D 38.9% · R 59.7% · Other 1.4%
- 2008→2024 swing
- -5.0pp toward R · 2008: -15.8pp · 2024: -20.8pp
- All cycles
- 2024: R+20.8 2020: R+20.1 2016: R+27.4 2012: R+24.4 2008: R+15.8
Not yet ingested
- Civics
- —
Market trends
- HPI YoY
- ▼ -27.72%
- Current HPI
- 208.8156
- Rent YoY
- ▲ 4.17%
- Metro
- Springfield, MO
- State GDP YoY
- ▲ 1.84%
- F500 in state
- 20
Industry mix (Fortune 500 HQ in MO)
| Industry | F500 HQs | Revenue |
|---|---|---|
| Healthcare | 1 | $163B |
|
||
| Insurance | 1 | $21B |
|
||
| Industrial Technology | 1 | $17B |
|
||
| Retail | 1 | $16B |
|
||
| Industrial Distribution | 1 | $10B |
|
||
| Utilities | 1 | $9B |
|
||
Price history
-16.0% since first listed11 events — show timeline
- 2026-05-28 Listed $50,000 SOMO
- 2020-03-11 Sold (Public Records) — Public Records
- 2020-03-11 Sold (MLS) — SOMO
- 2020-02-06 Listed $97,250 SOMO
- 2019-05-31 Sold (Public Records) — Public Records
- 2019-05-30 Sold (MLS) — SOMO
- 2019-03-28 Listed $95,000 SOMO
- 2018-11-30 Sold (Public Records) — Public Records
- 2018-11-29 Sold (MLS) — SOMO
- 2018-06-21 Listed $49,000 SOMO
- 2017-07-05 Listed $59,500 SOMO
Property tax history
+7.6%/yrLatest (2025): $1,055 · +13.0% YoY. Source: county tax records.
Cash-flow waterfall
monthlySold comps — $/sqft
last 12 mo · ≤1 miLoading sold comps…