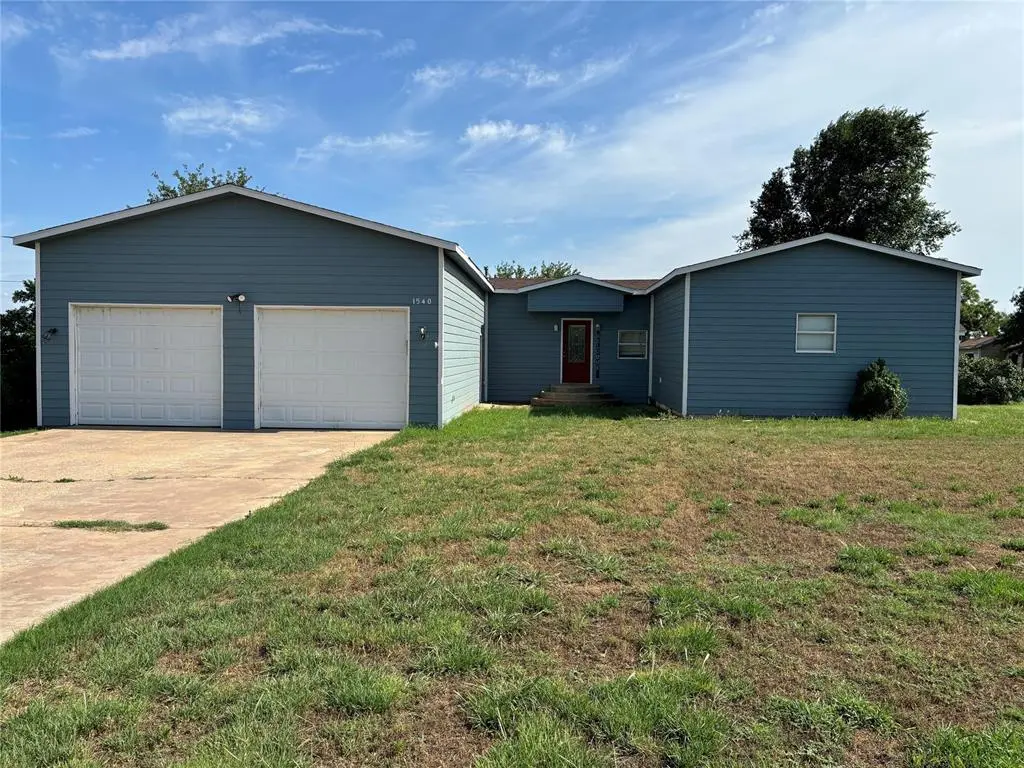
1540 Cross Rd · Altus, OK
Flood risk 1/10 · Minimal
- FEMA flood zone
- X (shaded)
- Chance of flooding over 30 yrs
- 0.0%
- Est. flood insurance / yr
- $507 – $1,088
Fire risk 1/10 · Minimal
- Est. fire insurance / yr
- $2,463 – $4,575
Heat risk 6/10 · Moderate
- Hot days now (above 108°F)
- 7 days/yr
- Hot days in 30 yrs
- 19 days/yr
Wind risk 3/10 · Minor
- Chance of severe wind over 30 yrs
- 5.0%
Air-quality risk 1/10 · Minimal
- Unhealthy air days now
- 0 days/yr
- Unhealthy air days in 30 yrs
- 0 days/yr
Risk factors via First Street. Map © Google.
Why this score? — see what drove the C- grade
The composite is a weighted blend of 9 inputs, each scored 0–100. Each bar is that input's sub-score; the figure is the points it added to the 100-point composite (weight × sub-score).
- Cash flow +21.5/30.0
- ARV discount +7.5/15.0
- DSCR +6.9/10.0
- 1% rule +4.6/10.0
- Livability +3.2/5.0
- Rent growth +2.5/5.0
- Schools +2.5/10.0
- Condition / age +2.5/5.0
- Appreciation +0.0/10.0
$130,000
🖨 Deal sheet 📄 Offer letter ✓ Due diligence
Listing remarks
Need some extra space? Come see this home! With 3 legal bedrooms and a BONUS room, this home is well situated for work-from-home situations! No backyard neighbors, but exceptional back porch views provide privacy with the added convenience of being in town! You’ll find an oversized two car garage and room for an additional shop to be built around the back - the hobbyist wood worker, mechanic, or gardener would have all the space for their projects! A private well is included on the property! Come see this house to picture what home could be.
Key facts
- Private well
- Bonus room
- Back porch views
Tags
Property features AI
Finance
- Other: Vacant and available; Located in Altus UNP legal addition; No storm shelter; Homestead not indicated
- Financial info: Assumable loan: No; Current price provided (listing data)
- HOA & community: No mandatory association dues
Exterior
- Parking: 2-car garage
- Home design: Single family residence; One-level home; Residential property
- Construction: Manufactured home with aluminum siding and frame construction; Shingle roof; Combination foundation
- Exterior features: Interior lot
Interior
- Bedrooms: 3 bedrooms
- Bathrooms: 2 full bathrooms
- Heating & cooling: Heat pump
- Interior features: No fireplace; No in-law plan indicated
Neighborhood map
What this means for you Summary
Snapshot
- This is a 3-bed/2.0-bath manufactured listed at $130k.
Deal economics
- At list price, monthly cash flow is $195 ($2k/yr) — positive.
- The deal already cash-flows at list — no discount required.
- To meet the 1% rule (rent ≥ 1% of price), the offer needs to be $125k (3.6% below list).
- Recommended offer: $122k (6.0% below list) — sets the bar for market timing.
- Cap rate 8.1% vs local median 3.7% in Altus — top-decile yield for the area; either an underpriced asset or a hidden risk that comps aren't pricing in. Stress-test before assuming the spread holds.
Location & tenants
- Location reads 65/100 on livability (#151 in OK) — a middle-class / working-renter tenant base. Strengths: cost of living A+, housing A+; Watch: employment C-, amenities F, commute F.
- Altus (town): math 31% / reading 28% proficiency, ranked #69 of 270 in OK (top 26%) — low school quality limits family demand, transient renter base, plan for 1-2y turnover.
- Zoned schools: Altus Early Childhood Center (390 students, 0% FRL); Altus Hs (math 21% / reading 26%, grade F, #218 of 447 statewide, top 49%, 921 students, 0% FRL) — zoned schools average 0% FRL vs 55% district-wide (55 pts lower); this property's tenant base skews higher-income than the district average.
- Market conditions: 165 active listings in the ZIP; 8 units permitted in Jackson County in 2024 (0 in 5+ unit buildings).
Forward outlook
- Local home prices are declining (-3.0%/yr); year-one equity from $899 of loan paydown is wiped out by about $4k of value loss. Plan a longer hold.
- Jackson County population projected to shrink 6% by 2050 — rents likely to lag national; underwrite the cash flow, not the appreciation.
Negotiation context
- It's been on market 81 days — a 6% lower offer ($122k) is reasonable based on typical stale-listing flexibility.
- 6 sale attempts since 9y ago with the ask held roughly flat each time — persistent listings suggest the price (not the market) is what's stuck; bring a comps-based counter.
- Current owner paid $40k; list at $130k implies a 225% gain — meaningful room to come down on a strong offer.
Risks & watch-outs
- Climate carrying-cost: extreme-heat days projected 7→19/yr by 2055 (HVAC capex compounding) — expect insurance premiums to compound above CPI over the hold.
Questions for the listing agent
- It's been on market 81 days. Have you received any prior offers? Is the seller open to a 6% concession, seller financing, or rate buy-down credit?
- Why hasn't it sold? Are there any deal-killer items the seller is aware of (foundation, flood, title, zoning, code violations)?
- Is there a deadline driving the sale (1031 exchange, divorce, estate, relocation)? That informs how much negotiation room exists.
- Schools are D-rated, which usually means shorter tenancies and higher turnover. Who's the typical renter profile here, and what's been the actual vacancy rate?
- What's the average days-on-market for RENTAL listings here right now (not sales)? A rising rental-DOM trend means longer vacancies and softer asking-rent achievability than the comps imply.
- What's the recent tenant-quality profile in this submarket — average credit score on applications, eviction rate, late-payment / NSF rate, and stable-employment percentage? A property-management company in the area should have these aggregated.
- How much new for-sale + rental construction is in the pipeline within 1–3 miles? Heavy new supply typically softens prices + rents 12–24 months out; constrained supply supports both.
Investment metrics
- 1% rule
- 0.96% ✗
- Cap rate
- 8.10%
- Cash-on-cash
- 6.44%
- DSCR
- 1.29
- GRM
- 8.6
CMA / ARV
No comps found within radius.
Projected returns pro-forma
-3.0% appreciation · 3.0% rent growth · sell at horizon
- IRR
- -6.4%
- Equity multiple
- 0.76×
- Total profit
- $-8,663
- Equity at exit
- $19,383
- IRR
- 3.2%
- Equity multiple
- 1.23×
- Total profit
- $8,303
- Equity at exit
- $11,240
Cash invested: $36,400 (down + closing). Projections, not guarantees.
Landlord ↔ Tenant lean methodology
- Overall (STATE)
- 83 Strongly Landlord-Friendly
- State Oklahoma
- 83 Strongly Landlord-Friendly · R+20
- County
- — inherits STATE
- City
- — inherits STATE
ZIP-level market 73521
- Home prices YoY
- -18.4%
- Active inventory
- 165
- Price-to-rent
- 8.6×
Monthly cashflow live
- Estimated rent
- $1,253 medium interval (Pro) →
- Mortgage (P&I)
- −$682
- Tax from tax record
- −$59 /mo · $704/yr
- Insurance
- −$54
- HOA
- −$0
- Vacancy / Maint / Mgmt
- −$263
- Net cashflow
- $195
Break-even live
UW: 25.0% down · 7.5% · 30yr · 1.5% tax · 5.0% vac · 8.0% maint · 8.0% mgmt
Financing live
Cash to close
- Down payment
- $32,500
- Closing costs
- $3,900
- Reserves months
- —
- Total cash needed
- —
Loan-product check · same deal, 3 products live
Conventional
25% down · 7.5% · 30yr
- Down + closing
- —
- Monthly P&I
- —
- Monthly cashflow
- —
- DSCR
- —
- Eligible?
- —
Personal DTI + credit; lowest rate.
DSCR
20% down · 8.5% · 30yr
- Down + closing
- —
- Monthly P&I
- —
- Monthly cashflow
- —
- DSCR
- —
- Eligible?
- —
No personal income docs; deal must DSCR.
Hard money
10% down · 12.0% · 12mo
- Down + closing
- —
- Monthly P&I
- —
- Monthly cashflow
- —
- DSCR
- —
- Eligible?
- —
Short-term bridge; refi at stabilization.
Listing history 29 events
-
2026-06-18days on market $130,000 Active 81 DOM
-
2026-06-17days on market $130,000 Active 80 DOM
-
2026-06-16days on market $130,000 Active 79 DOM
-
2026-06-15days on market $130,000 Active 78 DOM
-
2026-06-13days on market $130,000 Active 76 DOM
-
2026-06-12days on market $130,000 Active 75 DOM
-
2026-06-09days on market $130,000 Active 72 DOM
-
2026-06-08days on market $130,000 Active 71 DOM
-
2026-06-08days on market $130,000 Active 70 DOM
-
2026-06-07days on market $130,000 Active 69 DOM
-
2026-06-04days on market $130,000 Active 66 DOM
-
2026-06-02days on market $130,000 Active 65 DOM
-
2026-06-01days on market $130,000 Active 64 DOM
-
2026-05-31days on market $130,000 Active 63 DOM
-
2026-03-27$130,000 Active
-
2026-03-15historical
-
2026-01-08status Active
-
2026-01-04status Pending
-
2026-01-03status Active
-
2026-01-01historical
-
2025-12-27price $180,000
-
2025-12-03status Active
-
2025-12-02historical
-
2025-07-21price $125,000
-
2025-06-11$150,000 Active
-
2018-03-19historical
-
2017-09-20$139,900
-
2013-08-08soldstatus $40,000
-
2011-02-25soldstatus $30,000
ⓘ Source: listings_history table (triggers on properties + properties_extension) + one-shot
backfill from property_details.listing_events for pre-trigger history.
Tax reassessment forecast OK · Resets to sale price
- Current annual tax
- $704 · $59/mo
- Projected year-2 tax
- $1,170 · $98/mo
- Expected delta
- +$466/yr (+$39/mo · 66.2%)
ⓘ Screening estimate from a state-policy table — verify with the county assessor before closing.
Climate risk First Street
- Flood 1/10 Low FEMA zone X (shaded) · 0% chance over 30 yrs
- Wildfire 1/10 Low
- Heat 6/10 Major 7 d/yr ≥108°F today · 19 d/yr by 30 yrs out
- Wind 3/10 Moderate 5% chance of damaging wind over 30 yrs
- Air quality 1/10 Low 0 unhealthy d/yr today · 0 by 30 yrs out
Nearby sold comps map
Loading sold comps map…
Walkable amenities ~0.75 mi
Loading nearby amenities…
Taxation est. · year 1
- Rental income
- $15,038
- − Mortgage interest
- −$7,282
- − Property taxes
- −$704
- − Insurance
- −$650
- − Repairs & maintenance
- −$1,203
- − Management
- −$1,203
- − Depreciation
- −$3,782
- Taxable income
- $214
- Est. tax owed @ 24.0%
- −$51
- After-tax cash flow
- $2,294/yr
For passive investors: Depreciation is non-cash, so a rental often shows a tax loss while cash-flowing — sheltering income. Rental losses are passive: they offset passive income freely, and up to $25,000/yr can offset ordinary (W-2) income if you actively participate and your MAGI is under $100k (phasing out to $0 by $150k); unused losses carry forward. On sale, claimed depreciation is recaptured at up to 25%, and gains may owe capital-gains tax (a 1031 exchange can defer both). Figures are a year-1 estimate at your 24.0% rate — not tax advice; consult a CPA.
Schools (NCES district)
- District
- Altus
- NCES district ID
- 4002850
- Math proficiency
- 31% ▼ -9.00%
- Reading proficiency
- 28% ▼ -10.00%
- Median HH income
- $40,607
- Composite
- 24.91/100
- National rank
- #7574
- State rank
- #69 of 270 in OK
Livability — Altus
- Score
- 65/100
- State rank
- #151
- US rank
- #13386
Category grades
Schools grade is shown separately in the Schools card above.
Census & demographics
- Census place
- Altus, OK
- City population
- 20,574
- Population (ZIP)
- 20,352
Population outlook (Jackson County) Hauer SSP2
- Today (2025)
- 24,084 people
- By 2030
- 23,476 · -2.5%
- By 2040
- 22,731 · -5.6%
- By 2050
- 22,586 · -6.2%
- By 2075
- 25,413 · +5.5%
- By 2100
- 31,069 · +29.0%
Race, ethnicity, and origin ACS 2023
- Neighborhood character
- Diverse neighborhood (Simpson 0.57)
- Race & ethnicity
- White 60% Hispanic / Latino 26% Two or more races 12% Black 7% Native American 2% Asian 2%
- Hispanic origin (detail)
- Mexican 21% Puerto Rican 1%
- Common ancestry
- Slovak 2% Lithuanian 1% Iranian 1%
- Foreign-born
- 6% · Canada
- Languages at home
- 83% English-only · Spanish 15% Tagalog/Filipino 1% German/W. Germanic 1%
Political lean MEDSL · Jackson
- 2024 margin
- Solid R (+58.3) · D 19.9% · R 78.2% · Other 1.9%
- 2008→2024 swing
- -8.7pp toward R · 2008: -49.6pp · 2024: -58.3pp
- All cycles
- 2024: R+58.3 2020: R+57.7 2016: R+57.6 2012: R+50.7 2008: R+49.6
Not yet ingested
- Civics
- —
Market trends
- HPI YoY
- ▼ -40.26%
- Current HPI
- 178.7106
- Rent YoY
- —
- Metro
- —
- State GDP YoY
- ▲ 1.55%
- F500 in state
- 6
Industry mix (Fortune 500 HQ in OK)
| Industry | F500 HQs | Revenue |
|---|---|---|
| Energy | 3 | $48B |
|
||
Price history
+333.3% since first listed15 events — show timeline
- 2026-03-27 Listed $130,000 MLSOK
- 2026-03-15 Listing Removed — MLSOK
- 2026-01-08 Relisted — MLSOK
- 2026-01-04 Pending — MLSOK
- 2026-01-03 Relisted — MLSOK
- 2026-01-01 Listing Removed — MLSOK
- 2025-12-27 Price Changed $180,000 MLSOK
- 2025-12-03 Relisted — MLSOK
- 2025-12-02 Listing Removed — MLSOK
- 2025-07-21 Price Changed $125,000 MLSOK
- 2025-06-11 Listed $150,000 MLSOK
- 2018-03-19 Listing Removed — MLSOK
- 2017-09-20 Listed $139,900 MLSOK
- 2013-08-08 Sold (Public Records) $40,000 Public Records
- 2011-02-25 Sold (Public Records) $30,000 Public Records
Property tax history
+1.3%/yrLatest (2025): $704 · +4.3% YoY. Source: county tax records.
Cash-flow waterfall
monthlySold comps — $/sqft
last 12 mo · ≤1 miLoading sold comps…