 Multi-family
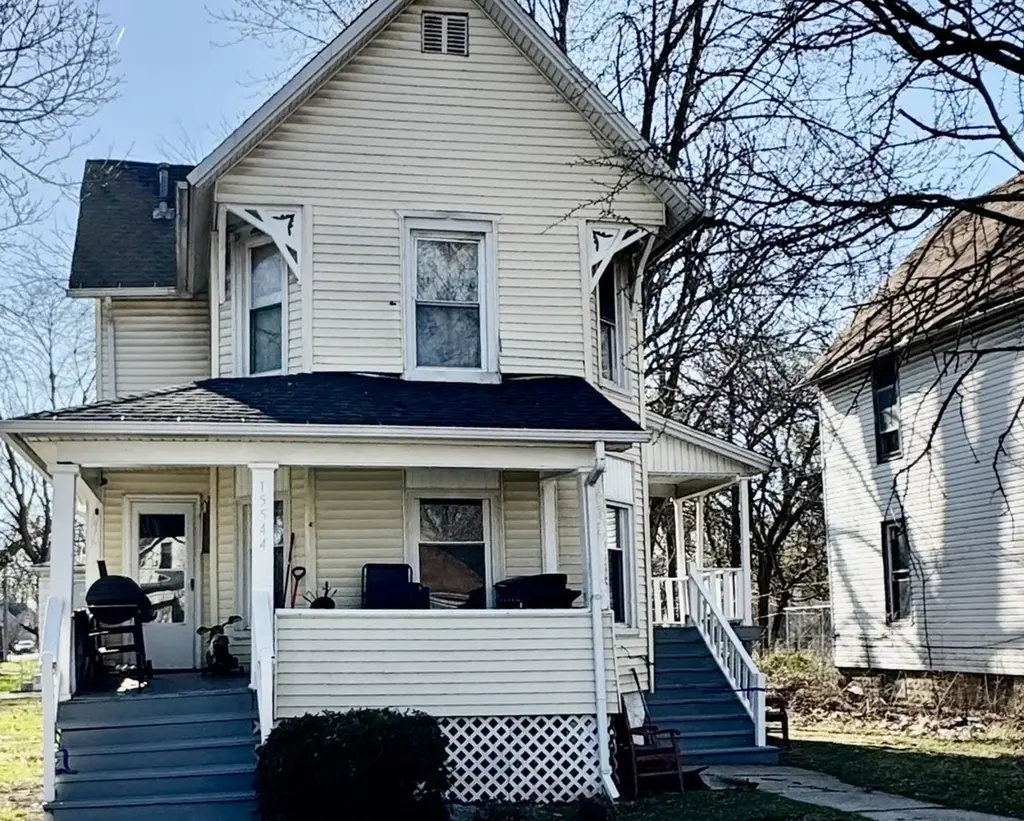
15544 Turlington Ave · Harvey, IL
Flood risk 4/10 · Minor
- FEMA flood zone
- X (unshaded)
- Chance of flooding over 30 yrs
- 0.21%
- Est. flood insurance / yr
- $473 – $860
Fire risk 1/10 · Minimal
- Est. fire insurance / yr
- $804 – $1,492
Heat risk 3/10 · Minor
- Hot days now (above 102°F)
- 7 days/yr
- Hot days in 30 yrs
- 15 days/yr
Wind risk 2/10 · Minimal
- Chance of severe wind over 30 yrs
- —
Air-quality risk 4/10 · Minor
- Unhealthy air days now
- 4 days/yr
- Unhealthy air days in 30 yrs
- 5 days/yr
Risk factors via First Street. Map © Google.
Why this score? — see what drove the C- grade
The composite is a weighted blend of 9 inputs, each scored 0–100. Each bar is that input's sub-score; the figure is the points it added to the 100-point composite (weight × sub-score).
- Cash flow +15.0/30.0
- Appreciation +10.0/10.0
- ARV discount +7.5/15.0
- 1% rule +5.0/10.0
- DSCR +5.0/10.0
- Livability +3.4/5.0
- Rent growth +2.5/5.0
- Condition / age +2.5/5.0
- Schools +0.7/10.0
$94,500
🖨 Deal sheet (PDF) 📄 Offer letter ✓ Due diligence
Multi-family units
County records classify this as Multi-Family (5+ Unit). Listing-text estimate: 1 unit. estimate disagrees with records
5+ unit building — per-unit beds/baths from public records are typically unavailable; the breakdown below (if shown) is an estimate from the listing text.
Key facts
- Prime corner lot
- Convenient location
- Maximizing privacy
Tags
Property features AI
Finance
- Other: Parcel number provided
- Financial info: Two units in the building; One unit currently rented for $1,242 with lease through August 1, 2025; Other unit has tenant responsibilities for electric and heat; lease expiration date listed as December 1, 1999 (needs verification); Special service area: No
Exterior
- Utilities: Water from Lake Michigan / public water; Public sewer
- Home design: Two-to-four unit property; Fee simple ownership; Over 100 years old; Built before 1978; Vinyl siding exterior
- Construction: Vinyl siding construction
- Exterior features: Commuter bus and commuter train access nearby; Lot dimensions approximately 60 x 180; Lot smaller than 0.25 acre
Interior
- Kitchen: No appliances listed for units
- Bedrooms: 5 bedrooms total; Building includes a 3‑bed unit and a 2‑bed unit
- Bathrooms: 2 full bathrooms total
- Heating & cooling: Natural gas heating with forced air
- Interior features: 9 total rooms; Unfinished, daylight basement
- Laundry & utility: Tenant pays electric and heat for units (where noted)
Neighborhood map
What this means for you Summary
Snapshot
- This is a 4-bed/4.0-bath multifamily listed at $94k.
Deal economics
- At list price, monthly cash flow is $3k ($31k/yr) — positive.
- The deal already cash-flows at list — no discount required.
- Meets the 1% rule at list price ($4k rent vs $94k).
- Recommended offer: $92k (3.0% below list) — sets the bar for market timing.
- Cap rate 38.9% vs local median 9.3% in Harvey — top-decile yield for the area; either an underpriced asset or a hidden risk that comps aren't pricing in. Stress-test before assuming the spread holds.
Location & tenants
- Location reads 67/100 on livability (#539 in IL) — a middle-class / working-renter tenant base. Strengths: commute A+, cost of living A+, housing A-; Watch: health & safety D+, schools F, crime F.
- Thornton Twp Hsd 205 (suburban): math 7% / reading 8% proficiency, ranked #594 of 620 in IL (top 96%) — low school quality limits family demand, transient renter base, plan for 1-2y turnover.
- Market conditions: 134 active listings in the ZIP; 6,272 units permitted in Cook County in 2024 (4,658 in 5+ unit buildings).
Forward outlook
- In year one you build about $10k of equity ($653 loan paydown + $9k appreciation (10.0% local appreciation)).
- At projected returns (10.0% appreciation + 3.0% rent growth), your $26k cash investment doubles in ~1 year — after that, you're playing with house money.
- By year 4, paydown + projected appreciation supports a ~$36k cash-out refi (75% LTV) — recoverable capital for the next deal without selling this one.
Negotiation context
- It's been on market 41 days — a 3% lower offer ($92k) is reasonable based on typical stale-listing flexibility.
- 4 sale attempts since 19y ago with the ask held roughly flat each time — persistent listings suggest the price (not the market) is what's stuck; bring a comps-based counter.
Risks & watch-outs
- Watch-outs: built in 1888 — expect roof / HVAC / electrical / plumbing capex.
Questions for the listing agent
- It's been on market 41 days. Have you received any prior offers? Is the seller open to a 3% concession, seller financing, or rate buy-down credit?
- Built in 1888 — when were the roof, HVAC, electrical panel, plumbing, and water heater last replaced?
- Is there a deadline driving the sale (1031 exchange, divorce, estate, relocation)? That informs how much negotiation room exists.
- Schools are F-rated, which usually means shorter tenancies and higher turnover. Who's the typical renter profile here, and what's been the actual vacancy rate?
- Crime grade is F in this area — have there been break-ins, vandalism, or insurance claims at this property in the last 3 years? What carrier currently insures it and at what premium?
- What's the average days-on-market for RENTAL listings here right now (not sales)? A rising rental-DOM trend means longer vacancies and softer asking-rent achievability than the comps imply.
- What's the recent tenant-quality profile in this submarket — average credit score on applications, eviction rate, late-payment / NSF rate, and stable-employment percentage? A property-management company in the area should have these aggregated.
- How much new apartment / multifamily construction is in the pipeline within 1–3 miles? Heavy new supply (>2% of stock underway) typically softens rents 12–24 months out; light construction supports rent growth.
Investment metrics
- 1% rule
- 4.32% ✓
- Cap rate
- 38.95%
- Cash-on-cash
- 116.63%
- DSCR
- 6.19
- GRM
- 1.9
CMA / ARV
No comps found within radius.
Projected returns pro-forma
10.0% appreciation · 3.0% rent growth · sell at horizon
- IRR
- —
- Equity multiple
- 9.14×
- Total profit
- $215,322
- Equity at exit
- $85,133
- IRR
- —
- Equity multiple
- 20.10×
- Total profit
- $505,405
- Equity at exit
- $183,593
Cash invested: $26,460 (down + closing). Projections, not guarantees.
Landlord ↔ Tenant lean methodology
- Overall (STATE)
- 43 Moderately Tenant-Leaning
- State Illinois
- 43 Moderately Tenant-Leaning · D+7
- County
- — inherits STATE
- City
- — inherits STATE
ZIP-level market 60426
- Home prices YoY
- 6.9%
- Active inventory
- 134
- Price-to-rent
- 3.9×
Monthly cashflow live
- Estimated rent
- $4,082 medium interval (Pro) →
- Mortgage (P&I)
- −$496
- Tax est. 1.5%
- −$118 /mo · $1,418/yr
- Insurance
- −$39
- HOA
- −$0
- Vacancy / Maint / Mgmt
- −$857
- Net cashflow
- $2,572
Break-even live
Sensitivity live
| Price | -10% $2,637 | -5% $2,604 | +0% $2,572 | +5% $2,539 | +10% $2,506 |
|---|---|---|---|---|---|
| Rent | -10% $2,249 | -5% $2,410 | +0% $2,572 | +5% $2,733 | +10% $2,894 |
| Rate | -1.0pp $2,619 | -0.5pp $2,596 | base $2,572 | +0.5pp $2,547 | +1.0pp $2,522 |
2-unit breakdown (identical units grouped — click to expand)
| Units | Beds | Baths | Est. rent |
|---|---|---|---|
| 2× units | 2 | 1 | $4,082 |
| #1 | 2 | 1 | $2,041 |
| #2 | 2 | 1 | $2,041 |
| Total (2 units) | $4,082 | ||
UW: 25.0% down · 7.5% · 30yr · 1.5% tax · 5.0% vac · 8.0% maint · 8.0% mgmt
Financing live
Cash to close
- Down payment
- $23,625
- Closing costs
- $2,835
- Reserves months
- —
- Total cash needed
- —
Loan-product check · same deal, 3 products live
Conventional
25% down · 7.5% · 30yr
- Down + closing
- —
- Monthly P&I
- —
- Monthly cashflow
- —
- DSCR
- —
- Eligible?
- —
Personal DTI + credit; lowest rate.
DSCR
20% down · 8.5% · 30yr
- Down + closing
- —
- Monthly P&I
- —
- Monthly cashflow
- —
- DSCR
- —
- Eligible?
- —
No personal income docs; deal must DSCR.
Hard money
10% down · 12.0% · 12mo
- Down + closing
- —
- Monthly P&I
- —
- Monthly cashflow
- —
- DSCR
- —
- Eligible?
- —
Short-term bridge; refi at stabilization.
Listing history 34 events
-
2026-06-18days on market $94,500 Active 41 DOM
-
2026-06-17days on market $94,500 Active 40 DOM
-
2026-06-16days on market $94,500 Active 39 DOM
-
2026-06-15days on market $94,500 Active 38 DOM
-
2026-06-13days on market $94,500 Active 36 DOM
-
2026-06-13days on market $94,500 Active 35 DOM
-
2026-06-09days on market $94,500 Active 32 DOM
-
2026-06-08days on market $94,500 Active 31 DOM
-
2026-06-07days on market $94,500 Active 30 DOM
-
2026-06-04days on market $94,500 Active 27 DOM
-
2026-06-03days on market $94,500 Active 26 DOM
-
2026-06-02days on market $94,500 Active 25 DOM
-
2026-06-01days on market $94,500 Active 24 DOM
-
2026-05-31days on market $94,500 Active 23 DOM
-
2026-05-14price $94,500
-
2026-05-08$94,999 Active
-
2026-05-07historical
-
2026-03-16status Active
-
2026-03-06status Pending
-
2025-12-19price
-
2025-10-06price
-
2025-09-05price
-
2025-06-27price
-
2025-05-07price
-
2025-04-24price
-
2025-04-17price
-
2025-04-11Active
-
2007-10-04historical
-
2007-04-06
-
2005-09-21soldstatus $105,000
-
2004-02-05soldstatus $75,000
-
2001-04-03soldstatus $84,000
-
1985-11-07soldstatus $32,500
-
1985-10-01soldstatus $32,500
ⓘ Source: listings_history table (triggers on properties + properties_extension) + one-shot
backfill from property_details.listing_events for pre-trigger history.
Climate risk First Street
- Flood 4/10 Moderate FEMA zone X (unshaded) · 21% chance over 30 yrs
- Wildfire 1/10 Low
- Heat 3/10 Moderate 7 d/yr ≥102°F today · 15 d/yr by 30 yrs out
- Wind 2/10 Low
- Air quality 4/10 Moderate 4 unhealthy d/yr today · 5 by 30 yrs out
Nearby sold comps map
Loading sold comps map…
Walkable amenities ~0.75 mi
Loading nearby amenities…
Taxation est. · year 1
- Rental income
- $48,984
- − Mortgage interest
- −$5,293
- − Property taxes
- −$1,418
- − Insurance
- −$472
- − Repairs & maintenance
- −$3,919
- − Management
- −$3,919
- − Depreciation
- −$2,749
- Taxable income
- $31,214
- Est. tax owed @ 24.0%
- −$7,491
- After-tax cash flow
- $23,369/yr
For passive investors: Depreciation is non-cash, so a rental often shows a tax loss while cash-flowing — sheltering income. Rental losses are passive: they offset passive income freely, and up to $25,000/yr can offset ordinary (W-2) income if you actively participate and your MAGI is under $100k (phasing out to $0 by $150k); unused losses carry forward. On sale, claimed depreciation is recaptured at up to 25%, and gains may owe capital-gains tax (a 1031 exchange can defer both). Figures are a year-1 estimate at your 24.0% rate — not tax advice; consult a CPA.
Schools (NCES district)
- District
- Thornton Twp Hsd 205
- NCES district ID
- 1738970
- Math proficiency
- 7% ▬ 0.00%
- Reading proficiency
- 8% ▼ -2.00%
- Median HH income
- $43,392
- Composite
- 6.92/100
- National rank
- #9976
- State rank
- #594 of 620 in IL
Livability — Harvey
- Score
- 67/100
- State rank
- #539
- US rank
- #11162
Category grades
Schools grade is shown separately in the Schools card above.
Census & demographics
- Census place
- Harvey, IL
- City population
- 23,066
- Population (ZIP)
- 23,066
Population outlook (Cook County) Hauer SSP2
- Today (2025)
- 5,347,519 people
- By 2030
- 5,357,703 · +0.2%
- By 2040
- 5,324,924 · -0.4%
- By 2050
- 5,230,762 · -2.2%
- By 2075
- 4,785,735 · -10.5%
- By 2100
- 4,188,836 · -21.7%
Race, ethnicity, and origin ACS 2023
- Neighborhood character
- Majority Black (59%)
- Race & ethnicity
- Black 59% Hispanic / Latino 33% Two or more races 12% White 3% Asian 2%
- Hispanic origin (detail)
- Mexican 31%
- Foreign-born
- 17% · Canada
- Languages at home
- 67% English-only · Spanish 30% Other Indo-European 2% French/Haitian/Cajun 1%
Political lean MEDSL · Cook
- 2024 margin
- Solid D (+42.0) · D 70.4% · R 28.4% · Other 1.2%
- 2008→2024 swing
- -11.4pp toward R · 2008: 53.4pp · 2024: 42.0pp
- All cycles
- 2024: D+42.0 2020: D+50.3 2016: D+53.0 2012: D+49.4 2008: D+53.4
Not yet ingested
- Civics
- —
Market trends
- HPI YoY
- ▲ 20.36%
- Current HPI
- 313.7895
- Rent YoY
- —
- Metro
- —
- State GDP YoY
- ▲ 1.59%
- F500 in state
- 60
Industry mix (Fortune 500 HQ in IL)
| Industry | F500 HQs | Revenue |
|---|---|---|
| Insurance | 4 | $201B |
|
||
| Consumer Goods | 4 | $87B |
|
||
| Industrial Machinery | 3 | $64B |
|
||
| Healthcare | 2 | $55B |
|
||
| Retail / Pharmacy | 1 | $148B |
|
||
| Agriculture / Food | 1 | $86B |
|
||
Price history
+190.8% since first listed20 events — show timeline
- 2026-05-14 Price Changed $94,500 MRED as Distributed by MLS Grid
- 2026-05-08 Listed $94,999 MRED as Distributed by MLS Grid
- 2026-05-07 Listing Removed — MRED as Distributed by MLS Grid
- 2026-03-16 Relisted — MRED as Distributed by MLS Grid
- 2026-03-06 Pending — MRED as Distributed by MLS Grid
- 2025-12-19 Price Changed — MRED as Distributed by MLS Grid
- 2025-10-06 Price Changed — MRED as Distributed by MLS Grid
- 2025-09-05 Price Changed — MRED as Distributed by MLS Grid
- 2025-06-27 Price Changed — MRED as Distributed by MLS Grid
- 2025-05-07 Price Changed — MRED as Distributed by MLS Grid
- 2025-04-24 Price Changed — MRED as Distributed by MLS Grid
- 2025-04-17 Price Changed — MRED as Distributed by MLS Grid
- 2025-04-11 Listed — MRED as Distributed by MLS Grid
- 2007-10-04 Listing Removed — MRED as Distributed by MLS Grid
- 2007-04-06 Listed — MRED as Distributed by MLS Grid
- 2005-09-21 Sold (Public Records) $105,000 Public Records
- 2004-02-05 Sold (Public Records) $75,000 Public Records
- 2001-04-03 Sold (Public Records) $84,000 Public Records
- 1985-11-07 Sold (Public Records) $32,500 Public Records
- 1985-10-01 Sold (Public Records) $32,500 Public Records
Property tax history
+3.2%/yrLatest (2023): $5,883 · +10.3% YoY. Source: county tax records.
Cash-flow waterfall
monthlySold comps — $/sqft
last 12 mo · ≤1 miLoading sold comps…