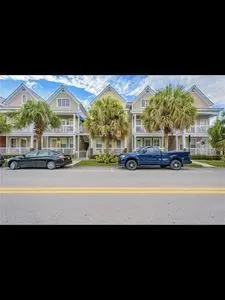
2002 E 5th Ave · Tampa, FL
Flood risk 1/10 · Minimal
- FEMA flood zone
- X (unshaded)
- Chance of flooding over 30 yrs
- 0.0%
- Est. flood insurance / yr
- $507 – $1,088
Fire risk 1/10 · Minimal
- Est. fire insurance / yr
- $947 – $1,759
Heat risk 10/10 · Severe
- Hot days now (above 107°F)
- 7 days/yr
- Hot days in 30 yrs
- 28 days/yr
Wind risk 9/10 · Severe
- Chance of severe wind over 30 yrs
- 99.0%
Air-quality risk 3/10 · Minor
- Unhealthy air days now
- 3 days/yr
- Unhealthy air days in 30 yrs
- 4 days/yr
Risk factors via First Street. Map © Google.
Why this score? — see what drove the D- grade
The composite is a weighted blend of 9 inputs, each scored 0–100. Each bar is that input's sub-score; the figure is the points it added to the 100-point composite (weight × sub-score).
- Appreciation +10.0/10.0
- ARV discount +7.5/15.0
- Schools +4.2/10.0
- Cash flow +4.1/30.0
- Livability +4.0/5.0
- Rent growth +2.6/5.0
- Condition / age +2.5/5.0
- 1% rule +1.9/10.0
- DSCR +0.0/10.0
$285,000
🖨 Deal sheet (PDF) 📄 Offer letter ✓ Due diligence
Listing remarks MLS
Hurry to see this immaculate 2/2 condo in Historical City District just steps to restaurants, theatres, clubs and trolly. The bright kitchen features breakfast bar, closet pantry and upgraded appliances. Formal dining is conveniently located off kitchen a nd open to spacious family room with soaring ceilings and windows overlooking cozy patio. The master suite boasts private bath and customized walk-in closet. Laminate floors, fresh custom paint 3M Solar Security Film on all glass, wireless security system and TWO PARKING SPACES are all included in this fabulous ground floor 2005 condo!
Key facts
- Gated entry
- Built 2015
Tags
Neighborhood map
What this means for you Summary
Snapshot
- This is a 2-bed/2.0-bath condo listed at $285k.
Deal economics
- At list price, monthly cash flow is $-780 ($-9k/yr) — negative.
- To cash-flow at today's rent, offer at most $224k (21.4% below list).
- To meet the 1% rule (rent ≥ 1% of price), the offer needs to be $196k (31.2% below list).
- Recommended offer: $196k (31.2% below list) — sets the bar for 1% rule.
Location & tenants
- Location reads 79/100 on livability (#142 in FL, #2,135 nationally) — a middle-class / working-renter tenant base. Strengths: commute A+, housing A+, health & safety A+; Watch: crime D+.
- Hillsborough (suburban): math 47% / reading 50% proficiency, ranked #41 of 73 in FL (top 56%) — families likely to look elsewhere, expect single-tenant / working-renter base with shorter leases.
- Zoned schools: Washington Elementary School (math 32% / reading 27%, grade F, #1,896 of 2,144 statewide, top 90%, 317 students, 78% FRL); Madison Middle School (math 43% / reading 46%, grade D, #320 of 571 statewide, top 57%, 563 students, 65% FRL); Blake High School (math 24% / reading 45%, grade F, #386 of 667 statewide, top 59%, 1,537 students, 55% FRL).
- Zoned-school proficiency averages 36% at this address vs 48% district-wide (-12 pts) — the specific schools serving this property underperform the Hillsborough average; the district grade overstates school quality for this exact location.
- Market conditions: Rents flat; 190 active listings in the ZIP; 40 comparable units currently listed for rent nearby; rentals at typical pace (median 16d on market — plan ~3-4 weeks tenant-placement turnaround); lower-income renter base — watch delinquency; 9,053 units permitted in Hillsborough County in 2024 (4,555 in 5+ unit buildings).
- At $1,960/mo this rent would consume 64% of the median local household income ($37k/yr) (locally 1374% of renters already pay >50% of income on rent) — very limited rent-growth headroom before tenants either downsize or default.
Forward outlook
- In year one you build about $30k of equity ($2k loan paydown + $28k appreciation (10.0% local appreciation)).
- Hillsborough County population projected at +37% by 2050 — long-run rental-demand tailwind backs the buy-and-hold thesis.
- By year 2, paydown + projected appreciation supports a ~$49k cash-out refi (75% LTV) — recoverable capital for the next deal without selling this one.
Negotiation context
- Only 1 days on market — expect competitive offers; lowballing is unlikely to land.
- 4 sale attempts since 21y ago with the ask held roughly flat each time — persistent listings suggest the price (not the market) is what's stuck; bring a comps-based counter.
- Current owner paid $225k; 27% above their basis — modest negotiation headroom, anchor on the comps not their cost.
Risks & watch-outs
- Climate carrying-cost: severe wind risk, 99% chance of damaging wind over 30y; extreme-heat days projected 7→28/yr by 2055 (HVAC capex compounding) — expect insurance premiums to compound above CPI over the hold.
Questions for the listing agent
- What do current leases actually rent for vs. the listed asking? Can we see a recent rent roll and the last 12 months of T-12 income?
- What does the HOA fee cover, when was the last increase, and are there any pending special assessments or reserve-fund shortfalls?
- Any open or pending special assessments — roof, HVAC, plumbing, elevator, façade? What's the per-unit balance and payoff schedule, and is the seller paying it off at close or rolling it to the buyer?
- Is there a deadline driving the sale (1031 exchange, divorce, estate, relocation)? That informs how much negotiation room exists.
- Crime grade is D in this area — have there been break-ins, vandalism, or insurance claims at this property in the last 3 years? What carrier currently insures it and at what premium?
- The area grade is low — what's the realistic commute time and amenity access for the typical tenant pool here? Any planned neighborhood developments (good or bad) we should know about?
- What's the average days-on-market for RENTAL listings here right now (not sales)? A rising rental-DOM trend means longer vacancies and softer asking-rent achievability than the comps imply.
- What's the recent tenant-quality profile in this submarket — average credit score on applications, eviction rate, late-payment / NSF rate, and stable-employment percentage? A property-management company in the area should have these aggregated.
- How much new apartment / multifamily construction is in the pipeline within 1–3 miles? Heavy new supply (>2% of stock underway) typically softens rents 12–24 months out; light construction supports rent growth.
Investment metrics
- 1% rule
- 0.69% ✗
- Cap rate
- 3.01%
- Cash-on-cash
- -11.72%
- DSCR
- 0.48
- GRM
- 12.1
CMA / ARV
No comps found within radius.
Projected returns pro-forma
10.0% appreciation · 0.58% rent growth · sell at horizon
- IRR
- 15.5%
- Equity multiple
- 2.27×
- Total profit
- $101,159
- Equity at exit
- $256,751
- IRR
- 14.6%
- Equity multiple
- 5.12×
- Total profit
- $328,887
- Equity at exit
- $553,692
Cash invested: $79,800 (down + closing). Projections, not guarantees.
Landlord ↔ Tenant lean methodology
- Overall (STATE)
- 87 Strongly Landlord-Friendly
- State Florida
- 87 Strongly Landlord-Friendly · R+3
- County
- — inherits STATE
- City
- — inherits STATE
ZIP-level market 33605
- Home prices YoY
- 3.7%
- Rents YoY
- 0.6%
- Active inventory
- 190
- Price-to-rent
- 12.1×
Monthly cashflow live
- Estimated rent
- $1,960 high interval (Pro) →
- Mortgage (P&I)
- −$1,495
- Tax est. 1.5%
- −$356 /mo · $4,275/yr
- Insurance
- −$119
- HOA est. from 2 same-building comps
- −$358
- Vacancy / Maint / Mgmt
- −$411
- Net cashflow
- $-780
Break-even live
Sensitivity live
| Price | -10% $-583 | -5% $-681 | +0% $-780 | +5% $-878 | +10% $-977 |
|---|---|---|---|---|---|
| Rent | -10% $-934 | -5% $-857 | +0% $-780 | +5% $-702 | +10% $-625 |
| Rate | -1.0pp $-636 | -0.5pp $-707 | base $-780 | +0.5pp $-853 | +1.0pp $-929 |
UW: 25.0% down · 7.5% · 30yr · 1.5% tax · 5.0% vac · 8.0% maint · 8.0% mgmt
Financing live
Cash to close
- Down payment
- $71,250
- Closing costs
- $8,550
- Reserves months
- —
- Total cash needed
- —
Loan-product check · same deal, 3 products live
Conventional
25% down · 7.5% · 30yr
- Down + closing
- —
- Monthly P&I
- —
- Monthly cashflow
- —
- DSCR
- —
- Eligible?
- —
Personal DTI + credit; lowest rate.
DSCR
20% down · 8.5% · 30yr
- Down + closing
- —
- Monthly P&I
- —
- Monthly cashflow
- —
- DSCR
- —
- Eligible?
- —
No personal income docs; deal must DSCR.
Hard money
10% down · 12.0% · 12mo
- Down + closing
- —
- Monthly P&I
- —
- Monthly cashflow
- —
- DSCR
- —
- Eligible?
- —
Short-term bridge; refi at stabilization.
Rent comps 40 comps
| Address | Beds | Baths | Sqft | Rent | $/sqft | DOM | Units | Dist |
|---|---|---|---|---|---|---|---|---|
| 2002 E 5th Ave Tampa, FL | 2.0 | 2.0 | 1064 | $1,795 | $1.69 | 7d | 1 | 0.02mi |
| 2006 E 4th Ave Tampa, FL | 2.0 | 2.0 | 1140 | $2,000 | $1.75 | 16d | 1 | 0.06mi |
| 1817 E 4th Ave Tampa, FL | 2.0 | 1.0 | 900 | $2,400 | $2.67 | 7d | 1 | 0.12mi |
| 1510 N 17th St Unit 1C Tampa, FL | 2.0 | 2.0 | 795 | $1,900 | $2.39 | 26d | 1 | 0.24mi |
| 2312 E 8th Ave Tampa, FL | 3.0 | 2.0 | 1420 | $2,500 | $1.76 | 13d | 1 | 0.31mi |
| 1810 E Palm Ave #5304 Tampa, FL | 1.0 | 1.0 | 867 | $1,595 | $1.84 | 6d | 1 | 0.32mi |
| 2312 E 9th Ave Tampa, FL | 3.0 | 2.0 | 1008 | $2,200 | $2.18 | 26d | 1 | 0.33mi |
| 2409 E 2nd Ave Tampa, FL | 2.0 | 1.0–2.0 | 882 | $2,787 | $3.16 | 0d | 18 | 0.38mi |
| 2504 E 12th Ave Tampa, FL | 3.0 | 2.0 | 1422 | $2,500 | $1.76 | 7d | 1 | 0.49mi |
| E 2nd Ave Tampa, FL | 2.0 | 2.0 | 1108 | $4,515 | $4.07 | 26d | 2 | 0.54mi |
| 2308 E 15th Ave Tampa, FL | 3.0 | 1.0 | 936 | $1,895 | $2.02 | 16d | 1 | 0.55mi |
| 2006 E Columbus Dr Unit A Tampa, FL | 2.0 | 1.0 | 896 | $1,495 | $1.67 | 3d | 1 | 0.55mi |
| 2104 E Columbus Dr Unit 301 Tampa, FL | 3.0 | 2.0 | 1083 | $2,050 | $1.89 | 26d | 1 | 0.56mi |
| 2104 E Columbus Dr Tampa, FL | 3.0 | 2.0 | 1231 | $1,995 | $1.62 | 26d | 1 | 0.56mi |
| 1716 E Columbus Dr Unit A Tampa, FL | 2.0 | 1.0 | 924 | $1,800 | $1.95 | 26d | 1 | 0.57mi |
| 1722 Nick Nuccio Pkwy Tampa, FL | 1.0 | 1.0 | 704 | $2,200 | $3.12 | 1d | 1 | 0.60mi |
| 2703 N 24th St Unit 1 Tampa, FL | 3.0 | 3.0 | 1164 | $2,295 | $1.97 | 1d | 1 | 0.61mi |
| 2703 N 24th St Unit 1 Tampa, FL | 3.0 | 3.0 | 1164 | $2,295 | $1.97 | 16d | 1 | 0.61mi |
| 1720 Nick Nuccio Pkwy Tampa, FL | 3.0 | 1.0–3.0 | 955 | $3,170 | $3.32 | 26d | 40 | 0.61mi |
| 2407 E 17th Ave Tampa, FL | 3.0 | 2.0 | 810 | $1,650 | $2.04 | 26d | 1 | 0.63mi |
| 2407 E 17th Ave Tampa, FL | 3.0 | 2.0 | 810 | $1,595 | $1.97 | 1d | 1 | 0.63mi |
| 2407 E 17th Ave Tampa, FL | 3.0 | 2.0 | 810 | $1,650 | $2.04 | 23d | 1 | 0.63mi |
| 2407 E 17th Ave Apt A Tampa, FL | 3.0 | 2.0 | 810 | $1,595 | $1.97 | 12d | 1 | 0.63mi |
| 2407 E 17th Ave Unit B Tampa, FL | 3.0 | 2.0 | 810 | $1,650 | $2.04 | 19d | 1 | 0.63mi |
| 2407 E 17th Ave Apt A Tampa, FL | 3.0 | 2.0 | 810 | $1,650 | $2.04 | 16d | 1 | 0.63mi |
| 2403 Durham St Tampa, FL | 2.0 | 1.0 | 702 | $1,150 | $1.64 | 0d | 1 | 0.64mi |
| 2403 Durham St Unit 1 Tampa, FL | 1.0 | 1.0 | 702 | $1,195 | $1.70 | 16d | 1 | 0.64mi |
| 2506 E Columbus Dr Tampa, FL | 2.0 | 1.0 | 796 | $1,950 | $2.45 | 19d | 1 | 0.65mi |
| 1620 Nuccio Pkwy Tampa, FL | 2.0 | 1.0–2.0 | 770 | $3,438 | $4.46 | 1d | 300 | 0.66mi |
| 2214 E 18th Ave Tampa, FL | 3.0 | 2.0 | 1188 | $2,295 | $1.93 | 7d | 1 | 0.67mi |
| 1607 E 18th Ave Tampa, FL | 2.0 | 1.0 | 869 | $2,600 | $2.99 | 14d | 1 | 0.67mi |
| 2608 Durham St Unit B Tampa, FL | 3.0 | 1.0 | 848 | $1,600 | $1.89 | 26d | 1 | 0.69mi |
| 2610 Durham St Tampa, FL | 1.0 | 1.0 | 701 | $1,250 | $1.78 | 22d | 1 | 0.70mi |
| 2610 Durham St Apt B Tampa, FL | 1.0 | 1.0 | 701 | $1,250 | $1.78 | 26d | 1 | 0.70mi |
| 2610 Durham St Apt B Tampa, FL | 2.0 | 1.0 | 1088 | $1,250 | $1.15 | 16d | 1 | 0.70mi |
| 617 N 12th St Unit 1312524P Tampa, FL | 1.0 | 1.0 | 796 | $4,027 | $5.06 | 16d | 1 | 0.70mi |
| 617 N 12th St Unit 1312524P Tampa, FL | 1.0 | 1.0 | 796 | $4,022 | $5.05 | 0d | 1 | 0.70mi |
| 2810 N 16th St Tampa, FL | 2.0 | 1.0 | 1066 | $2,550 | $2.39 | 14d | 1 | 0.71mi |
| 2406 E Clark St Unit A Tampa, FL | 1.0 | 1.0 | 785 | $1,325 | $1.69 | 14d | 1 | 0.72mi |
| 2406 E Clark St Unit B Tampa, FL | 1.0 | 1.0 | 785 | $1,325 | $1.69 | 23d | 1 | 0.72mi |
HOA detail condo
- Monthly dues
- $0 · $0/yr
- Likely covers
- security
- Assessments
- None detected in remarks — confirm with the listing agent.
Listing history 8 events
-
2026-05-26$285,000 Active
-
2026-05-25price $1,795
-
2026-05-15price $1,895
-
2026-04-10$1,995
-
2024-05-10historical $2,500
-
2024-04-23$2,500
-
2005-12-06soldstatus $225,000 593-char remark
Show marketing remark (593 chars)
Hurry to see this immaculate 2/2 condo in Historical City District just steps to restaurants, theatres, clubs and trolly. The bright kitchen features breakfast bar, closet pantry and upgraded appliances. Formal dining is conveniently located off kitchen a nd open to spacious family room with soaring ceilings and windows overlooking cozy patio. The master suite boasts private bath and customized walk-in closet. Laminate floors, fresh custom paint 3M Solar Security Film on all glass, wireless security system and TWO PARKING SPACES are all included in this fabulous ground floor 2005 condo!
-
2005-09-13$225,400 593-char remark
Show marketing remark (593 chars)
Hurry to see this immaculate 2/2 condo in Historical City District just steps to restaurants, theatres, clubs and trolly. The bright kitchen features breakfast bar, closet pantry and upgraded appliances. Formal dining is conveniently located off kitchen a nd open to spacious family room with soaring ceilings and windows overlooking cozy patio. The master suite boasts private bath and customized walk-in closet. Laminate floors, fresh custom paint 3M Solar Security Film on all glass, wireless security system and TWO PARKING SPACES are all included in this fabulous ground floor 2005 condo!
ⓘ Source: listings_history table (triggers on properties + properties_extension) + one-shot
backfill from property_details.listing_events for pre-trigger history.
Climate risk First Street
- Flood 1/10 Low FEMA zone X (unshaded) · 0% chance over 30 yrs
- Wildfire 1/10 Low
- Heat 10/10 Extreme 7 d/yr ≥107°F today · 28 d/yr by 30 yrs out
- Wind 9/10 Extreme 99% chance of damaging wind over 30 yrs
- Air quality 3/10 Moderate 3 unhealthy d/yr today · 4 by 30 yrs out
Nearby sold comps map
Loading sold comps map…
Walkable amenities ~0.75 mi
Loading nearby amenities…
Taxation est. · year 1
- Rental income
- $23,514
- − Mortgage interest
- −$15,964
- − Property taxes
- −$4,275
- − Insurance
- −$1,425
- − Repairs & maintenance
- −$1,881
- − Management
- −$1,881
- − HOA
- −$4,296
- − Depreciation
- −$8,291
- Taxable loss
- −$14,499
- Est. tax savings @ 24.0%
- +$3,480
- After-tax cash flow
- $-5,875/yr
For passive investors: Depreciation is non-cash, so a rental often shows a tax loss while cash-flowing — sheltering income. Rental losses are passive: they offset passive income freely, and up to $25,000/yr can offset ordinary (W-2) income if you actively participate and your MAGI is under $100k (phasing out to $0 by $150k); unused losses carry forward. On sale, claimed depreciation is recaptured at up to 25%, and gains may owe capital-gains tax (a 1031 exchange can defer both). Figures are a year-1 estimate at your 24.0% rate — not tax advice; consult a CPA.
Schools (NCES district)
- District
- Hillsborough
- NCES district ID
- 1200870
- Math proficiency
- 47% ▼ -8.00%
- Reading proficiency
- 50% ▼ -4.00%
- Median HH income
- $50,622
- Composite
- 41.6/100
- National rank
- #3435
- State rank
- #41 of 73 in FL
Livability — Tampa
- Score
- 79/100
- State rank
- #142
- US rank
- #2135
Category grades
Schools grade is shown separately in the Schools card above.
Census & demographics
- Census place
- Tampa, FL
- County
- Hillsborough County · 1,540,968 people
- City population
- 523,346
- Metro
- Tampa-St. Petersburg-Clearwater, FL
- Population (ZIP)
- 16,030
- Household income
- $36,975
- Rent vs Own
- Severe rent burden
- 1374.0
Population outlook (Hillsborough County) Hauer SSP2
- Today (2025)
- 1,607,022 people
- By 2030
- 1,733,968 · +7.9%
- By 2040
- 1,979,565 · +23.2%
- By 2050
- 2,203,427 · +37.1%
- By 2075
- 2,667,893 · +66.0%
- By 2100
- 2,891,558 · +79.9%
Race, ethnicity, and origin ACS 2023
- Neighborhood character
- Diverse neighborhood (Simpson 0.66)
- Race & ethnicity
- Black 48% Hispanic / Latino 28% Two or more races 18% White 17% Asian 1%
- Hispanic origin (detail)
- Mexican 6% Puerto Rican 8% Cuban 6% Dominican 1%
- Common ancestry
- Hispanic 2% Romanian 1% Lithuanian 1%
- Foreign-born
- 17% · Canada, Vietnam, Jamaica
- Languages at home
- 72% English-only · Spanish 24% French/Haitian/Cajun 3% Other Asian/Pacific 1%
Political lean MEDSL · Hillsborough
- 2024 margin
- Toss-up / Even · D 47.8% · R 50.9% · Other 1.3%
- 2008→2024 swing
- -10.2pp toward R · 2008: 7.1pp · 2024: -3.1pp
- All cycles
- 2024: R+3.1 2020: D+6.9 2016: D+6.8 2012: D+6.7 2008: D+7.1
Not yet ingested
- Civics
- —
Market trends
- HPI YoY
- ▲ 17.43%
- Current HPI
- 494.1871
- Rent YoY
- ▲ 0.58%
- Metro
- Tampa-St. Petersburg-Clearwater, FL
- State GDP YoY
- ▲ 3.28%
- F500 in state
- 36
Industry mix (Fortune 500 HQ in FL)
| Industry | F500 HQs | Revenue |
|---|---|---|
| Industrial Technology | 2 | $29B |
|
||
| Insurance | 2 | $17B |
|
||
| Retail | 1 | $60B |
|
||
| Technology Distribution | 1 | $58B |
|
||
| Homebuilding | 1 | $35B |
|
||
| Technology Manufacturing | 1 | $35B |
|
||
Price history
+26.4% since first listed8 events — show timeline
- 2026-05-26 Listed $285,000 FSBO.com
- 2026-05-25 Price Changed $1,795 RENTALBEAST
- 2026-05-15 Price Changed $1,895 RENTALBEAST
- 2026-04-10 Listed for Rent $1,995 RENTALBEAST
- 2024-05-10 Rental Removed $2,500 Avail
- 2024-04-23 Listed for Rent $2,500 Avail
- 2005-12-06 Sold (MLS) $225,000 Stellar MLS as Distributed by MLS Grid
- 2005-09-13 Listed $225,400 Stellar MLS as Distributed by MLS Grid
Cash-flow waterfall
monthlySold comps — $/sqft
last 12 mo · ≤1 miLoading sold comps…