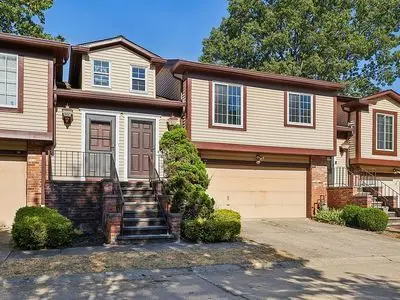
209 Greenbriar Ct · Euclid, OH
Flood risk No data
- FEMA flood zone
- —
- Chance of flooding over 30 yrs
- —
- Est. flood insurance / yr
- —
Fire risk No data
- Est. fire insurance / yr
- —
Heat risk No data
- Hot days now (above threshold)
- —
- Hot days in 30 yrs
- —
Wind risk No data
- Chance of severe wind over 30 yrs
- —
Air-quality risk No data
- Unhealthy air days now
- —
- Unhealthy air days in 30 yrs
- —
Risk factors via First Street. Map © Google.
Why this score? — see what drove the C- grade
The composite is a weighted blend of 9 inputs, each scored 0–100. Each bar is that input's sub-score; the figure is the points it added to the 100-point composite (weight × sub-score).
- Cash flow +21.8/30.0
- ARV discount +7.5/15.0
- DSCR +7.0/10.0
- 1% rule +5.7/10.0
- Condition / age +4.0/5.0
- Livability +3.9/5.0
- Rent growth +2.5/5.0
- Schools +1.7/10.0
- Appreciation +0.0/10.0
$159,900
🖨 Deal sheet 📄 Offer letter ✓ Due diligence
Listing remarks
2 Bedroom, 2 Bath condo. Open concept living/dining room area, with bonus room on the lower level. Both bathrooms have been remodeled, the whole home has been freshly painted, new flooring throughout, and all light fixtures have been updated.
Key facts
- New flooring
- Bonus room
- Freshly painted
Tags
Neighborhood map
What this means for you Summary
Snapshot
- This is a 2-bed/2.0-bath other listed at $160k. Condition is rated good.
Deal economics
- At list price, monthly cash flow is $248 ($3k/yr) — positive.
- The deal already cash-flows at list — no discount required.
- Meets the 1% rule at list price ($2k rent vs $160k).
- Recommended offer: $158k (1.5% below list) — sets the bar for market timing.
Location & tenants
- Location reads 77/100 on livability (#204 in OH, #3,149 nationally) — a middle-class / working-renter tenant base. Strengths: cost of living A+, housing A+, crime B+; Watch: schools C-, commute F, employment D-.
- Euclid City (suburban): math 14% / reading 28% proficiency, ranked #625 of 656 in OH (top 95%) — low school quality limits family demand, transient renter base, plan for 1-2y turnover; 70% free/reduced lunch — lower-income household profile, screen leases tightly.
- Market conditions: 94 active listings in the ZIP; 9 comparable units currently listed for rent nearby; rentals at typical pace (median 15d on market — plan ~3-4 weeks tenant-placement turnaround); solid renter incomes; 1,441 units permitted in Cuyahoga County in 2024 (700 in 5+ unit buildings).
Forward outlook
- Local home prices are declining (-3.0%/yr); year-one equity from $1k of loan paydown is wiped out by about $5k of value loss. Plan a longer hold.
- Cuyahoga County population projected to shrink 8% by 2050 — rents likely to lag national; underwrite the cash flow, not the appreciation.
Negotiation context
- It's been on market 29 days — a 2% lower offer ($158k) is reasonable based on typical stale-listing flexibility.
Questions for the listing agent
- Is there a deadline driving the sale (1031 exchange, divorce, estate, relocation)? That informs how much negotiation room exists.
- What's the average days-on-market for RENTAL listings here right now (not sales)? A rising rental-DOM trend means longer vacancies and softer asking-rent achievability than the comps imply.
- What's the recent tenant-quality profile in this submarket — average credit score on applications, eviction rate, late-payment / NSF rate, and stable-employment percentage? A property-management company in the area should have these aggregated.
- How much new for-sale + rental construction is in the pipeline within 1–3 miles? Heavy new supply typically softens prices + rents 12–24 months out; constrained supply supports both.
Investment metrics
- 1% rule
- 1.07% ✓
- Cap rate
- 8.15%
- Cash-on-cash
- 6.63%
- DSCR
- 1.30
- GRM
- 7.8
CMA / ARV
No comps found within radius.
Projected returns pro-forma
-3.0% appreciation · 3.0% rent growth · sell at horizon
- IRR
- -6.1%
- Equity multiple
- 0.77×
- Total profit
- $-10,121
- Equity at exit
- $23,842
- IRR
- 3.6%
- Equity multiple
- 1.26×
- Total profit
- $11,590
- Equity at exit
- $13,825
Cash invested: $44,772 (down + closing). Projections, not guarantees.
Landlord ↔ Tenant lean methodology
- Overall (STATE)
- 73 Landlord-Friendly
- State Ohio
- 73 Landlord-Friendly · R+6
- County
- — inherits STATE
- City
- — inherits STATE
ZIP-level market 44143
- Active inventory
- 94
- Price-to-rent
- 7.8×
Monthly cashflow live
- Estimated rent
- $1,712 high interval (Pro) →
- Mortgage (P&I)
- −$839
- Tax est. 1.5%
- −$200 /mo · $2,398/yr
- Insurance
- −$67
- HOA
- −$0
- Vacancy / Maint / Mgmt
- −$360
- Net cashflow
- $248
Break-even live
UW: 25.0% down · 7.5% · 30yr · 1.5% tax · 5.0% vac · 8.0% maint · 8.0% mgmt
Financing live
Cash to close
- Down payment
- $39,975
- Closing costs
- $4,797
- Reserves months
- —
- Total cash needed
- —
Loan-product check · same deal, 3 products live
Conventional
25% down · 7.5% · 30yr
- Down + closing
- —
- Monthly P&I
- —
- Monthly cashflow
- —
- DSCR
- —
- Eligible?
- —
Personal DTI + credit; lowest rate.
DSCR
20% down · 8.5% · 30yr
- Down + closing
- —
- Monthly P&I
- —
- Monthly cashflow
- —
- DSCR
- —
- Eligible?
- —
No personal income docs; deal must DSCR.
Hard money
10% down · 12.0% · 12mo
- Down + closing
- —
- Monthly P&I
- —
- Monthly cashflow
- —
- DSCR
- —
- Eligible?
- —
Short-term bridge; refi at stabilization.
Rent comps 9 comps
| Address | Beds | Baths | Sqft | Rent | $/sqft | DOM | Units | Dist |
|---|---|---|---|---|---|---|---|---|
| 25 Trenton Sq Unit T54 Cleveland, OH | 3.0 | 2.0 | 1324 | $1,500 | $1.13 | 16d | 1 | 0.26mi |
| 20051 Green Oak Dr Euclid, OH | 3.0 | 1.5 | 1092 | $1,550 | $1.42 | 14d | 1 | 0.69mi |
| 4456 Donna Dr Richmond Heights, OH | 3.0 | 2.5 | 1940 | $2,295 | $1.18 | 1d | 1 | 0.76mi |
| 19750 Euclid Ave Euclid, OH | 1.0–3.0 | 1.0–1.5 | 840 | $1,172 | $1.40 | 16d | 3 | 0.88mi |
| 22050 Chardon Rd Euclid, OH | 3.0 | 1.5 | 1209 | $1,500 | $1.24 | 43d | 1 | 0.93mi |
| 3802 Princeton Blvd Cleveland, OH | 3.0 | 1.5 | 1656 | $2,275 | $1.37 | 1d | 1 | 1.04mi |
| 376 Royal Oak Blvd Cleveland, OH | 3.0 | 1.5 | 1420 | $1,740 | $1.23 | 19d | 1 | 1.35mi |
| 1485 E 221st St Euclid, OH | 3.0 | 2.0 | 1561 | $1,500 | $0.96 | 10d | 1 | 1.41mi |
| 1485 E 221st St Euclid, OH | 3.0 | 2.0 | 1561 | $1,500 | $0.96 | 14d | 1 | 1.41mi |
Listing history 14 events
-
2026-06-18days on market $159,900 Active 29 DOM
-
2026-06-17days on market $159,900 Active 28 DOM
-
2026-06-16days on market $159,900 Active 27 DOM
-
2026-06-15days on market $159,900 Active 26 DOM
-
2026-06-13days on market $159,900 Active 24 DOM
-
2026-06-09days on market $159,900 Active 20 DOM
-
2026-06-08days on market $159,900 Active 19 DOM
-
2026-06-07days on market $159,900 Active 18 DOM
-
2026-06-05days on market $159,900 Active 15 DOM
-
2026-06-03days on market $159,900 Active 14 DOM
-
2026-06-02days on market $159,900 Active 13 DOM
-
2026-06-01days on market $159,900 Active 12 DOM
-
2026-05-31days on market $159,900 Active 11 DOM
-
2026-05-21$159,900 Active
ⓘ Source: listings_history table (triggers on properties + properties_extension) + one-shot
backfill from property_details.listing_events for pre-trigger history.
Nearby sold comps map
Loading sold comps map…
Walkable amenities ~0.75 mi
Loading nearby amenities…
Taxation est. · year 1
- Rental income
- $20,545
- − Mortgage interest
- −$8,957
- − Property taxes
- −$2,398
- − Insurance
- −$800
- − Repairs & maintenance
- −$1,644
- − Management
- −$1,644
- − Depreciation
- −$4,652
- Taxable income
- $451
- Est. tax owed @ 24.0%
- −$108
- After-tax cash flow
- $2,862/yr
For passive investors: Depreciation is non-cash, so a rental often shows a tax loss while cash-flowing — sheltering income. Rental losses are passive: they offset passive income freely, and up to $25,000/yr can offset ordinary (W-2) income if you actively participate and your MAGI is under $100k (phasing out to $0 by $150k); unused losses carry forward. On sale, claimed depreciation is recaptured at up to 25%, and gains may owe capital-gains tax (a 1031 exchange can defer both). Figures are a year-1 estimate at your 24.0% rate — not tax advice; consult a CPA.
Condition & rehab AI · 1 photo
This 2-bedroom, 2-bath condo is in good condition with recent renovations, including fresh paint, new flooring, and remodeled bathrooms. It is move-in ready with a good curb appeal.
Value-add opportunities
- Both Painting exterior — Enhances curb appeal and value
- Both Landscaping improvements — Enhances curb appeal and value
- Both New window treatments — Enhances curb appeal and value
Renovation cost estimate screening
Value-add ROI direction
- Both Painting exterior — Enhances curb appeal and value ↑
- Both Landscaping improvements — Enhances curb appeal and value ↑
- Both New window treatments — Enhances curb appeal and value ↑
ⓘ Cost ranges are severity-bucket heuristics (US national rule-of-thumb). Get contractor quotes + a written scope before underwriting a rehab budget.
Schools (NCES district)
- District
- Euclid City
- NCES district ID
- 3904395
- Math proficiency
- 14% ▼ -19.00%
- Reading proficiency
- 28% ▼ -14.00%
- Median HH income
- $36,385
- Composite
- 17.39/100
- National rank
- #9067
- State rank
- #625 of 656 in OH
Livability — Euclid
- Score
- 77/100
- State rank
- #204
- US rank
- #3149
Category grades
Schools grade is shown separately in the Schools card above.
Census & demographics
- Census place
- Euclid, OH
- County
- Cuyahoga County · 1,090,369 people
- City population
- 41,855
- Metro
- Cleveland-Elyria, OH
- Population (ZIP)
- 24,597
- Household income
- $81,268
- Rent vs Own
- Severe rent burden
- 656.0
Population outlook (Cuyahoga County) Hauer SSP2
- Today (2025)
- 1,244,621 people
- By 2030
- 1,230,093 · -1.2%
- By 2040
- 1,189,108 · -4.5%
- By 2050
- 1,145,706 · -7.9%
- By 2075
- 1,076,557 · -13.5%
- By 2100
- 978,987 · -21.3%
Race, ethnicity, and origin ACS 2023
- Neighborhood character
- Diverse neighborhood (Simpson 0.57)
- Race & ethnicity
- White 56% Black 34% Two or more races 5% Asian 3% Hispanic / Latino 3%
- Common ancestry
- Romanian 4% Scotch-Irish 2% Subsaharan African 2%
- Foreign-born
- 9% · Canada
- Languages at home
- 86% English-only · Russian/Polish/Slavic 3% Other Indo-European 3% Spanish 3%
Political lean MEDSL · Cuyahoga
- 2024 margin
- Solid D (+31.5) · D 65.4% · R 33.9%
- 2008→2024 swing
- -7.4pp toward R · 2008: 38.9pp · 2024: 31.5pp
- All cycles
- 2024: D+31.5 2020: D+34.1 2016: D+35.0 2012: D+38.7 2008: D+38.9
Not yet ingested
- Civics
- —
Market trends
- HPI YoY
- ▼ -123.55%
- Current HPI
- 167.6083
- Rent YoY
- —
- Metro
- Cleveland-Elyria, OH
- State GDP YoY
- ▲ 1.98%
- F500 in state
- 48
Industry mix (Fortune 500 HQ in OH)
| Industry | F500 HQs | Revenue |
|---|---|---|
| Insurance | 3 | $145B |
|
||
| Industrial Machinery | 3 | $49B |
|
||
| Financial Services | 3 | $24B |
|
||
| Consumer Goods | 2 | $93B |
|
||
| Aerospace / Defense | 2 | $47B |
|
||
| Utilities | 2 | $33B |
|
||
Price history
1 event — show timeline
- 2026-05-21 Listed $159,900 FSBO.com
Cash-flow waterfall
monthlySold comps — $/sqft
last 12 mo · ≤1 miLoading sold comps…