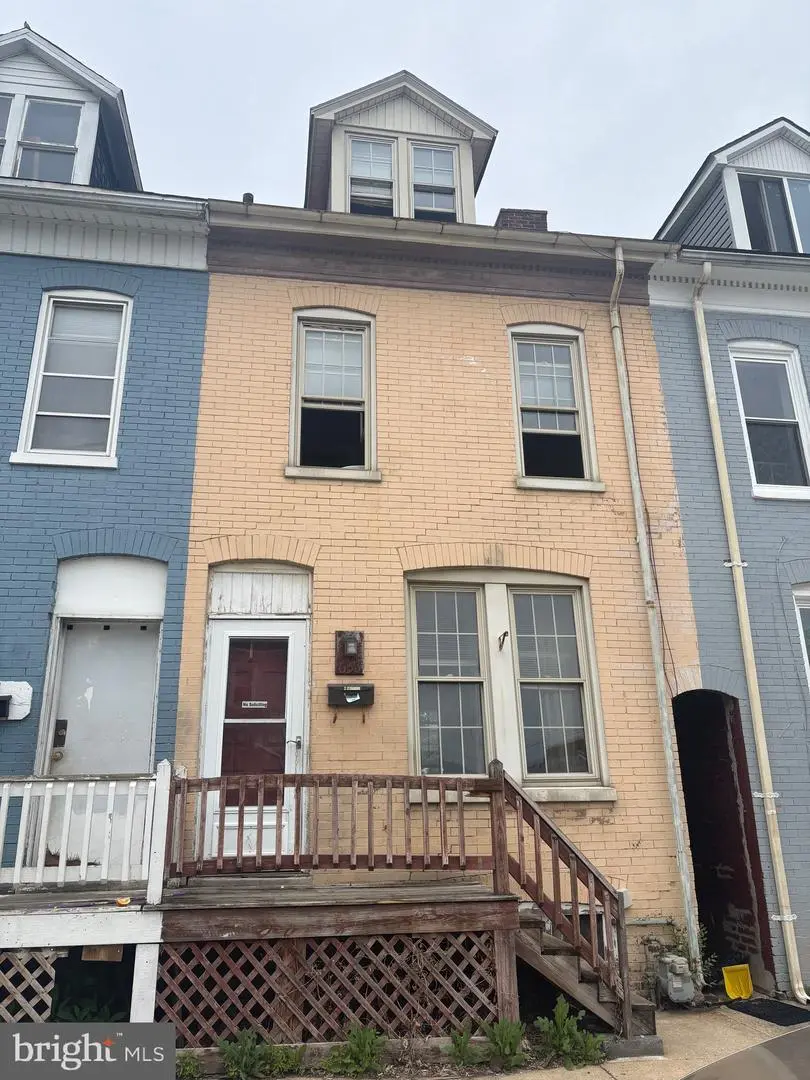
633 York St · York, PA
Flood risk 1/10 · Minimal
- FEMA flood zone
- X (unshaded)
- Chance of flooding over 30 yrs
- 0.0%
- Est. flood insurance / yr
- $473 – $860
Fire risk 1/10 · Minimal
- Est. fire insurance / yr
- $511 – $949
Heat risk 5/10 · Moderate
- Hot days now (above 102°F)
- 7 days/yr
- Hot days in 30 yrs
- 15 days/yr
Wind risk 4/10 · Minor
- Chance of severe wind over 30 yrs
- 10.0%
Air-quality risk 3/10 · Minor
- Unhealthy air days now
- 3 days/yr
- Unhealthy air days in 30 yrs
- 5 days/yr
Risk factors via First Street. Map © Google.
Why this score? — see what drove the B- grade
The composite is a weighted blend of 9 inputs, each scored 0–100. Each bar is that input's sub-score; the figure is the points it added to the 100-point composite (weight × sub-score).
- Cash flow +24.3/30.0
- ARV discount +15.0/15.0
- DSCR +7.8/10.0
- 1% rule +7.4/10.0
- Livability +3.8/5.0
- Rent growth +3.6/5.0
- Condition / age +2.5/5.0
- Schools +0.8/10.0
- Appreciation +0.0/10.0
$118,999
🖨 Deal sheet 📄 Offer letter ✓ Due diligence
Listing remarks MLS
HUD OWNED CASE#441-559768.UNINSURED, CASH, CONV, 203K. USE CAUTION!UTILITIES ARE OFF. BUYER RESPONSIBLE FOR ACTIVATING DEACTIVATING UTILITIES FOR INSPEC. APPRAISALS FOR FHA MORTGAGE IS COMPLETE, UTILITIES MUST BE ON FOR OTHER LENDERS APPR. BUYER PAYS 2% TRANSFER. NONCASH BUYER MUST BE PREAPPROVED PRIOR TO MAKE BID. OWNER OCC & SA BONUS ON WEB AT WWW. GOLDENFEATHER. COM. LD8/30/02|
Key facts
- Local park
- Nearby amenities
- Middle school
Tags
Property features AI
Finance
- Other: Lease not considered
- HOA & community: Ground rent paid annually
Exterior
- Parking: Private parking; Off-street parking
- Utilities: Public water; Public sewer
- Home design: Interior townhouse/rowhouse; Fee simple ownership; Not in a federal flood zone
- Construction: Brick construction; Shingle/asphalt roof; Other foundation; Above-grade and below-grade structures
- Exterior features: Level lot; Porch(es)
Interior
- Kitchen: Eat-in kitchen
- Bedrooms: Two bedrooms on the first upper level; One bedroom on the second upper level
- Bathrooms: One full bathroom (all upper levels)
- Heating & cooling: Forced air heating; Central air conditioning; Electric hot water
- Interior features: Eat-in kitchen; Full basement
Neighborhood map
What this means for you Summary
Snapshot
- This is a 4-bed/1.0-bath townhouse listed at $119k.
Deal economics
- At list price, monthly cash flow is $239 ($3k/yr) — positive.
- The deal already cash-flows at list — no discount required.
- Meets the 1% rule at list price ($1k rent vs $119k).
- Recommended offer: $115k (3.0% below list) — sets the bar for market timing.
- Cap rate 8.7% vs local median 5.0% in York — top-decile yield for the area; either an underpriced asset or a hidden risk that comps aren't pricing in. Stress-test before assuming the spread holds.
Location & tenants
- Location reads 75/100 on livability (#427 in PA, #3,987 nationally) — a middle-class / working-renter tenant base. Strengths: cost of living A+, health & safety A+, housing A; Watch: amenities D+, crime F, employment F.
- York City SD (urban): math 4% / reading 16% proficiency, ranked #534 of 539 in PA (top 99%) — low school quality limits family demand, transient renter base, plan for 1-2y turnover; 72% free/reduced lunch — lower-income household profile, screen leases tightly.
- Market conditions: Rents rising fast (+4.4%/yr); 213 active listings in the ZIP; 21 comparable units currently listed for rent nearby; rentals at typical pace (median 21d on market — plan ~3-4 weeks tenant-placement turnaround); solid renter incomes; 1,328 units permitted in York County in 2024 (338 in 5+ unit buildings).
Forward outlook
- Local home prices are declining (-3.0%/yr); year-one equity from $822 of loan paydown is wiped out by about $4k of value loss. Plan a longer hold.
- At projected returns (-3.0% appreciation + 4.4% rent growth), your $33k cash investment doubles in ~10 years — after that, you're playing with house money.
Negotiation context
- It's been on market 37 days — a 3% lower offer ($115k) is reasonable based on typical stale-listing flexibility.
- 2 sale attempts since 24y ago with the ask held roughly flat each time — persistent listings suggest the price (not the market) is what's stuck; bring a comps-based counter.
- Current owner paid $53k; list at $119k implies a 125% gain — meaningful room to come down on a strong offer.
Risks & watch-outs
- Watch-outs: property tax is 2.5% of price; built in 1900 — expect roof / HVAC / electrical / plumbing capex.
- Climate carrying-cost: extreme-heat days projected 7→15/yr by 2055 (HVAC capex compounding) — expect insurance premiums to compound above CPI over the hold.
Questions for the listing agent
- It's been on market 37 days. Have you received any prior offers? Is the seller open to a 3% concession, seller financing, or rate buy-down credit?
- Built in 1900 — when were the roof, HVAC, electrical panel, plumbing, and water heater last replaced?
- Property tax is high relative to price — has the assessment been appealed recently, and will the sale trigger a re-assessment?
- Is there a deadline driving the sale (1031 exchange, divorce, estate, relocation)? That informs how much negotiation room exists.
- Crime grade is F in this area — have there been break-ins, vandalism, or insurance claims at this property in the last 3 years? What carrier currently insures it and at what premium?
- What's the average days-on-market for RENTAL listings here right now (not sales)? A rising rental-DOM trend means longer vacancies and softer asking-rent achievability than the comps imply.
- What's the recent tenant-quality profile in this submarket — average credit score on applications, eviction rate, late-payment / NSF rate, and stable-employment percentage? A property-management company in the area should have these aggregated.
- How much new for-sale + rental construction is in the pipeline within 1–3 miles? Heavy new supply typically softens prices + rents 12–24 months out; constrained supply supports both.
Investment metrics
- 1% rule
- 1.24% ✓
- Cap rate
- 8.70%
- Cash-on-cash
- 8.60%
- DSCR
- 1.38
- GRM
- 6.7
CMA / ARV
- ARV (median comp)
- $153,717
- List price
- $118,999
- Delta
- -22.59%
- Verdict
- UNDERPRICED
- Comps
- 20 within 1.0 mi
Show comp detail 12 sales within ~0.75 mi
| Address | Dist | Beds/Ba | Sqft | Sold | Price | $/sf | Match |
|---|---|---|---|---|---|---|---|
| 818 Wallace St | 0.27mi | 3/1.0 (-1) | 1,220 (-0%) | 0mo | $130,000 | $107 | 81 |
| 715 E Clarke Ave | 0.28mi | 3/1.0 (-1) | 1,182 (-4%) | 1mo | $65,000 | $55 | 75 |
| 307 E Walnut St | 0.41mi | 3/1.0 (-1) | 1,265 (+3%) | 1mo | $152,000 | $120 | 70 |
| 225 N Pine St | 0.41mi | 3/1.0 (-1) | 1,182 (-4%) | 2mo | $37,500 | $32 | 68 |
| 227 N Pine St | 0.41mi | 3/1.0 (-1) | 1,182 (-4%) | 2mo | $37,500 | $32 | 68 |
| 430 E Walnut St | 0.25mi | 3/1.0 (-1) | 1,368 (+12%) | 0mo | $132,000 | $96 | 64 |
| 1151 E King St | 0.71mi | 4/1.5 | 1,228 (+0%) | 2mo | $196,000 | $160 | 63 |
| 926 E Market St | 0.46mi | 3/1.0 (-1) | 1,158 (-6%) | 2mo | $155,000 | $134 | 63 |
| 219 S Albemarle St | 0.68mi | 3/1.0 (-1) | 1,280 (+4%) | 1mo | $142,000 | $111 | 55 |
| 917 N Pine St | 0.67mi | 3/1.0 (-1) | 1,160 (-5%) | 0mo | $161,000 | $139 | 55 |
| 203 Fulton St | 0.50mi | 3/1.0 (-1) | 1,104 (-10%) | 0mo | $174,000 | $158 | 55 |
| 1147 E King St | 0.71mi | 4/1.0 | 1,394 (+14%) | 2mo | $186,000 | $133 | 42 |
Match score weights: distance 35% · size 25% · config 20% · recency 20%. Top-matched comps best support the ARV.
Projected returns pro-forma
-3.0% appreciation · 4.43% rent growth · sell at horizon
- IRR
- -1.4%
- Equity multiple
- 0.94×
- Total profit
- $-1,839
- Equity at exit
- $17,743
- IRR
- 9.9%
- Equity multiple
- 1.82×
- Total profit
- $27,401
- Equity at exit
- $10,289
Cash invested: $33,320 (down + closing). Projections, not guarantees.
Landlord ↔ Tenant lean methodology
- Overall (STATE)
- 62 Landlord-Friendly
- State Pennsylvania
- 62 Landlord-Friendly · EVEN
- County
- — inherits STATE
- City
- — inherits STATE
ZIP-level market 17403
- Home prices YoY
- -26.9%
- Rents YoY
- 4.4%
- Active inventory
- 213
- Price-to-rent
- 6.7×
Monthly cashflow live
- Estimated rent
- $1,471 high interval (Pro) →
- Mortgage (P&I)
- −$624
- Tax from tax record
- −$250 /mo · $2,998/yr
- Insurance
- −$50
- HOA
- −$0
- Vacancy / Maint / Mgmt
- −$309
- Net cashflow
- $239
Break-even live
UW: 25.0% down · 7.5% · 30yr · 1.5% tax · 5.0% vac · 8.0% maint · 8.0% mgmt
Financing live
Cash to close
- Down payment
- $29,750
- Closing costs
- $3,570
- Reserves months
- —
- Total cash needed
- —
Loan-product check · same deal, 3 products live
Conventional
25% down · 7.5% · 30yr
- Down + closing
- —
- Monthly P&I
- —
- Monthly cashflow
- —
- DSCR
- —
- Eligible?
- —
Personal DTI + credit; lowest rate.
DSCR
20% down · 8.5% · 30yr
- Down + closing
- —
- Monthly P&I
- —
- Monthly cashflow
- —
- DSCR
- —
- Eligible?
- —
No personal income docs; deal must DSCR.
Hard money
10% down · 12.0% · 12mo
- Down + closing
- —
- Monthly P&I
- —
- Monthly cashflow
- —
- DSCR
- —
- Eligible?
- —
Short-term bridge; refi at stabilization.
Rent comps 21 comps
| Address | Beds | Baths | Sqft | Rent | $/sqft | DOM | Units | Dist |
|---|---|---|---|---|---|---|---|---|
| 720 Chestnut St Apt 2 York, PA | 4.0 | 1.0 | 1400 | $1,300 | $0.93 | 13d | 1 | 0.13mi |
| 446 Wallace St York, PA | 3.0 | 1.0 | 1092 | $1,295 | $1.19 | 20d | 1 | 0.23mi |
| 30 N Franklin St York, PA | 3.0 | 1.0 | 1400 | $1,395 | $1.00 | 43d | 1 | 0.26mi |
| 40 N Tremont St #2 York, PA | 3.0 | 1.0 | 900 | $1,500 | $1.67 | 43d | 1 | 0.36mi |
| 231 Franklin Way York, PA | 3.0 | 1.0 | 920 | $1,195 | $1.30 | 13d | 1 | 0.48mi |
| 113 Arch St York, PA | 4.0 | 1.0 | 1188 | $1,200 | $1.01 | 13d | 1 | 0.62mi |
| 208 Liberty Ct York, PA | 3.0 | 1.0 | 1096 | $1,195 | $1.09 | 43d | 1 | 0.87mi |
| 334 N Beaver St York, PA | 3.0 | 1.0 | 1140 | $1,050 | $0.92 | 13d | 1 | 0.87mi |
| 715 Vander Ave York, PA | 3.0 | 1.0 | 1180 | $1,295 | $1.10 | 13d | 1 | 0.89mi |
| 42 Laurel St York, PA | 3.0 | 1.0 | 1136 | $1,375 | $1.21 | 20d | 1 | 0.90mi |
| 133 Stevens Ave York, PA | 3.0 | 1.0 | 1200 | $1,300 | $1.08 | 43d | 1 | 0.92mi |
| 443 S Duke St York, PA | 3.0 | 1.0 | 1028 | $1,225 | $1.19 | 43d | 1 | 1.04mi |
| 444 S Duke St York, PA | 3.0 | 1.0 | 1200 | $1,200 | $1.00 | 43d | 1 | 1.05mi |
| 1505 3rd Ave York, PA | 3.0 | 1.5 | 1408 | $1,800 | $1.28 | 13d | 1 | 1.05mi |
| 514 S Duke St York, PA | 3.0 | 1.0 | 1289 | $1,625 | $1.26 | 20d | 1 | 1.09mi |
| 1538 1st Ave Unit 2 York, PA | 3.0 | 2.0 | 1500 | $1,900 | $1.27 | 13d | 1 | 1.10mi |
| 549 Lancaster Ave York, PA | 3.0 | 1.0 | 1458 | $1,875 | $1.29 | 43d | 1 | 1.11mi |
| 289 Union St York, PA | 4.0 | 1.0 | 1450 | $1,600 | $1.10 | 43d | 1 | 1.12mi |
| 314 W Gay Ave York, PA | 3.0 | 1.0 | 1060 | $1,250 | $1.18 | 20d | 1 | 1.18mi |
| 330 W King St York, PA | 3.0 | 1.0 | 713 | $1,195 | $1.68 | 13d | 1 | 1.28mi |
| 216 Park Pl York, PA | 4.0 | 1.0 | 1192 | $1,350 | $1.13 | 13d | 1 | 1.36mi |
Listing history 23 events
-
2026-06-18days on market $118,999 Active 37 DOM
-
2026-06-17days on market $118,999 Active 36 DOM
-
2026-06-16days on market $118,999 Active 35 DOM
-
2026-06-15days on market $118,999 Active 34 DOM
-
2026-06-14days on market $118,999 Active 32 DOM
-
2026-06-13days on market $118,999 Active 31 DOM
-
2026-06-10days on market $118,999 Active 29 DOM
-
2026-06-09days on market $118,999 Active 28 DOM
-
2026-06-08days on market $118,999 Active 27 DOM
-
2026-06-07days on market $118,999 Active 26 DOM
-
2026-06-03days on market $118,999 Active 22 DOM
-
2026-06-03price $118,999 Active 21 DOM
-
2026-06-02days on market $119,000 Active 21 DOM
-
2026-06-01days on market $119,000 Active 20 DOM
-
2026-05-31days on market $119,000 Active 19 DOM
-
2026-05-30days on market $119,000 Active 18 DOM
-
2026-05-12$119,000 Active 476-char remark
-
2004-05-06soldstatus $53,000
-
2002-10-09soldstatus $29,000 389-char remark
Show marketing remark (389 chars)
HUD OWNED CASE#441-559768.UNINSURED, CASH, CONV, 203K. USE CAUTION!UTILITIES ARE OFF. BUYER RESPONSIBLE FOR ACTIVATING DEACTIVATING UTILITIES FOR INSPEC. APPRAISALS FOR FHA MORTGAGE IS COMPLETE, UTILITIES MUST BE ON FOR OTHER LENDERS APPR. BUYER PAYS 2% TRANSFER. NONCASH BUYER MUST BE PREAPPROVED PRIOR TO MAKE BID. OWNER OCC & SA BONUS ON WEB AT WWW. GOLDENFEATHER. COM. LD8/30/02|
-
2002-09-09historical 389-char remark
Show marketing remark (389 chars)
HUD OWNED CASE#441-559768.UNINSURED, CASH, CONV, 203K. USE CAUTION!UTILITIES ARE OFF. BUYER RESPONSIBLE FOR ACTIVATING DEACTIVATING UTILITIES FOR INSPEC. APPRAISALS FOR FHA MORTGAGE IS COMPLETE, UTILITIES MUST BE ON FOR OTHER LENDERS APPR. BUYER PAYS 2% TRANSFER. NONCASH BUYER MUST BE PREAPPROVED PRIOR TO MAKE BID. OWNER OCC & SA BONUS ON WEB AT WWW. GOLDENFEATHER. COM. LD8/30/02|
-
2002-08-30$32,000 389-char remark
Show marketing remark (389 chars)
HUD OWNED CASE#441-559768.UNINSURED, CASH, CONV, 203K. USE CAUTION!UTILITIES ARE OFF. BUYER RESPONSIBLE FOR ACTIVATING DEACTIVATING UTILITIES FOR INSPEC. APPRAISALS FOR FHA MORTGAGE IS COMPLETE, UTILITIES MUST BE ON FOR OTHER LENDERS APPR. BUYER PAYS 2% TRANSFER. NONCASH BUYER MUST BE PREAPPROVED PRIOR TO MAKE BID. OWNER OCC & SA BONUS ON WEB AT WWW. GOLDENFEATHER. COM. LD8/30/02|
-
1998-02-17soldstatus $55,500
-
1994-11-01soldstatus $48,900
ⓘ Source: listings_history table (triggers on properties + properties_extension) + one-shot
backfill from property_details.listing_events for pre-trigger history.
Tax reassessment forecast PA · Partial reset (capped growth)
- Current annual tax
- $2,998 · $250/mo
- Projected year-2 tax
- $2,998 · $250/mo
- Expected delta
- $0/yr ($0/mo · 0.0%)
ⓘ Screening estimate from a state-policy table — verify with the county assessor before closing.
Climate risk First Street
- Flood 1/10 Low FEMA zone X (unshaded) · 0% chance over 30 yrs
- Wildfire 1/10 Low
- Heat 5/10 Major 7 d/yr ≥102°F today · 15 d/yr by 30 yrs out
- Wind 4/10 Moderate 10% chance of damaging wind over 30 yrs
- Air quality 3/10 Moderate 3 unhealthy d/yr today · 5 by 30 yrs out
Nearby sold comps map
Loading sold comps map…
Walkable amenities ~0.75 mi
Loading nearby amenities…
Taxation est. · year 1
- Rental income
- $17,656
- − Mortgage interest
- −$6,666
- − Property taxes
- −$2,998
- − Insurance
- −$595
- − Repairs & maintenance
- −$1,412
- − Management
- −$1,412
- − Depreciation
- −$3,462
- Taxable income
- $1,110
- Est. tax owed @ 24.0%
- −$266
- After-tax cash flow
- $2,600/yr
For passive investors: Depreciation is non-cash, so a rental often shows a tax loss while cash-flowing — sheltering income. Rental losses are passive: they offset passive income freely, and up to $25,000/yr can offset ordinary (W-2) income if you actively participate and your MAGI is under $100k (phasing out to $0 by $150k); unused losses carry forward. On sale, claimed depreciation is recaptured at up to 25%, and gains may owe capital-gains tax (a 1031 exchange can defer both). Figures are a year-1 estimate at your 24.0% rate — not tax advice; consult a CPA.
Schools (NCES district)
- District
- York City SD
- NCES district ID
- 4226820
- Math proficiency
- 4% ▼ -7.00%
- Reading proficiency
- 16% ▼ -9.00%
- Median HH income
- $29,470
- Composite
- 7.61/100
- National rank
- #9943
- State rank
- #534 of 539 in PA
Livability — York
- Score
- 75/100
- State rank
- #427
- US rank
- #3987
Category grades
Schools grade is shown separately in the Schools card above.
Census & demographics
- Census place
- York, PA
- County
- York County · 278,806 people
- City population
- 184,764
- Metro
- York-Hanover, PA
- Population (ZIP)
- 40,287
- Household income
- $75,384
- Rent vs Own
- Severe rent burden
- 1305.0
Population outlook (York County) Hauer SSP2
- Today (2025)
- 454,205 people
- By 2030
- 457,407 · +0.7%
- By 2040
- 457,529 · +0.7%
- By 2050
- 448,261 · -1.3%
- By 2075
- 427,388 · -5.9%
- By 2100
- 384,218 · -15.4%
Race, ethnicity, and origin ACS 2023
- Neighborhood character
- Diverse neighborhood (Simpson 0.58)
- Race & ethnicity
- White 60% Hispanic / Latino 20% Black 12% Two or more races 9% Asian 3%
- Hispanic origin (detail)
- Mexican 3% Puerto Rican 10% Dominican 3%
- Common ancestry
- Romanian 3% Lithuanian 1% Slovak 1%
- Foreign-born
- 10% · Canada, Vietnam, Jamaica
- Languages at home
- 81% English-only · Spanish 14% Other Indo-European 1% Arabic 1%
Political lean MEDSL · York
- 2024 margin
- Strong R (+25.3) · D 36.9% · R 62.1%
- 2008→2024 swing
- -11.7pp toward R · 2008: -13.6pp · 2024: -25.3pp
- All cycles
- 2024: R+25.3 2020: R+24.6 2016: R+29.3 2012: R+21.2 2008: R+13.6
Not yet ingested
- Civics
- —
Market trends
- HPI YoY
- ▼ -104.51%
- Current HPI
- 284.0731
- Rent YoY
- ▲ 4.43%
- Metro
- York-Hanover, PA
- State GDP YoY
- ▲ 1.68%
- F500 in state
- 34
Industry mix (Fortune 500 HQ in PA)
| Industry | F500 HQs | Revenue |
|---|---|---|
| Healthcare | 2 | $309B |
|
||
| Insurance | 2 | $27B |
|
||
| Telecommunications / Media | 1 | $124B |
|
||
| Industrial Distribution | 1 | $22B |
|
||
| Financial Services | 1 | $20B |
|
||
| Chemicals / Materials | 1 | $18B |
|
||
Price history
+143.4% since first listed8 events — show timeline
- 2026-06-02 Price Changed $118,999 BRIGHT MLS
- 2026-05-12 Listed $119,000 BRIGHT MLS
- 2004-05-06 Sold (Public Records) $53,000 Public Records
- 2002-10-09 Sold (MLS) $29,000 BRIGHT MLS
- 2002-09-09 Listing Removed — BRIGHT MLS
- 2002-08-30 Listed $32,000 BRIGHT MLS
- 1998-02-17 Sold (Public Records) $55,500 Public Records
- 1994-11-01 Sold (Public Records) $48,900 Public Records
Property tax history
+0.8%/yrLatest (2026): $2,998 · +1.6% YoY. Source: county tax records.
Cash-flow waterfall
monthlySold comps — $/sqft
last 12 mo · ≤1 miLoading sold comps…